|
Our Blogs have been moved to Substack, you can find them here and here (this second one is used only for the newsletter).  Most sensors these days use a technology called photoplethysmography (PPG) to measure heart rate variability (HRV). For example, phone cameras as used in HRV4Training, or dedicated sensors as present in Oura rings or Garmin watches, all use this technology to capture changes in blood volume during a cardiac cycle, and report HRV. While we use the term HRV, in this context we should be talking about pulse rate variability (or PRV), as what we are actually measuring are PPG-derived changes in pulse rate, not in heart rate. We should be talking about HRV only if we do measure changes in heart rhythm (as opposed to pulse rate), but to do that, we need a different type of technology: electrocardiography (ECG). This is the technology used by more cumbersome devices with sticky gel electrodes or patches, or simply chest straps. The questions I’d like to address in this blog are the following: is HRV the same as PRV? Can we use wearables and phone cameras to track HRV? What are the differences and similarities between these two methods? Full article, here. 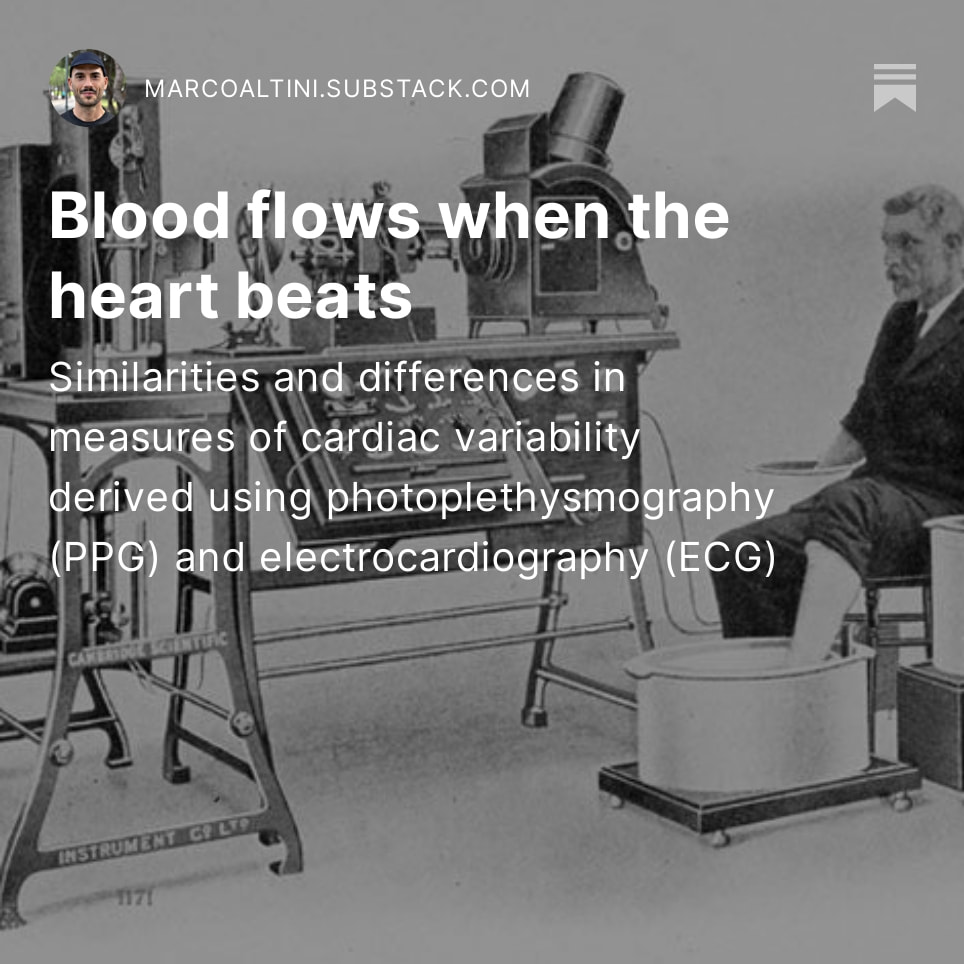 In the past year, I’ve started recommending measuring HRV while sitting, as opposed to lying down. I came to this conclusion after several conversations with a trusted expert in the field (Andrew Flatt), self-experimentation in different positions over an entire year (so that I could look at the relationship between the data and various acute and chronic stressors), and reading the available literature. I now consider sitting the best and most effective way to capture data. In this post, I would like to elaborate more on why this is the case, covering the rationale, physiological mechanisms, and research and providing some practical recommendations. Full article, here. 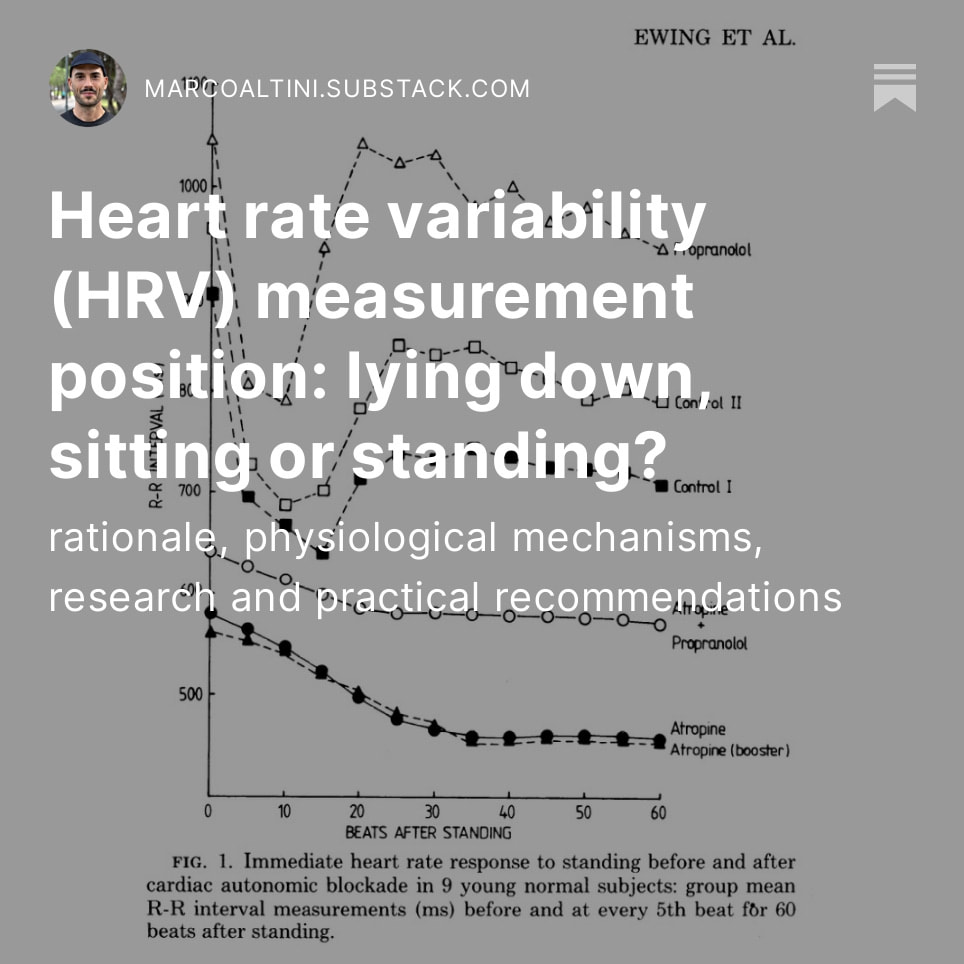 As it becomes easier and easier to capture HRV data (or at least PRV, the version of HRV captured when using optical methods via PPG), it follows that the interest grows in measuring HRV all the time.
In this blog, I’d like to argue against this approach or at least provide some pointers related to why we should be very cautious. Some of my reasons have to do with physiology, others with the technology, and yet some more with the interpretation of the data. Full article, here. The Apple Watch is the best-selling wearable sensor out there. It packs great technology but falls short when it comes to heart rate variability (HRV) analysis. As a result, it is of limited practical utility in this context, unless we take care of a few important aspects (despite what some apps claim). In this blog, I will discuss the main limitations and show you how you can make better use of the Watch data for your own analysis of physiological stress in response to training and lifestyle stressors. Full article, here. 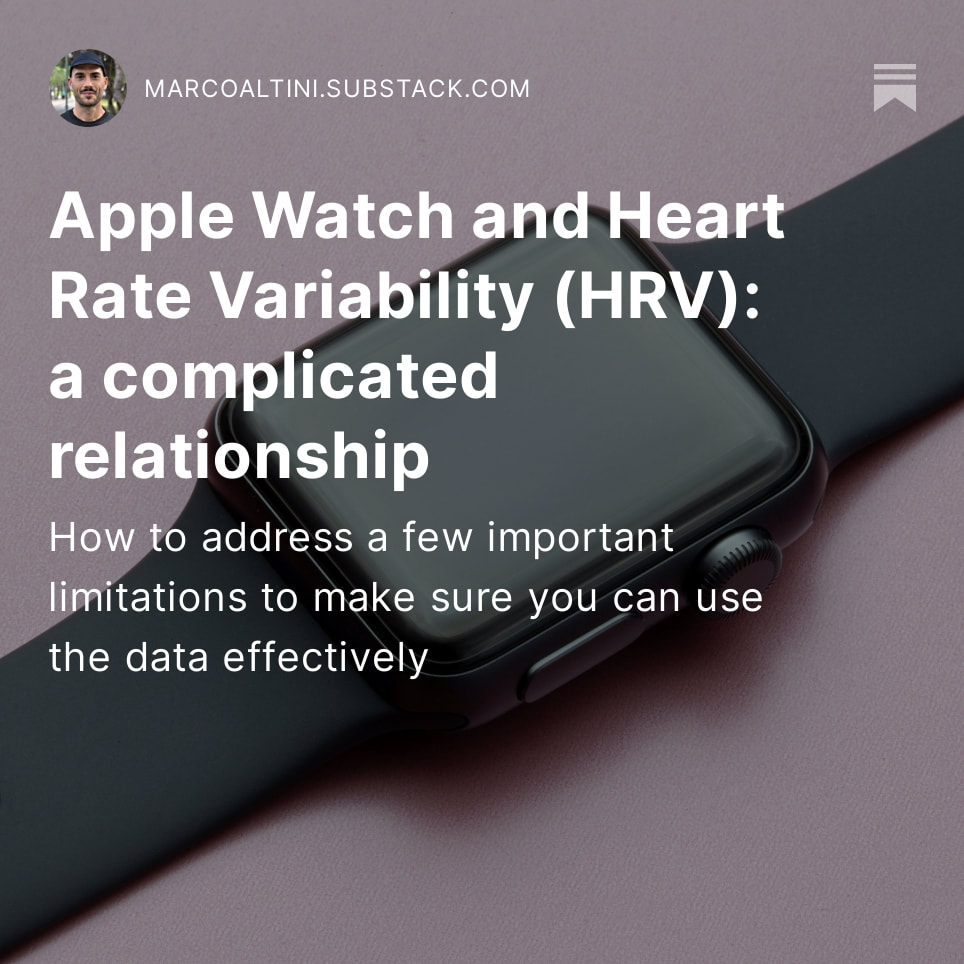 The aim of this blog is to answer the simple question above, i.e. how do you include HRV in your training plan? There are plenty of articles on the basics of HRV and how it might be used to quantify recovery. However, there seems to be still a disconnect between the theory, and getting more practical in using the data effectively. In particular, it is not uncommon for self-coached recreational athletes or beginners to use HRV as their guide to determine day-to-day load management without having a plan, which is in my opinion, a recipe for disaster. Full article, here.  In this blog I’d like to try to address a common concern, i.e. having a relatively low HRV. It is only normal to get worried considering the amount of misinformation out there, and our poor understanding of what different values might mean. The first thing we need to realize is that there is great uncertainty on the topic, which - if anything - highlights how being on the lower side of the spectrum certainly doesn’t determine our destiny. Full article, here.  This blog and case study was written by Fuminori Takayama. Fuminori is a Certified Strength and Conditioning Specialist (CSCS) with a Ph.D. in Health and Sport Sciences. He currently works as a strength and conditioning coach for athletes alongside a researcher. He is also an amateur runner. This article is a discussion of his HRV, training, sleep duration, and aerobic efficiency data for the past year. If you have any questions, comments, or inquiries, please contact Fuminori here. Data collection HRV and sleep duration was collected with an Oura ring. Training data was collected with Garmin GPS watch and Polar sensor (OH1 or Verity Sense). All data was read in HRV4Training and analyzed in HRV4Training Pro in the long term. For more information about aerobic efficiency, see this article. Contextualization of the past year's data As shown in Box1, this period was a training phase for a 24h race held in late May. The purpose of training is to increase volume (km). Training included long-distance running (40-80 km/session) and frequent jogging (about 15km/session). I checked HRV frequently and was careful not to increase the training load when the HRV was trending down. I felt that the approach may contribute to a stable HRV (and a slight increase in HRV). Although I was unable to break my own record from eight years before (181.690km), I was able to perform to a high standard in the race (171.760km). You can read about my approach to the race in this peer-reviewed paper. 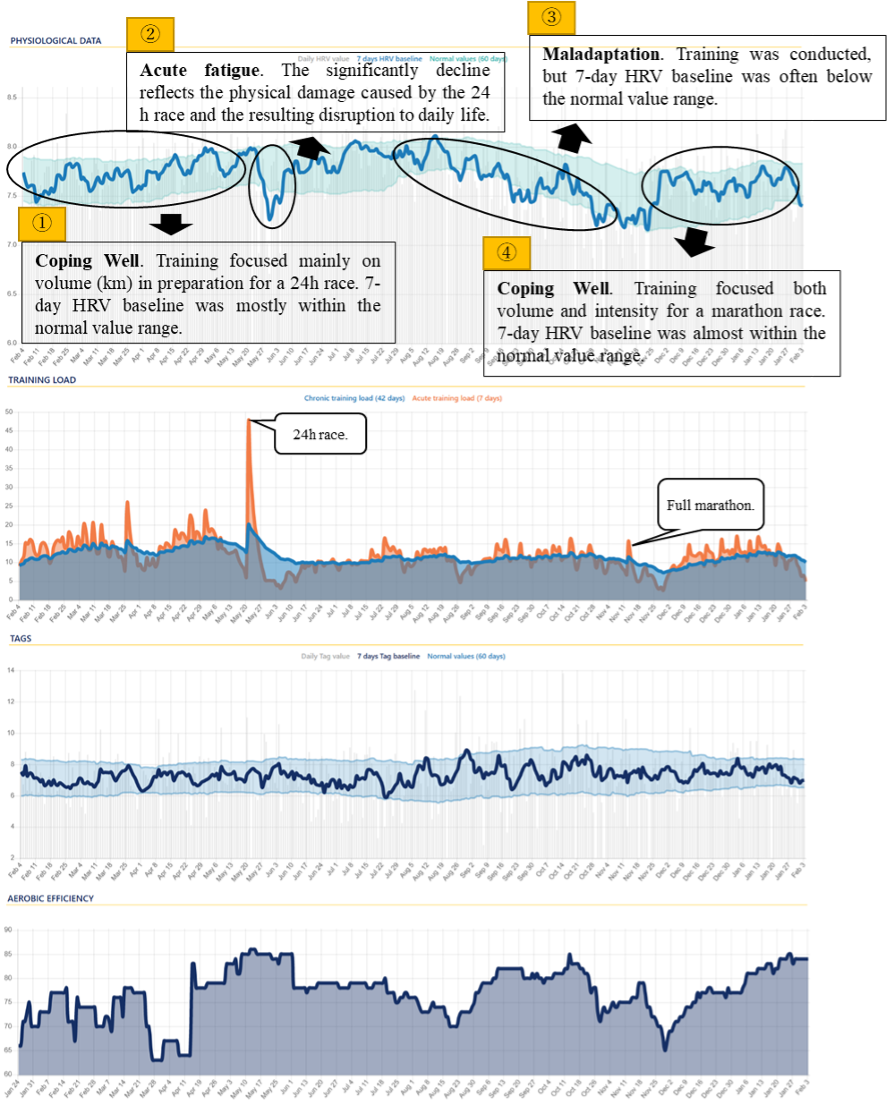 Congratulations to Dan Plews for taking the win at Ironman New Zealand Here are his last weeks of HRV data, showing:
The visualization below, including daily HRV, normal range and baseline, as well as the detected trend (which combines HRV, heart rate and coefficient of variation), is part of HRV4Training Pro, which you can try here if you are using the app: https://www.hrv4t.com all the best for your recovery, Dan 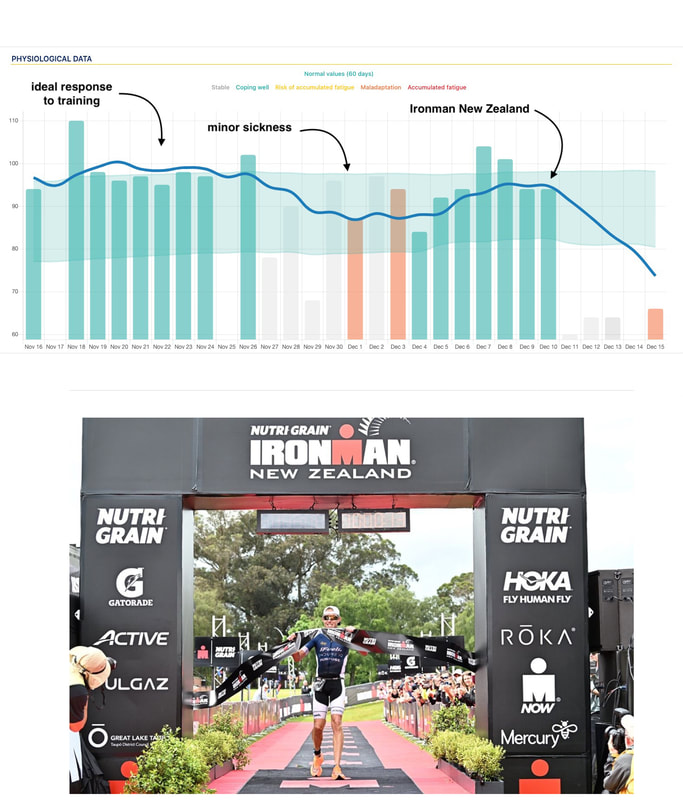 Blog post by Marco Altini More and more wearables have started capturing Heart Rate Variability (HRV) data overnight and combining it with other parameters (e.g. heart rate, sleep data, physical activity) to provide readiness or recovery advice to the user. Despite some inconsistencies over the past years, as of the end of 2022, Oura, Whoop, and Garmin all work in a very similar way when it comes to HRV measurement. However, the way the data is used in all of these tools when building readiness or recovery scores or when providing advice to the user is often problematic and inconsistent. Naive interpretations (higher is better), lack of a normal range (what’s a meaningful change?), and confounding your physiological response with your behavior, are common issues that limit the utility of data collected with wearables. In my latest blog, I cover data analysis and interpretation to provide you with some useful tips and tools that should allow you to make the most of the collected data and ignore inaccurate interpretations provided by most tools out there. Thank you for reading. 
If you have any questions, comments, or inquiries, please contact Fuminori here. This work was partially supported by the research grant from Japanese Society for Running.  In the latest update of HRV4Training Pro, we have added your subjective score to the list of parameters you can pick in the Correlation analysis. You can try the new feature on HRV4Training Pro for free at this link, or use code SCIENCE for 20% off any package. 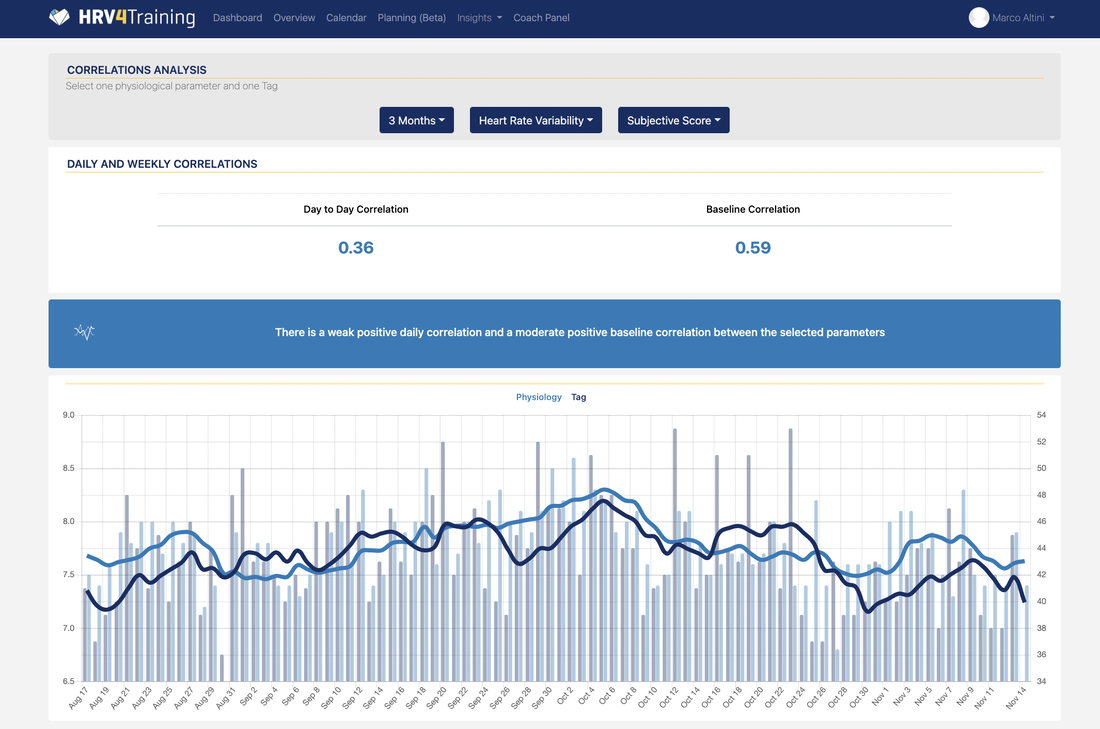 What's the subjective score and how is it used in HRV4Training?The subjective score in HRV4Training aims at capturing how you feel in response to training, and combines: perceived sleep quality, muscle soreness, motivation to train, perceived performance during training. In the app, when providing daily advice (color-coding and message) in HRV4Training we combine your physiology and your subjective feel (outputs) . However, we do not use or include your behavior, for example your activity / training (input). This is a key difference from what you get in terms of readiness or recovery scores in most wearables. Why is that? The whole point of assessing your state, either objectively via heart rate variability (HRV) or subjectively by feel, is to determine how you responded to your given circumstances. You already know the input (behavior) and are assessing the output (physiology or feel). In other words, if I train hard or more for a few days, I want to assess how I responded (output). Including activity (input) in my assessment would mean penalizing me regardless of my body's response. For athletes (of any level), this method is particularly ineffective: it hides information. If you train, there is no point looking at readiness or recovery scores to assess how you are responding to a given training stimulus as these scores confound your response with your behavior. Is the score low because I responded poorly, or just because I did more? The subjective score in HRV4Training is not impacted by these limitations, as it relfects your subjective input. When combined with your physiological response (heart rate, HRV), it can give you a more comprehensive picture of your response, and help you make meaningful adjustments to your plans. What are correlations about?Citing Wikipedia: "Correlation refers to any of a broad class of statistical relationships involving dependence. Familiar examples of dependent phenomena include the correlation between the physical statures of parents and their offspring, and the correlation between the demand for a product and its price. Correlations are useful because they can indicate a predictive relationship that can be exploited in practice." In other words, looking at correlations can help us to pinpoint which parameters have a stronger impact on our physiology, and potentially make adjustments (e.g. if there is a strong negative correlation between work stress and HRV, maybe we should try to reduce work stress). How should I configure this analysis?The correlation analysis in HRV4Training Pro lets you pick any timeframe between 30 days and 2 years. However, in general, we think that using a time frame between 60 and 90 days is ideal. Why is that? Most likely the stressors you face will change over time, and similarly your response to certain stressors will change, therefore we believe it can be more helpful to look at these relationships in the relatively short time frame (e.g. 60-90 days), to get a better idea of what factors are influencing your physiology the most. Shorter windows (e.g. 30 days) might not have enough data, unless some really large stressor was present (for example if you go from sea level to 2000m / 6000ft of altitude, then you will certainly see a strong correlation between resting heart rate and altitude), otherwise it might be better to extend the window. On the other hand, longer windows (e.g. a whole year) might fail to capture more complex, multidimensional relationships between various training and lifestyle aspects, and your physiology. Finally, we would recommend to look at baseline correlations, more than day-to-day correlations. Baseline correlations are computed on the 7 days moving average of each variable, and therefore provide a more stable trend of the data. Typically, this is more insightful than to look at the individual data points, especially in the longer term. Below you can seen an example:
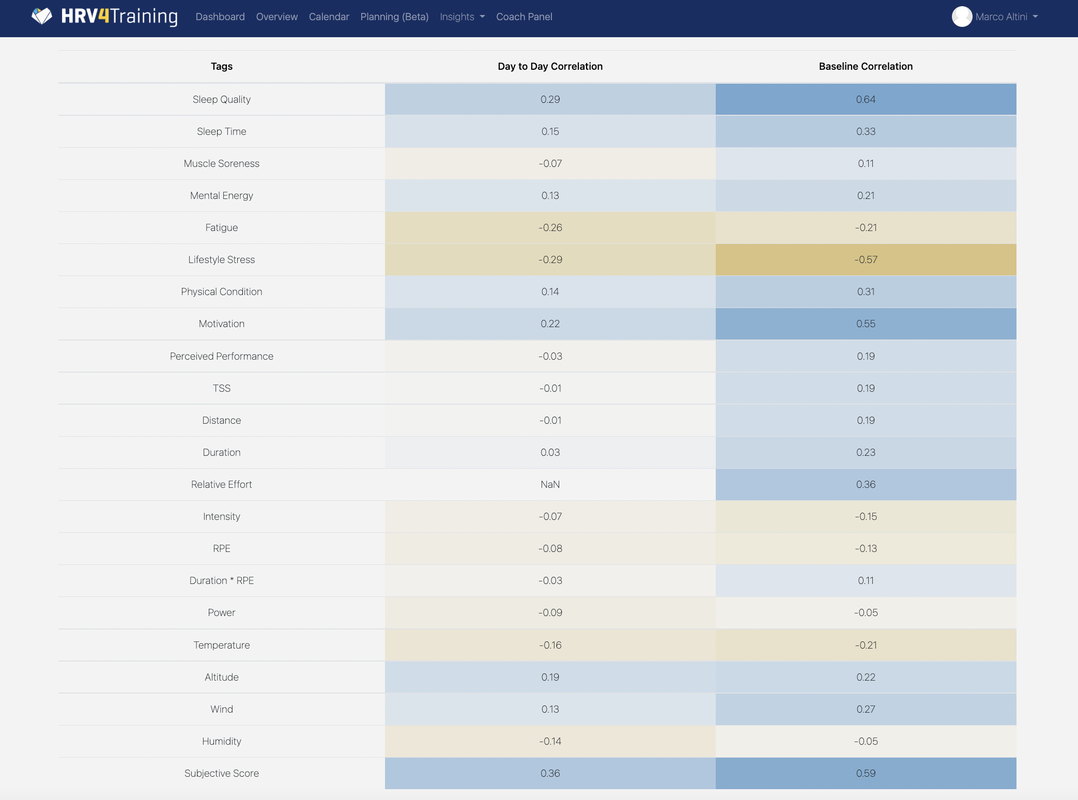 The important part after you start looking at these correlations, is not to jump to conclusions too quickly. For example, it could be that the relation you are seeing is actually caused by another variable excluded by the analysis. However, this can be a useful starting point to explore your data, and we hope the new color-coding will make it a bit easier.
Enjoy Check out the latest HRV4Training update, which allows you to choose rMSSD when configuring which parameters to send to TrainingPeaks, if you have a Pro account. The new update is available for iOS and Android. In this page, you can find an overview of some of the recent Pro features (and a discount code). Enjoy and thank you for your support. 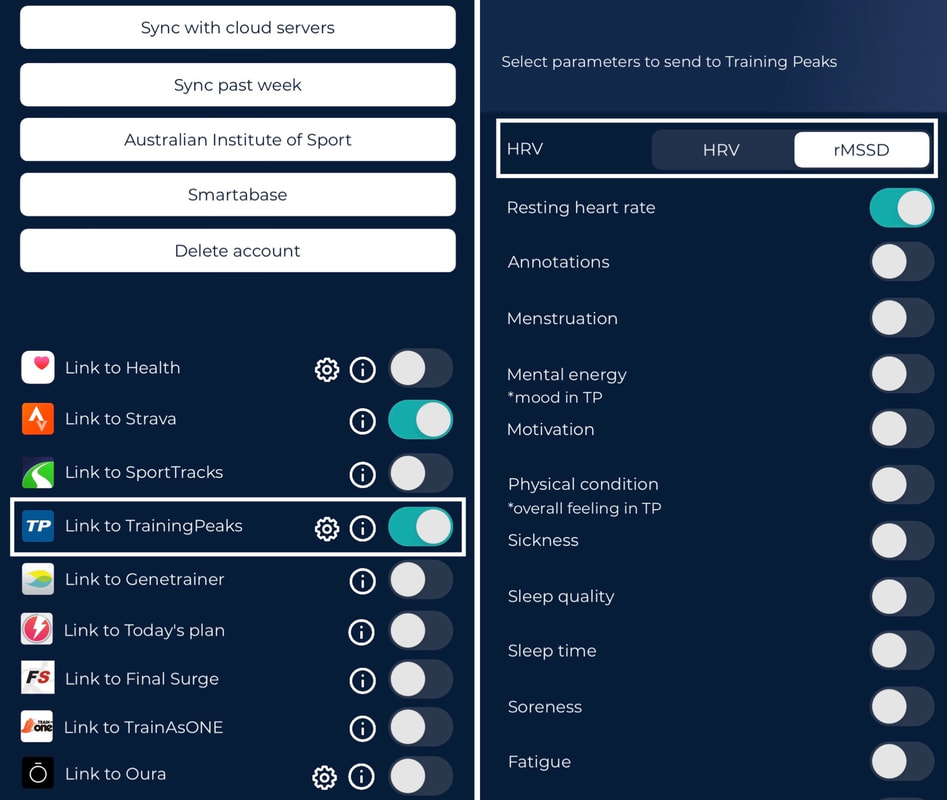 In the latest update of HRV4Training Pro (try it here), we have added your subjective score to the list of parameters you can pick in the Tags view. You can see an example below, where the third plot shows my subjective score in the past few months, which is quite in agreement with my HRV data. In particular, we have first a slow increase over time as I am progressing well with training, eventually racing a half marathon PR, before an acute drop with sickness. 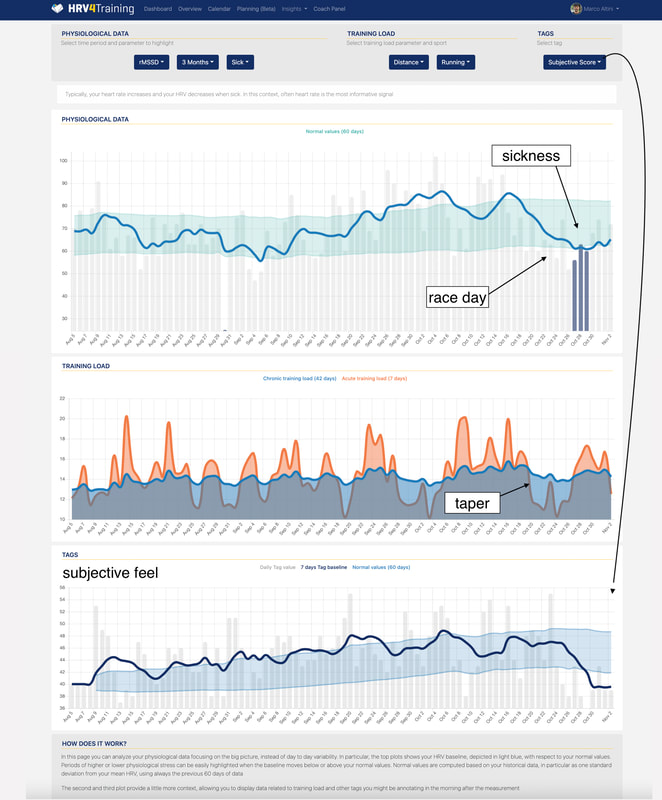 What's the subjective score and how is it used in HRV4Training?The subjective score in HRV4Training aims at capturing how you feel in response to training, and combines: perceived sleep quality, muscle soreness, motivation to train, perceived performance during training. In the app, when providing daily advice (color-coding and message) in HRV4Training we combine your physiology and your subjective feel (outputs) . However, we do not use or include your behavior, for example your activity / training (input). This is a key difference from what you get in terms of readiness or recovery scores in most wearables. Why is that? The whole point of assessing your state, either objectively via heart rate variability (HRV) or subjectively by feel, is to determine how you responded to your given circumstances. You already know the input (behavior) and are assessing the output (physiology or feel). In other words, if I train hard or more for a few days, I want to assess how I responded (output). Including activity (input) in my assessment would mean penalizing me regardless of my body's response. For athletes (of any level), this method is particularly ineffective: it hides information. If you train, there is no point looking at readiness or recovery scores to assess how you are responding to a given training stimulus as these scores confound your response with your behavior. Is the score low because I responded poorly, or just because I did more? The subjective score in HRV4Training is not impacted by these limitations, as it relfects your subjective input. When combined with your physiological response (heart rate, HRV), it can give you a more comprehensive picture of your response, and help you make meaningful adjustments to your plans. Try ProWe hope you will find this feature useful.
Check out HRV4Training Pro at this link or use code SCIENCE for 20% off any plan. Enjoy. HRV4Training is looking for brand ambassadors worldwide We believe in empowering individuals with the ability to measure and interpret physiological data so that training and lifestyle stressors can be better balanced, resulting in improved health and performance Learning from athletes and coaches is an invaluable part of the journey, and we are looking forward to getting to know you and your experience Are you passionate about sport and technology and have been using HRV4Training daily for at least 6 months to better balance stress? We are looking for you! What do we offer to the ambassador and mentors?
What do we expect from the ambassadors and mentors?
We are going to select up to 30 brand ambassadors. We accept applications in English, Italian and Spanish. Would you like to spread the word about HRV4Training in another language? Send us a message with your proposal for our consideration! To participate in the selection process, fill in this google form. Deadline is October 31st, 2022 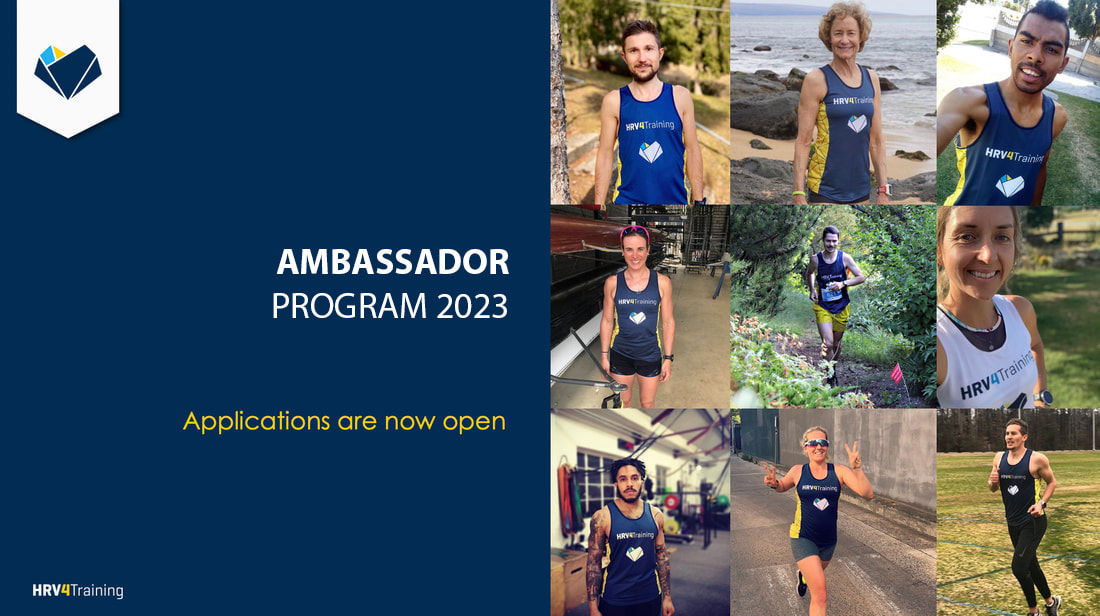 Blog post by Marco Altini We have just released a new feature that allows you to swipe the homepage and see your daily HRV, baseline, and normal range in terms of rMSSD (normally, what we call HRV is a logarithmic transformation of this value) 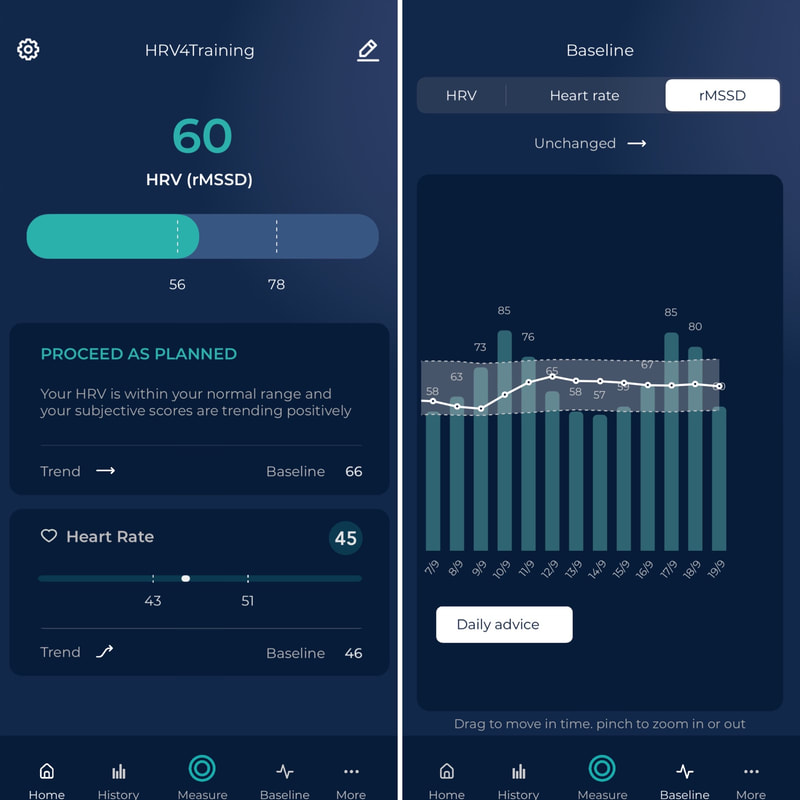 The swiping between views will be enabled if you select rMSSD under HRV View in Settings, and have a Pro plan. Pro enables also the normal range under Baseline (see previous image), and gives you access to the web platform you can try Pro for free here: https://hrv4t.com. With HRV4Training Pro, you get:
Thank you and enjoy In case you would like to use your Oura ring to measure your HRV in the morning, as opposed to the night, you can do so following the procedure below. If you are wondering why you would want to measure HRV in the morning instead of the night, here you can find some useful pointers about the differences between these two measurement times. From the Oura app, tap the plus icon, and start an Unguided session: 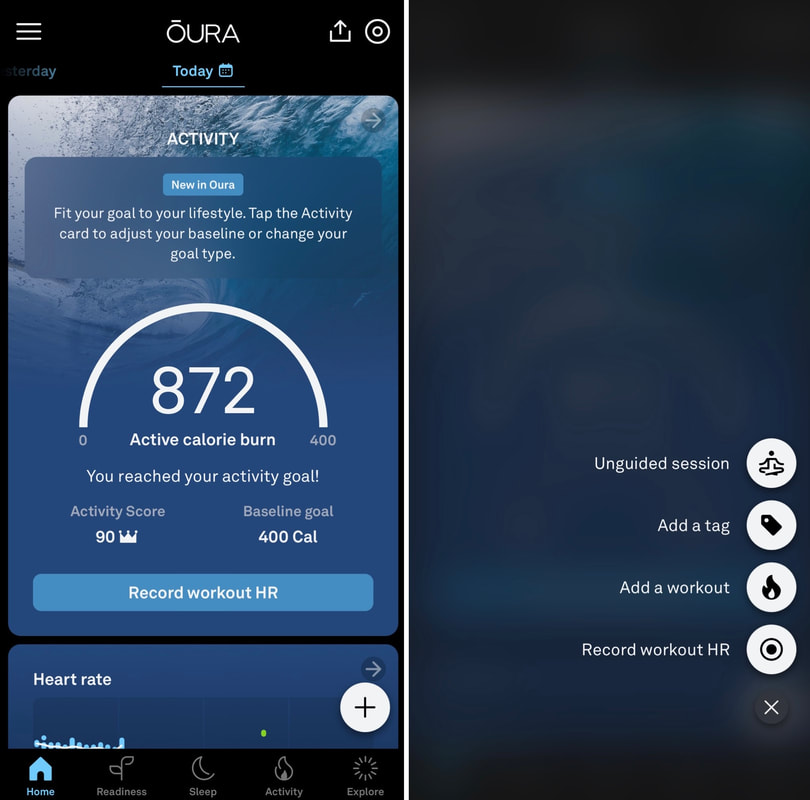 Make sure to set the unguided session duration to 3 minutes, otherwise the ring will not report HRV data, but only heart rate: 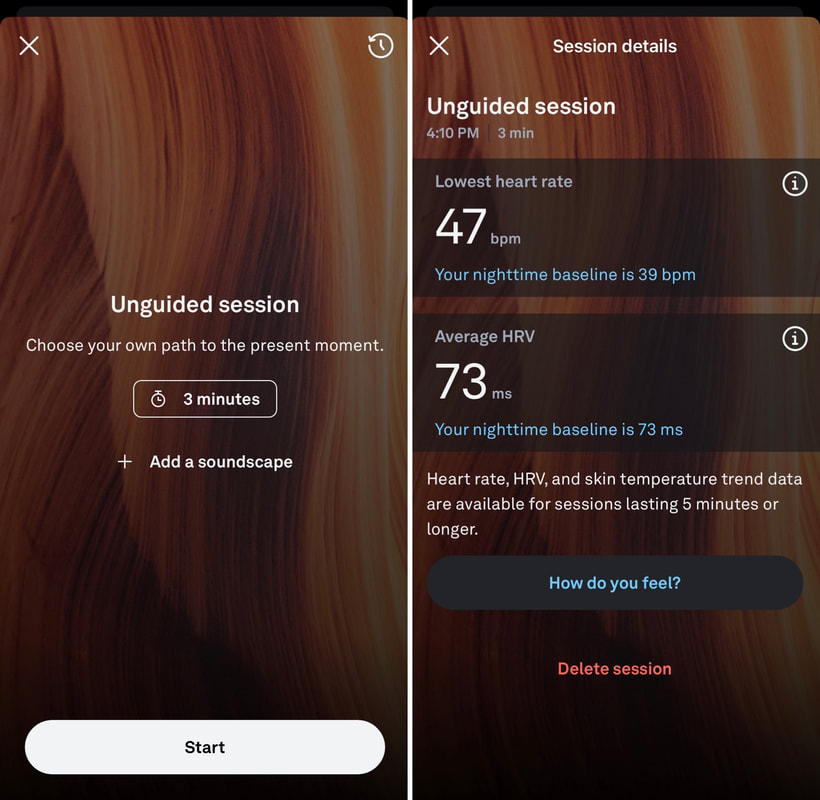 At this point, select Manual Input from Settings in HRV4Training, so that you can enter your heart rate and HRV in the HRV4Training questionnaire, instead of measuring via the app. 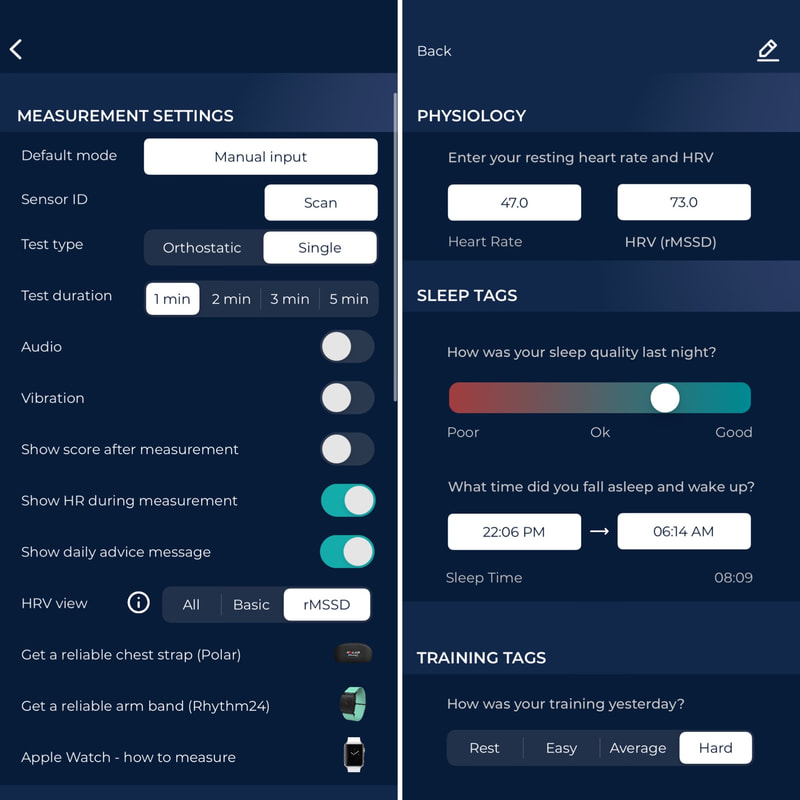 Blog post by Marco Altini 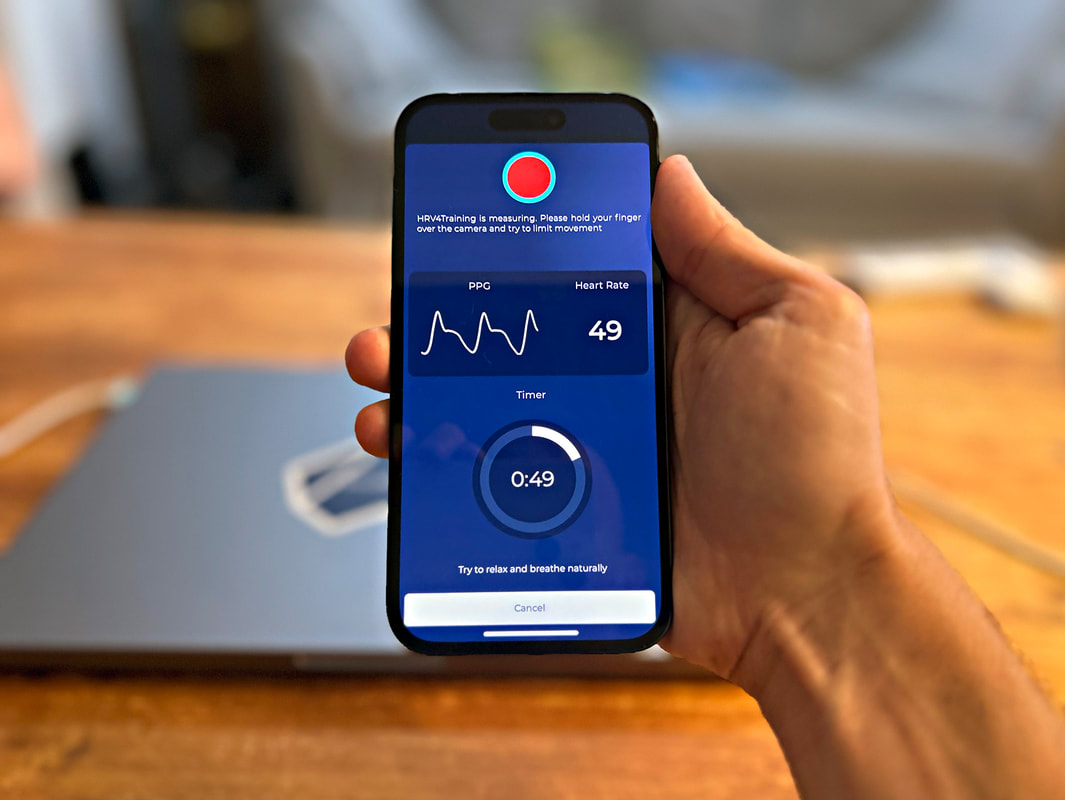 We have been working on adding compatibility for all new iPhone 14 models, and have already released updates for HRV4Training, HRV4Biofeedback (our deep breathing tool), and Camera HRV (our research app) Below is some data collected using an iPhone 14 Pro and compared against a chest strap, the Polar H10 The protocol consisted in the following:
HRV (rMSSD) was 61 ms via ECG (chest strap), and 62 ms via PPG (phone camera), highlighting once again the accuracy of this method. You can see the RR intervals as well, which are a perfect match between PPG from the phone camera and ECG from the chest strap 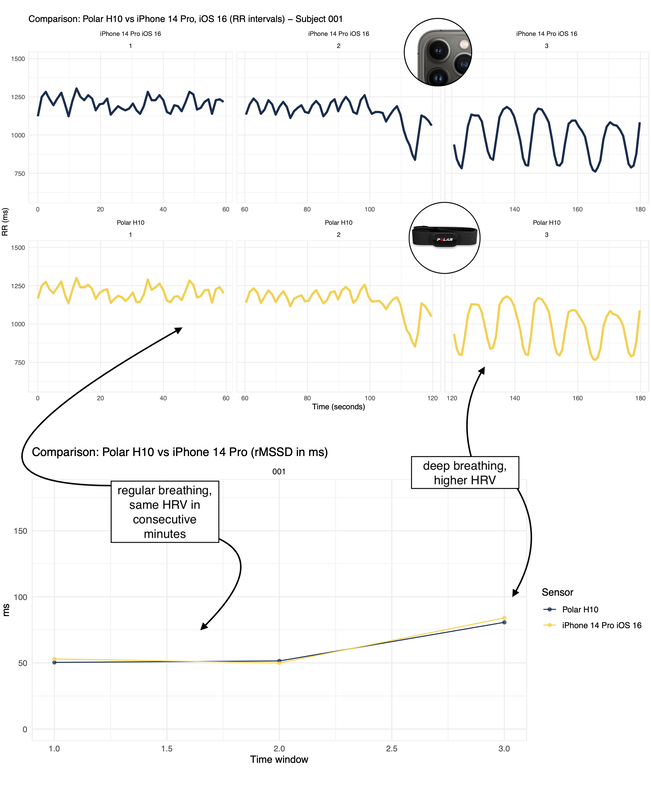 here is an example of how we would recommend holding the phone when using three (left) or two (right) cameras. In case you cannot cover both the flash and the camera at the same time, give priority to the camera, as it is sufficient to be nearby the flash. 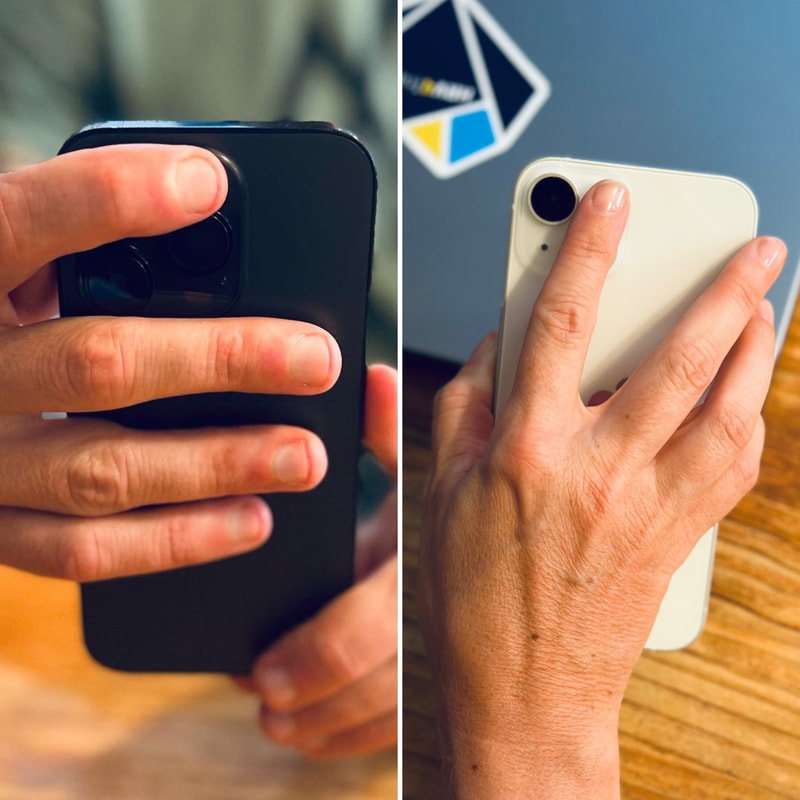 Enjoy the update!
This week is HRV4Training's 9 years birthday, and we are doing a small giveaway You can win either free access to HRV4Training Pro for one year (more info on the web platform can be found at HRV4T.com) or a t-shirt (either the running singlet or regular t-shirt) To participate in the raffle, simply write a post or blog about HRV4Training either on social media (Instagram, Facebook, Twitter, etc.), or on your blog and send us a link (if publicly available) or screenshot via email at [email protected] We are looking forward to learning more about how you use the app and what you find useful. Deadline is next week!  Blog post by Marco Altini We have released Manual Input in HRV4Training, a feature which allows you to enter manually your heart rate and HRV data in the morning, as part of the questionnaire. Below we cover the reasoning behind this feature, and how you can use it. 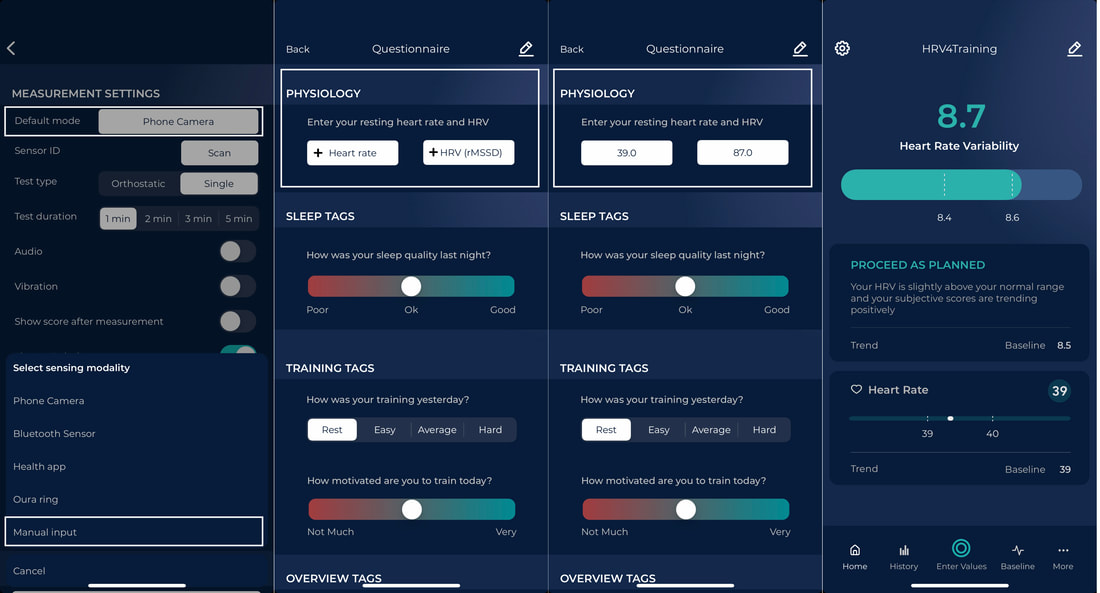 To select manual input, go to Settings and change sensing modality. Then, simply tap "Enter Values" or "Measure" in the homescreen of the app, and the questionnaire will pop up, including an extra section where you can enter your resting heart rate and HRV as reported by another device. You can also edit your data from History, by tapping a measurement bar and opening the questionnaire for a given day. Why Manual Input?More and more devices are providing night HRV data based on optical measurements, with good accuracy. For example, in our recent tests comparing full night electrocardiography (ECG) against the Oura ring, Whoop band and Garmin Forerunner 955, day to day differences in HRV were very similar. 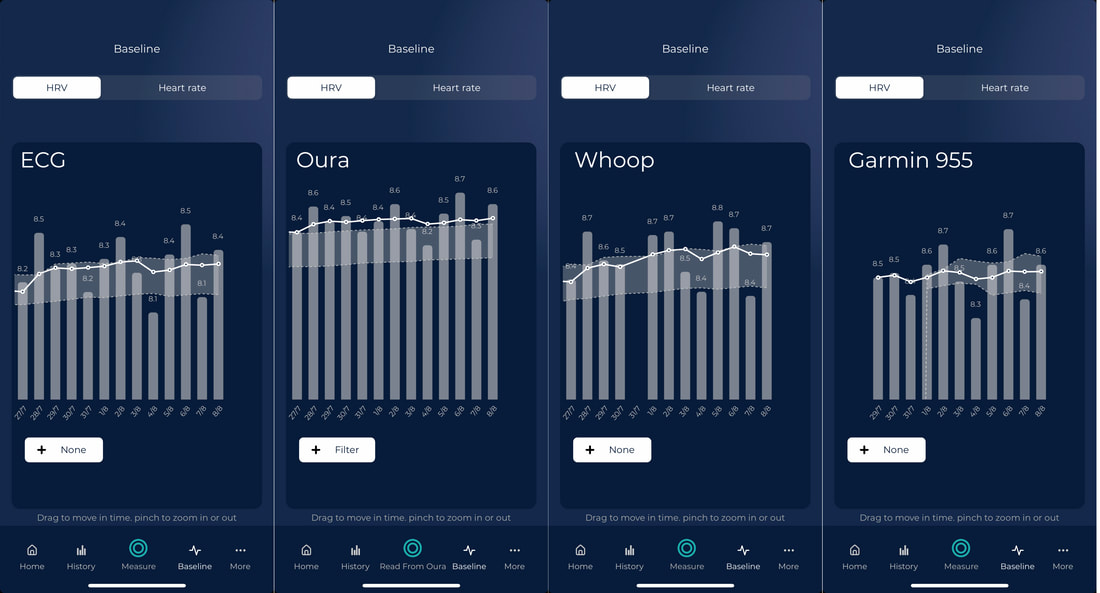 In the graphs above you can see a comparison of ECG data and various wearables. The normal range does not match as different amounts of data have been collected, hence here we should only look at the actual scores, for about two weeks. We can see very good agreement in day to day changes for ECG, Oura and Garmin, with a larger error for Whoop, which is however providing data that is not too far since last year's update in how they compute HRV. So far we have provided a direct link only to Oura. However, unfortunately, this link has resulted in very unreliable data connection due to Oura's API having quite a few problems. Additionally, it seems the API has been shut down for many users, probably due to the new subscription model or using the older ring. Similarly, other wearables do not have APIs (e.g. Whoop) or we simply do not integrate with them (e.g. Garmin, Fitbit, etc.). Since we are talking about just two numbers here (resting heart rate and HRV, I have covered elsewhere how the full night average is the only meaningful parameter to use when measuring during the night), Manual Input makes it really simple to avoid all issues above, and allows you to enter your data as part of the morning questionnaire, regardless of the wearable you use. Why should I use HRV4Training if I already have a wearable?Simply put, HRV4Training is the only platform that provides you with an analysis of your physiology that matches how this data is used in state of the art research and applied practice. This means analyzing your resting physiology with respect to your normal range, and providing you with feedback regarding your acute (daily) and chronic (weekly) physiological state, in response to the various stressors you face. While in most tools you can look at your HRV numbers, these numbers are not contextualized with respect to other events (e.g. annotations you report in our questionnaire), or even with respect to your historical data. Is today's reduction in HRV meaningful or just part of normal day to day variability? Entering your data in HRV4Training allows you to answer this question using published methods, which aim at effectively assessing your physiological response. In the homescreen of the app you can easily see for example your daily scores with respect to your weekly baselines and normal ranges. In particular, the normal ranges are built using the previous 2 months of data, and allow you to quickly understand your current physiological response. You can learn more about why you should focus on your actual physiology as we do in HRV4Training, as opposed to made up scores provided in wearables, in this blog and this podcast. 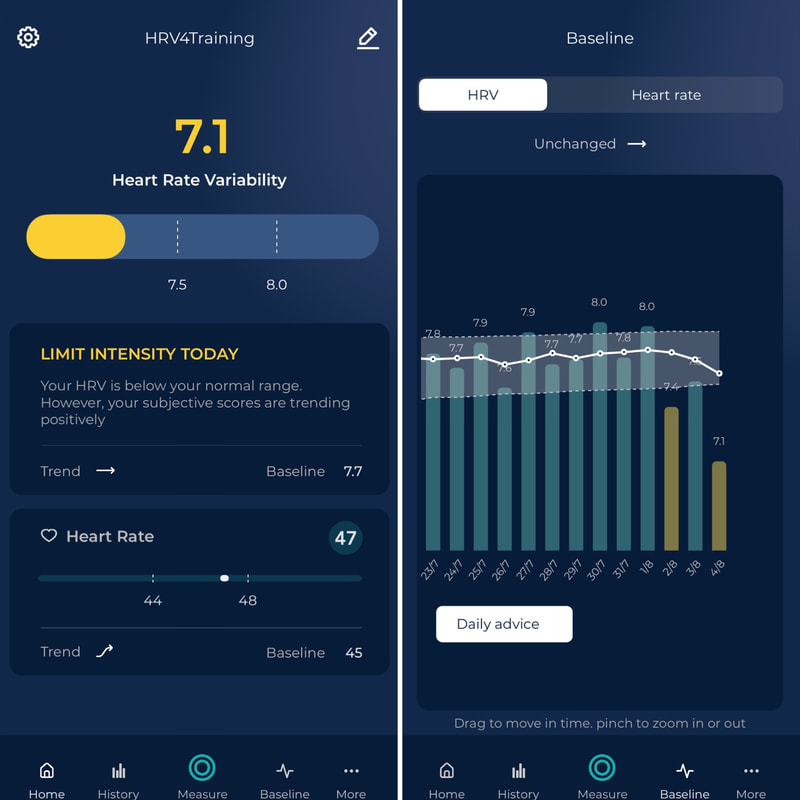 What data should you enter?Wearables use slightly different methods and sensing locations to measure your HRV. These differences make it so that the data is not interchangeable, but the relative changes, which are the only aspect that really matters, are. Hence, it is important that if you wear a wearable, you try to use always the same device and place it on the same arm, finger, etc, since the relative position of the sensor with respect to the heart, can cause differences in pulse rate variability. If you use a Whoop band, enter your night resting heart rate and HRV as found in the app. If you use an Oura ring, enter your average night heart rate (not what they report as resting heart rate, which is the lowest, enter the average instead) and your average HRV. If you use a Garmin, enter your night average HRV and your resting heart rate (Garmin uses the 30 minutes of the night in which it was the lowest). 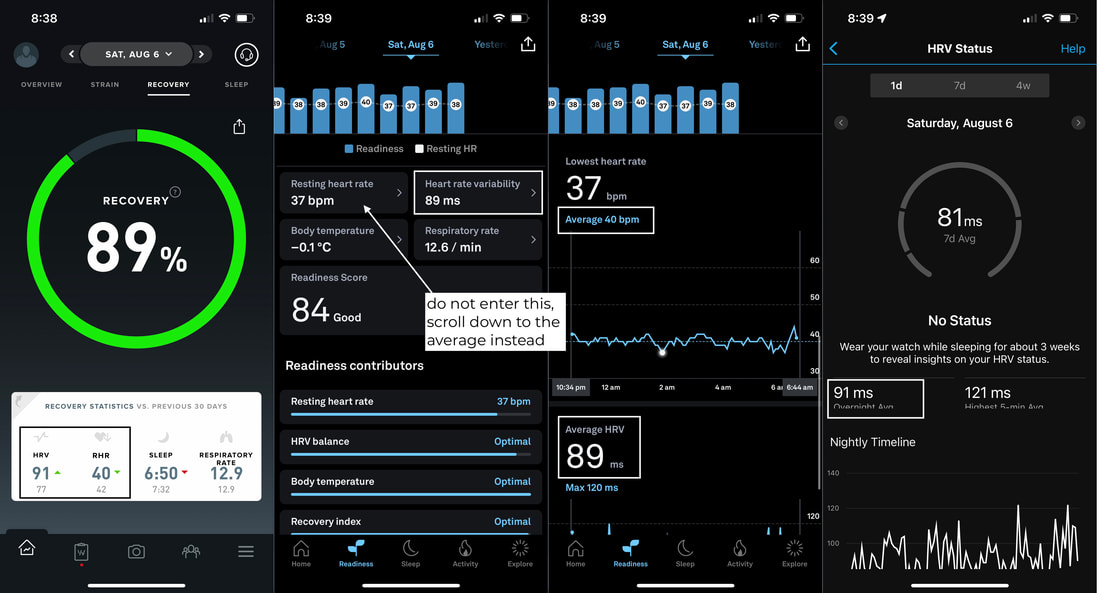 Do you need a wearable?If you do not have a wearable and you have been measuring your physiology in the morning daily, you probably do not need a wearable and can save some money.
If you are struggling with compliance for your morning measurement and would like to collect data passively, a wearable can help. In any case, check out this blog to better understand some of the important differences between morning and night measurements of resting physiology. I hope you'll find the update useful, thank you Blog post by Marco Altini 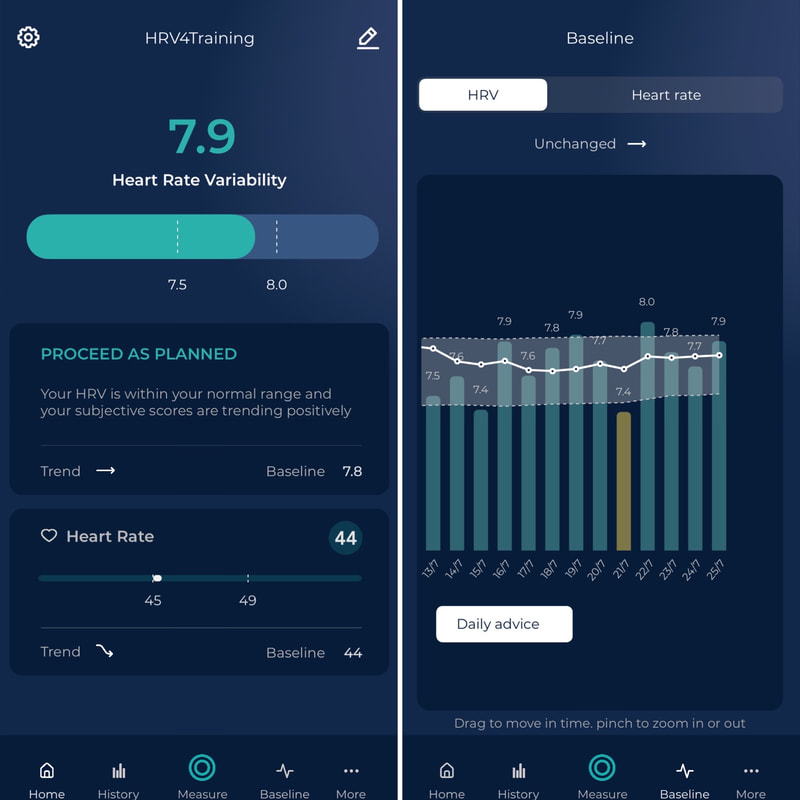 When providing daily advice (color-coding and message) in HRV4Training we combine your physiology and your subjective feel (outputs) . However, we do not use or include your behavior, for example your activity / training (input).
this is a key difference from what you get in terms of readiness or recovery scores in most wearables. Why is that? The whole point of assessing your state, either objectively via heart rate variability (HRV) or subjectively by feel, is to determine how you responded to your given circumstances. You already know the input (behavior) and are assessing the output (physiology or feel). In other words, if I train hard or more for a few days, I want to assess how I responded (output). Including activity (input) in my assessment would mean penalizing me regardless of my body's response. For athletes (of any level), this method is particularly ineffective: it hides information. If you train, there is absolutely no point looking at readiness or recovery scores to assess how you are responding to a given training stimulus as these scores confound your response with your behavior. Is the score low because I responded poorly, or just because I did more? This approach not only provides you with poor information about your actual response, but fools you to believe the tool works. You go hard or do more, and they tell you you need to recover. In fact, you might be doing very well and be ready for another big training block. This is not to say that your behavior does not matter: it is key context you can use to understand what could be driving changes. However, it should not be used to determine your response (output). You want to learn about the output of the system (physiological or subjective response) given the input (behavior and other). There are many nuances that are worth understanding a bit better if we want to make good use of available technology. Hopefully, this explains a bit why it is worth assessing your physiology and feel, while you can ignore most (all?) made-up scores. Blog post by Marco Altini In their recent paper, Dajo Sanders, David Spindler, and Jamie Stanley show a really well-presented case study of the impact of different stressors (heat, psychological, training) on resting HR and HRV (as well as self-reported parameters such as mood and motivation). In the figure below, showing resting heart rate and HRV in relation to different annotations (for example health issues or training in the heat), we can clearly see how HRV is often more sensitive to stress, as it is associated with longer-lasting suppressions. This is in line with what we have reported in our recent analysis as well. 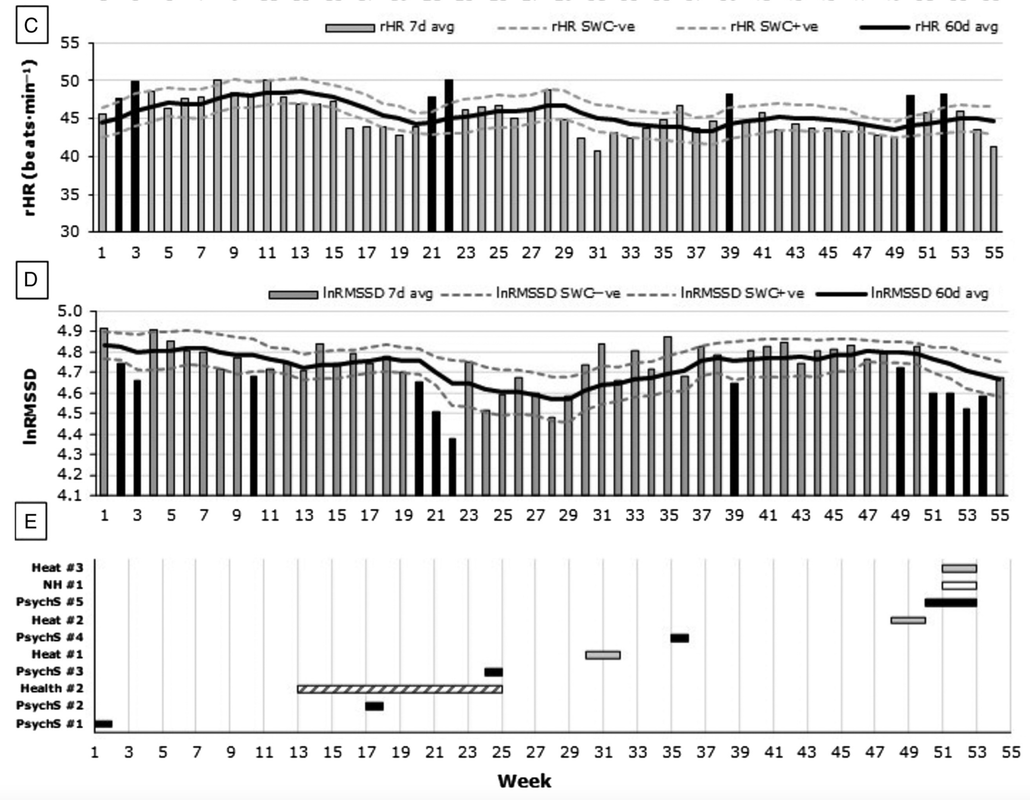 Resting heart rate and HRV data was collected using HRV4Training for one minute in the morning, as we covered last week in our article on guidelines for morning measurements. Finally, note how the authors report daily values with respect to the smallest worthwhile change, what we call the normal range in the app. Comparing daily values to our normal range is the only meaningful way to assess if daily values are different from what is expected when no stressors have a large impact on our resting physiology. Small variations within our normal range should not concern us or lead to any changes. You can enable the normal range in the Baseline view of HRV4Training once you login at HRV4T.com and start your free trial or purchase a Pro subscription. You can use code SCIENCE at checkout for a 15% discount on Pro. 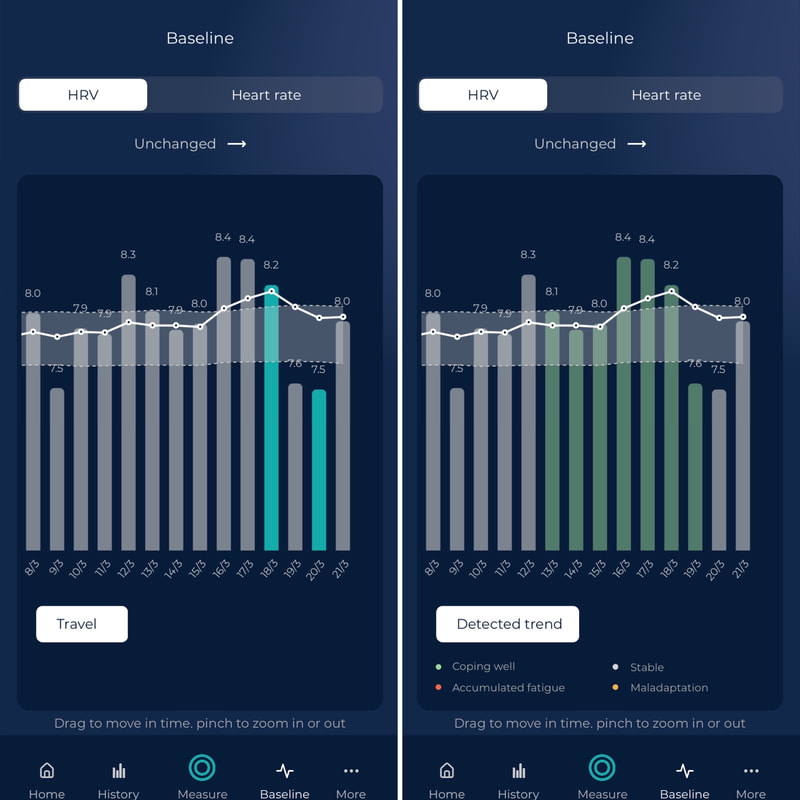 In our latest blog, we provide guidelines and practical tips for morning HRV measurements:
Learn more here 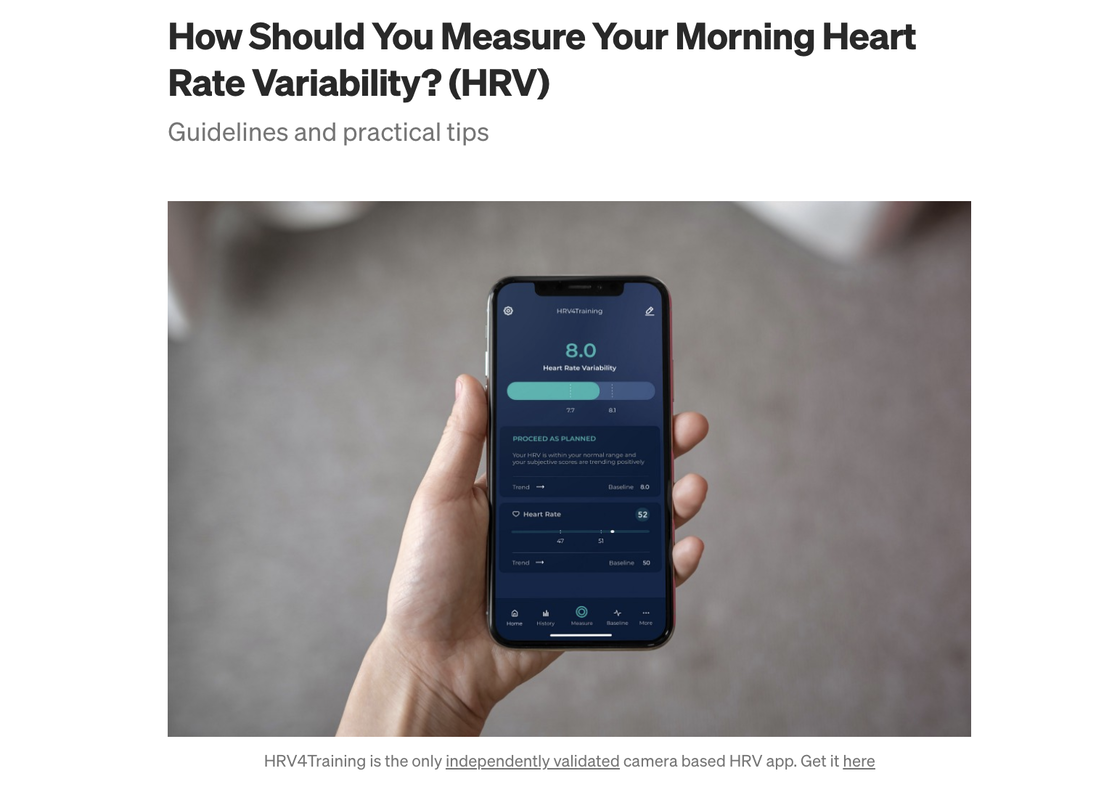 Blog post by Marco Altini To make sense of changes in physiology (in particular, HRV and heart rate), we need to interpret them with respect to what we call your "normal range". In the scientific literature, this is called the smallest worthwhile change (or SWC). In this short blog, I will cover our reasoning when it comes to how much data we should include to determine your normal range: a key aspect that will determine how changes in HRV are interpreted to provide you with useful advice. If you are new to the concept of the normal range or SWC, please check out this blog post first. How much data should we include?In the context of analyzing relative changes over time, for example to identify periods of higher stress, there are two important trade-offs to consider when it comes to resting heart rate and HRV:
In the scientific literature, for practical reasons, often one month is used to determine the normal range. However, we need to realize that scientific studies typically face obvious constraints (e.g. time and budget) and as such, might be trying to shorten the time required to capture an individual's normal range. I would like to argue that this is too short and ineffective to capture longer-term decouplings between baseline (weekly average) and your normal range. Let's look at an example: 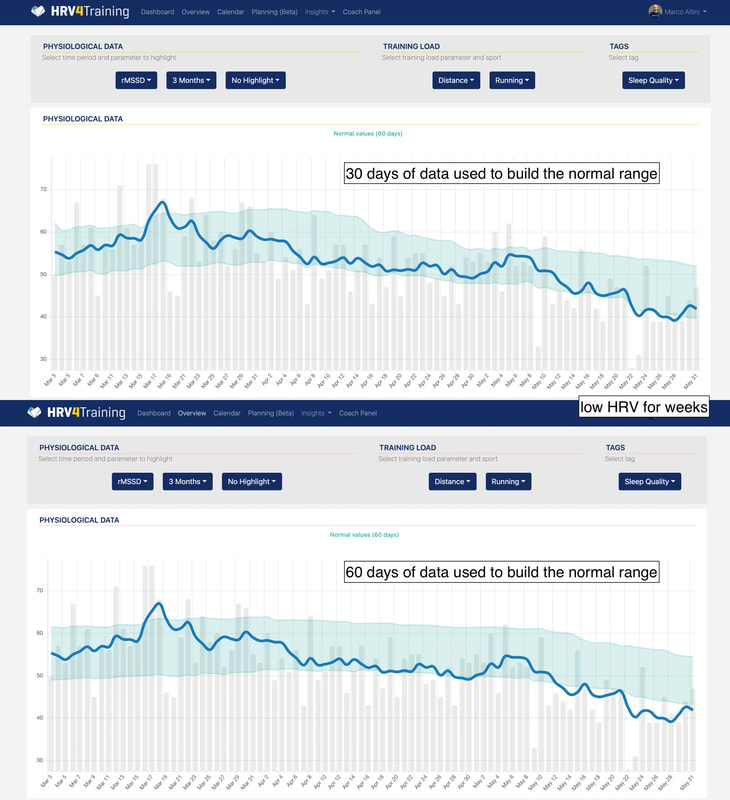 In the data above, towards the end of the 3 months, we can see a few bad weeks where HRV is quite suppressed. Let's look at the first graph first. If we were to build the normal range using only a month of data, the normal range would change too quickly: it would always include the baseline (blue line) despite a very large change in daily scores. In other words, if we use short windows, we are almost always within normal range. Now moving to the second graph. When using 60 days of data to build the normal range, we can see how the normal range decouples more effectively from the baseline and daily values. In this case, we can clearly see that we are in a negative phase of suppressed daily and baseline HRV, with respect to our normal range. In HRV4Training we use 60 days of data for these reasons. Obviously, there are always trade-offs to make and no choice is perfect, but in our experience, 2 months is an ideal time frame when looking at HRV data: you are not too reactive and can capture acute drops, you don't get stuck in very old data and seasonal changes. You can try Pro for free by logging in here. Once you are logged in, the Baseline page in the app will also show your normal range, as shown below. Use code SCIENCE for 15% off. Enjoy 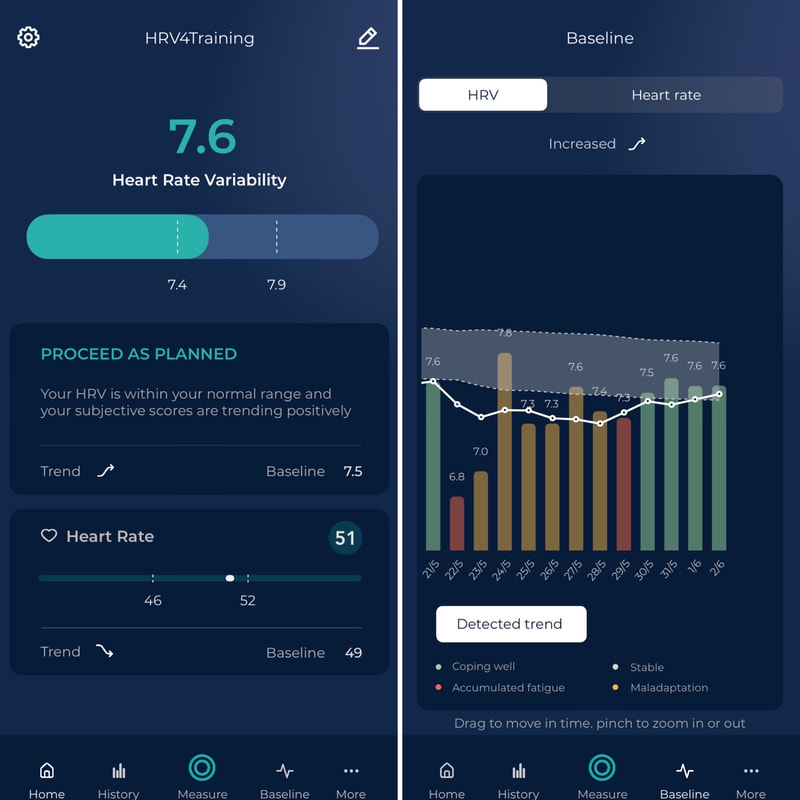 Blog post by Marco Altini We have just released a new version of HRV4Training for iPhone and Android, which deploys our latest VO2max model. In particular, this model better accounts for hilly terrain and provides more accurate VO2max estimates for runners that train on hills. Normally, the relationship between running speed and heart rate is used to estimate VO2max, as we cover in more detail here. Intuitively, a lower heart rate at the same speed, means that you are getting fitter. However, this relationship falls apart when we run on trails, or include much elevation gain in our runs. Below is an example of my own data, where you can see a few things:
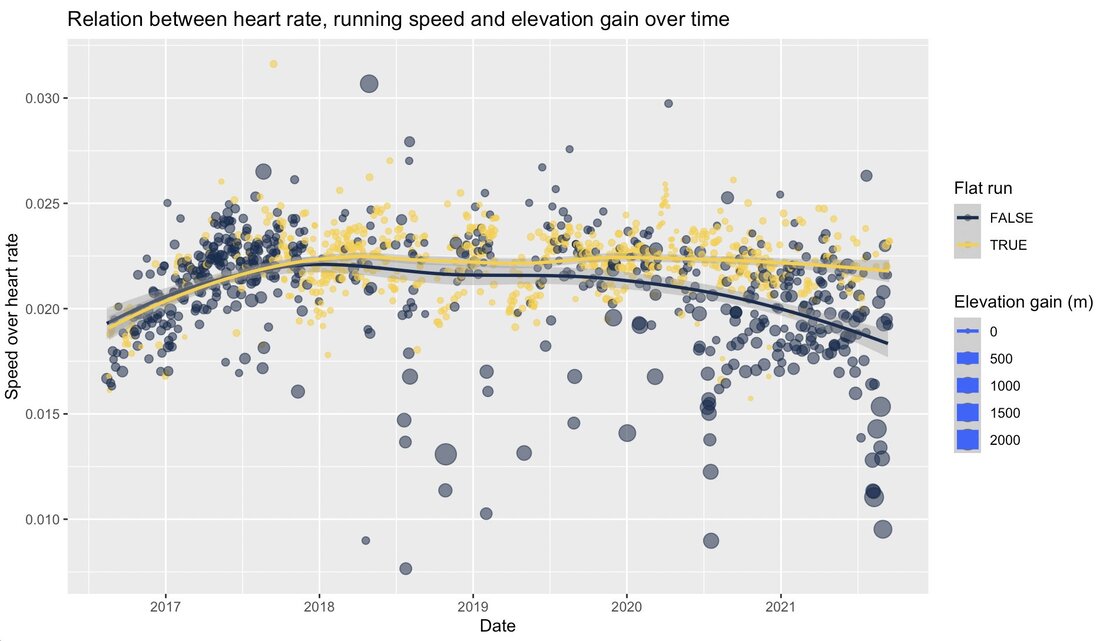 In the last part of the graph you can see how my interest shifted toward trail and ultrarunning (very few flat runs). As a result, VO2max estimates show a large decrease. In fact, little change is present in speed over heart rate when looking only at these flat runs (yellow line). This makes it hard to track progress in aerobic efficiency or VO2max (or whatever you want to call how your heart rate changes at a given speed). With the newly released model, we are able to better account for these changes, and provide a more accurate estimate. To build this, we modeled the difference in estimated VO2max for the same person when running flat vs hilly, in relation to the average grade of the runs (N = 10 000). There are of course still limitations, for example no knowledge of how technical is the terrain, but it should be an improvement. Below are results showing the original estimate (which was a match with testing in the lab), then the poor performance of the model on hilly runs, and the updated results today, for me (right) and Alessandra (left). We both had an accurate estimate when living in The Netherlands, then got a reduction in VO2max simply because of the different efficiency (relationship between pace and heart rate) when running on hills in Italy, and then finally you can see the prediction of the new model, which is close to the original one. 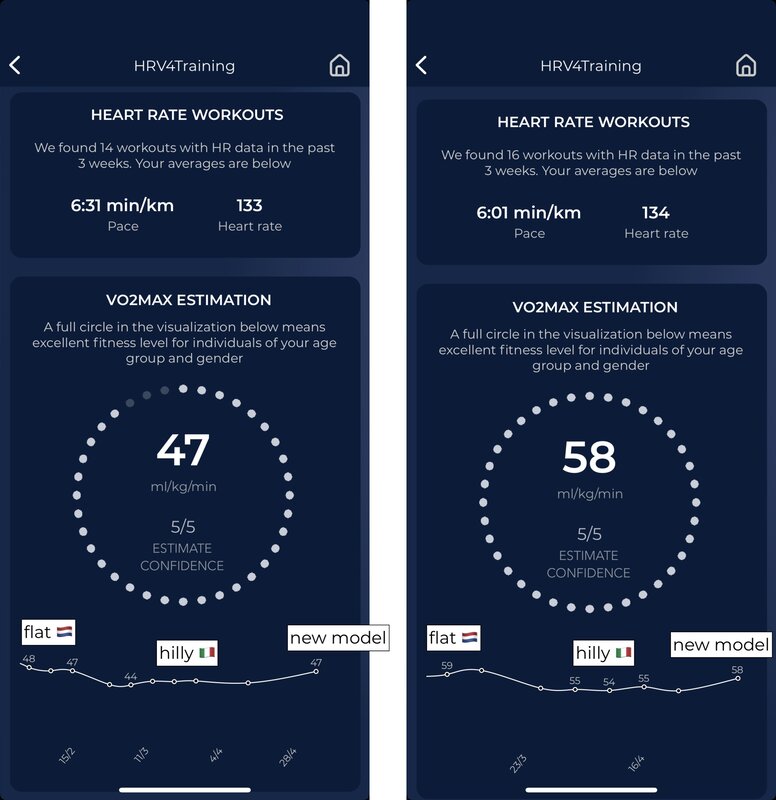 Enjoy!
|


Register to the mailing list
and try the HRV4Training app! 
|