THE ULTIMATE GUIDE TO HEART RATE VARIABILITY
We recently put together a series of posts that cover many aspects of HRV measurement, data interpretation as well as plenty of examples that you can look at to better understand how to make use of the data, and how HRV relates to training and lifestyle stressors.
Check them out at these links:
We recently put together a series of posts that cover many aspects of HRV measurement, data interpretation as well as plenty of examples that you can look at to better understand how to make use of the data, and how HRV relates to training and lifestyle stressors.
Check them out at these links:

|

|
HRV4Training Quickstart Guide
What's Heart Rate Variability (HRV)?
HRV is a term that refers to ways to summarize in a number the variability between heartbeats. Why is this variability between heartbeats important?
For a simple reason: HRV is the only practical, non-invasive and cost-effective way we have to measure the activity of the autonomic nervous system in response to stress
Our body is continuously re-adjusting to maintain a state of balance, called homeostasis. Our heart rate, blood pressure, glucose level, hormones, etc. — react to the challenges we face and the autonomic nervous system works to keep everything in balance so that we can function optimally (e.g. do not develop chronic conditions, or improve our performance)
Heart rhythm (and therefore HRV) is regulated by the parasympathetic branch of the autonomic nervous system, the one in charge of rest and relaxation. Hence, measuring HRV is an effective way to capture how our body is doing while trying to maintain a state of balance in response to different stressors (training, lifestyle, etc.).
In particular, a reduction in certain HRV features (for example rMSSD, more on this later) typically means that parasympathetic activity is reduced, and therefore we have not fully recovered or in general, there is more stress in our lives

What does the HRV number represent?
HRV is determined by computing so-called features, starting from a series of RR intervals, or differences between heartbeats. This means that on the contrary of heart rate, which can be thought of as an almost instantaneous value, HRV requires a certain amount of data to be accumulated, before it can be computed
In terms of features, the scientific community settled on rMSSD as the most meaningful and practical feature to use in applied research and real life
Why rMSSD? Because of how our physiology works. In particular, the vagus nerve (representative of the parasympathetic system) acts on receptors signaling nodes to modulate pulse very quickly, on a beat to beat basis. Thus, rMSSD captures parasympathetic activity
How is HRV computed in HRV4Training?
HRV4Training reports HRV as a transformation of rMSSD
In particular, this is the HRV number you see in the homescreen, and is computed as a logarithmic transformation of rMSSD as typically reported in the scientific literature
If you prefer to look at the actual rMSSD value in the app, you can do so by selecting rMSSD View under Menu / Settings. Note that the trends and day to day changes will be exactly the same, as the reported HRV is simply a more user friendly transformation of your rMSSD
Combining your HRV with subjective and training data, HRV4Training will be able to provide you with daily advice and interpret long term physiological trends, as explained below
How do I use the app?
We'll break down app usage in three steps:
- Measurement & Tags: Take an HRV test each day right after waking up. This value will contribute to your baseline and normal range. After each measurement you will be prompted with a short questionnaire that will help you to contextualize your measurements and to make sense of your data. Try to be consistent and follow the same monitoring routine every day
- Daily advice: Changes in HRV on consecutive days and with respect to your baseline and normal values will be analyzed to determine possible periods of higher physiological stress (reduce HRV). The daily advice can be used to understand under how much stress your body is, and make daily adjustments accordingly
- Insights: When you start accumulating weeks and months of data, advanced features will automatically unlock, providing you with much more insights on the relations between physiology, training and lifestyle stressors. Check out the sections below to find out more about HRV4Training's unique insights
1. Measurement & Tags
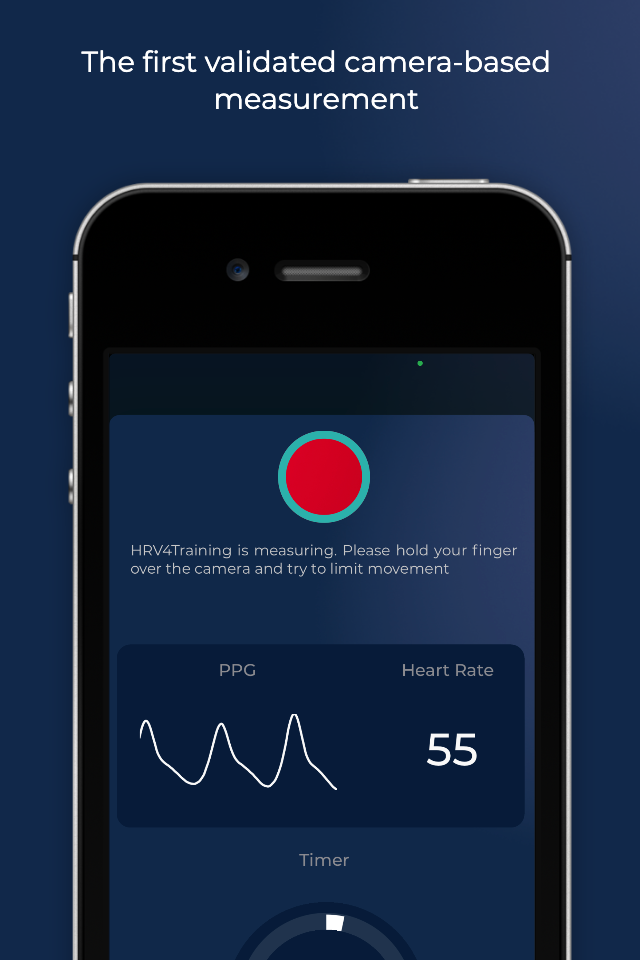
HRV4Training is the only independently validated camera-based HRV app. Below we provide some tips on using the camera for your measurement, as well as reliable alternatives with commercially available sensors.
|
1.1 Camera acquisition
Current generation phones include both a camera and a light emitting diode, which can be used for reflection based bio-optical imaging. The technique is called photoplethysmography (PPG for short) and consists in detecting changes in blood volume during a cardiac cycle, by illuminating the skin and measuring changes in light absorption. HRV4Training uses the phone camera to extract PPG and then determine markers of the autonomous nervous system activity PPG has been used for a long time in clinical settings, and has been validated multiple times, proving to be a reliable measurement of HRV, as good as standard electrocardiograms with sticky gel electrodes. Check out our validation at this link Here are some practical tips in case you are using the camera:
|
Please have a look at this list of best practices to make sure your measurements are high quality
HRV4Training can also integrate with other data sources, in particular:
You can learn more about the different sensing modalities, in our Ultimate Guide to Heart Rate Variability, part 1
Once you start measuring, it will take only 4 days to get a baseline, and then you'll see insights will start showing up from 2 to 6 weeks in, depending on measurements and workouts. The app will always use the past 2 months to understand normal variations in your physiology, and provide you with meaningful advice
HRV4Training can also integrate with other data sources, in particular:
- Bluetooth sensors: we have validated and recommend the following:
- Polar H7, H9 or H10
- Scosche rhythm24 armband
- Apple Watch: you can measure HRV using the Breathe app, which writes to Health. HRV4Training can then read from Health your data, as explained here
- Oura ring: we can read night data from Oura cloud so that you do not need to take the morning measurement. Learn more here
- Samsung Galaxy: we can use the dedicated sensor present in most Samsung Galaxy phones, instead of the camera. Learn more here
You can learn more about the different sensing modalities, in our Ultimate Guide to Heart Rate Variability, part 1
Once you start measuring, it will take only 4 days to get a baseline, and then you'll see insights will start showing up from 2 to 6 weeks in, depending on measurements and workouts. The app will always use the past 2 months to understand normal variations in your physiology, and provide you with meaningful advice
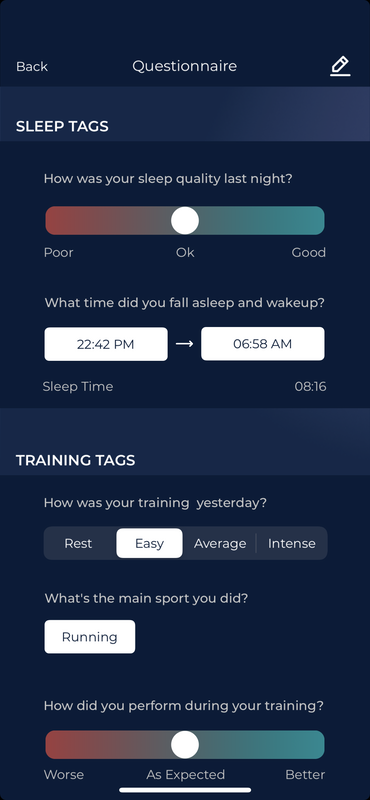
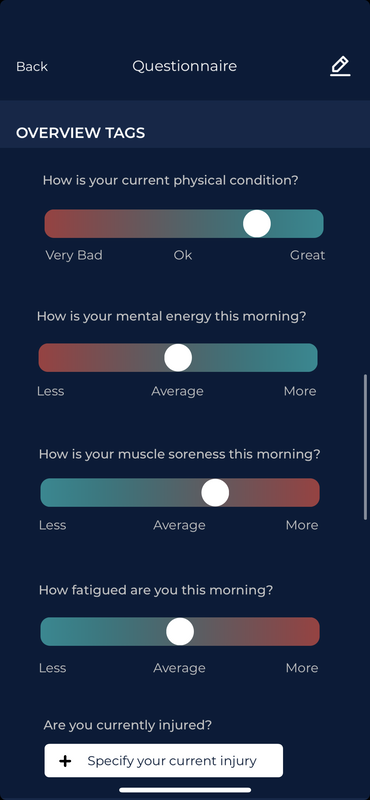
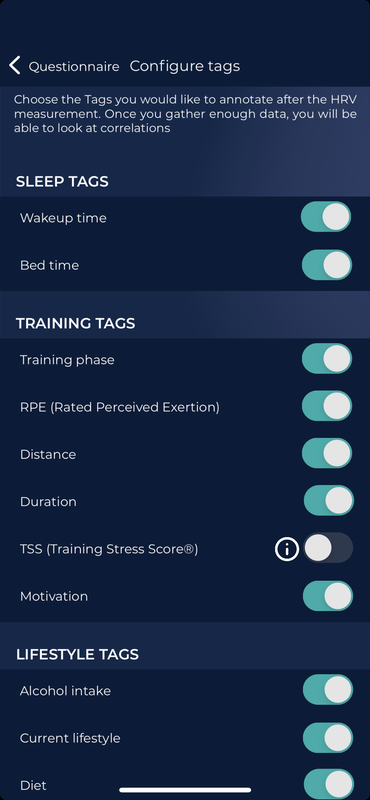
1.2 Tags
Context is key. After each measurement you'll be prompted with different Tags related to your current lifestyle and trainings. You can annotate not only training days and intensities but also a series of other parameter that can affect physiological stress, performance, and training. For example sleep quality, mental tiredness, muscle fatigue and more
Your annotated Tags will be used to provide more interesting analytics on the relation between your training and HRV. You'll also be able to see some of the tags in the history view and visualize custom correlations. Finally, you can add up to three custom tags
If you are a Strava or TrainingPeaks user, you can also link Strava and HRV4Training and get your training-related tags automatically in the app, as described here
|
|
|
2. Homepage and HRV-based Daily Advice
HRV4Training provides advice based on objective assessment of physical condition and your subjective scores. HRV over the last week is used to determine your baseline (at least 4 days of measurements are required), while the past 2 months of data are used to determine what your normal HRV range is
The daily advice aims at helping you in making small daily adjustments, by keeping in consideration how your score changed with respect to your normal values, and factoring in your subjective scores and recent trends (when enough data is present)
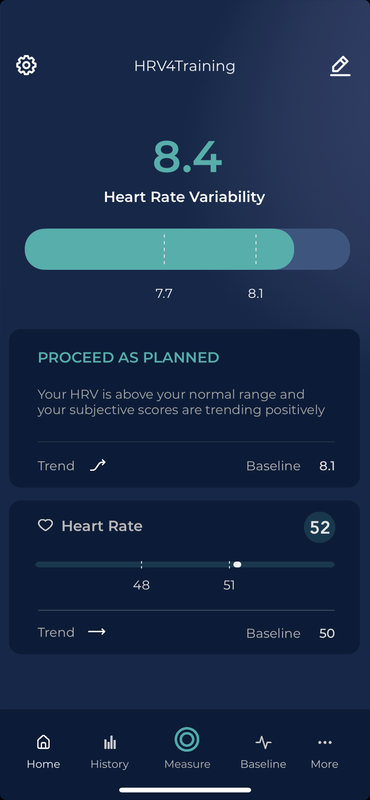
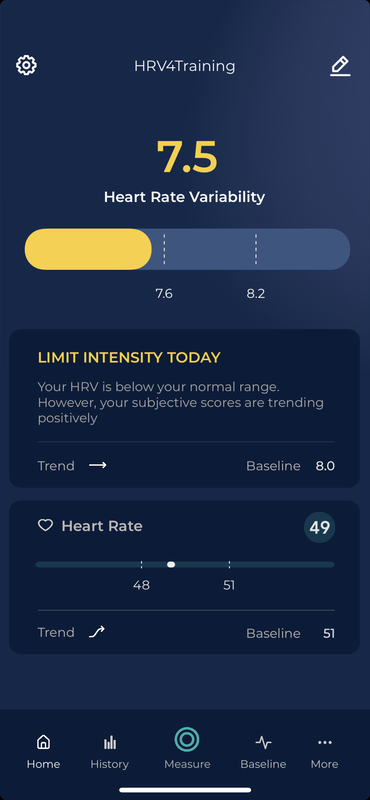
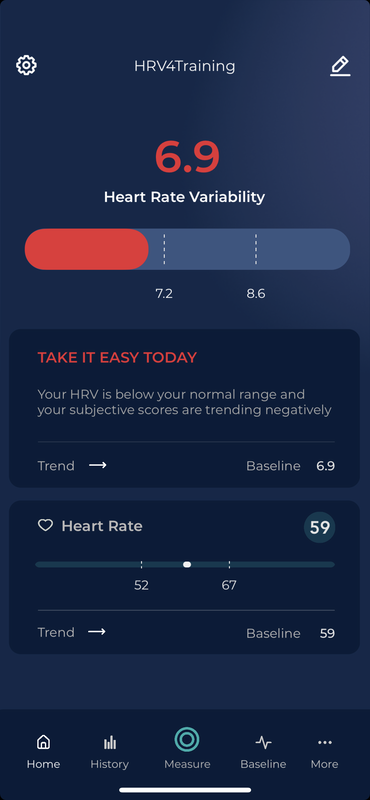
In particular, in the homepage you can find:
Check out this blog post for an overview of daily scores, advice, baseline and normal range.
HRV4Training provides advice based on objective assessment of physical condition and your subjective scores. HRV over the last week is used to determine your baseline (at least 4 days of measurements are required), while the past 2 months of data are used to determine what your normal HRV range is
The daily advice aims at helping you in making small daily adjustments, by keeping in consideration how your score changed with respect to your normal values, and factoring in your subjective scores and recent trends (when enough data is present)
In particular, in the homepage you can find:
- Today's HRV and heart rate, color coded by the daily advice. The message at the bottom of the page provides additional information on how the advice is computed
- Your weekly trend, shown visually (arrow) and numerically (baseline) for both HRV and heart rate
- Your normal range: this is where you should expect your daily score and baseline to be, provided no major stressors are affecting you. Remember, normal is good. Ideally, our HRV should be rather stable and within our range most of the time
Check out this blog post for an overview of daily scores, advice, baseline and normal range.
|
|
|
Integrating HRV in your training plan
How do you make adjustments based on HRV?
Let’s revise the basics: HRV, is simply a way to capture parasympathetic activity, or in other words, level of physiological stress. As we apply stress to trigger certain adaptations, measuring our body’s response to such stressors, as well as to all other forms of stress we are affected from (e.g. simply life happening, work stress, family, etc.), is very helpful as it can provide objective feedback and help us making meaningful adjustments
The simpler adjustments is probably just being a little more honest with ourselves, and slowing down from time to time, especially when our body is already too stressed. The example we’ve just highlighted is something we all understand quite well, higher stress as shown by lower HRV highlights how it might be a good idea to take it easy and avoid excessive stress which might lead to overtraining or slower recoveries, hindering improvements in performance
When everything is within your normal values or in other words a green light, should give you confidence that everything is going well and in general you are coping well with your current training and lifestyle. Yet, if your training plan says you are due for a rest day, take it. If you are due for a low intensity workout, do it. It is important to understand that HRV and physiological measurements are tools for awareness, which allow you to understand how you respond to a particular plan, not to replace your plan entirely
You can learn more about medium and long term trends, at this link
|
|
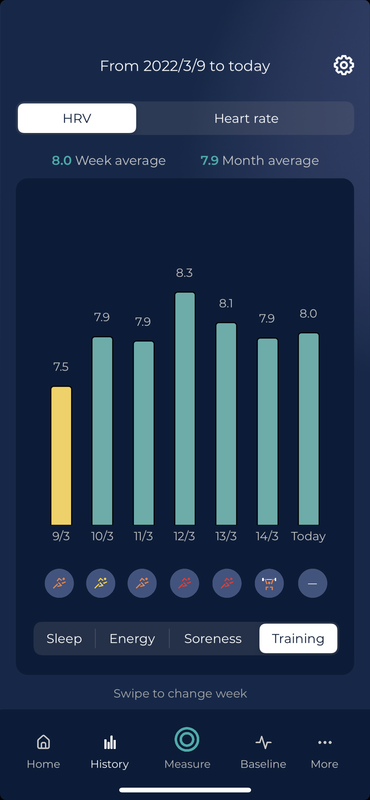
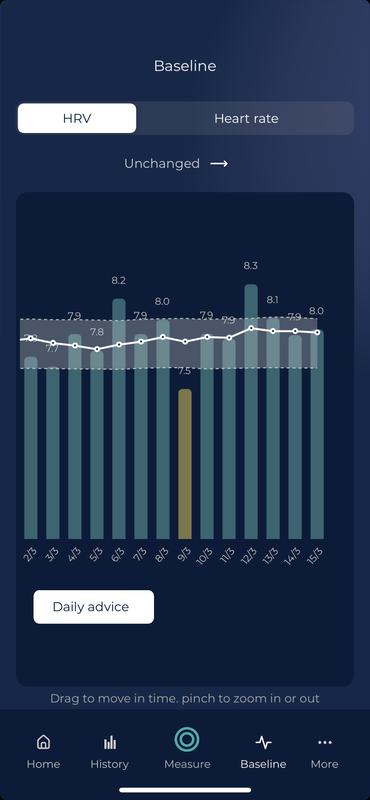
2.1 History, Baseline and Training Annotations
Once you've collected a few days of measurements, use the history tab to browse through it and look at the different features that were extracted during the test. You'll also be able to see the impact of some of your tags (e.g. travel, alcohol intake, injuries, etc.) on your physiological stress level The Baseline page helps you in going beyond short daily variability, and get a better overview of your physical condition in the past few weeks. In particular, the line is a 7 days moving average, which captures the global trend of your HRV, without being too affected by daily swings HRV4Training automatically computes your recent trend by analyzing changes in heart rate and HRV in the past 2 weeks. |
|
|
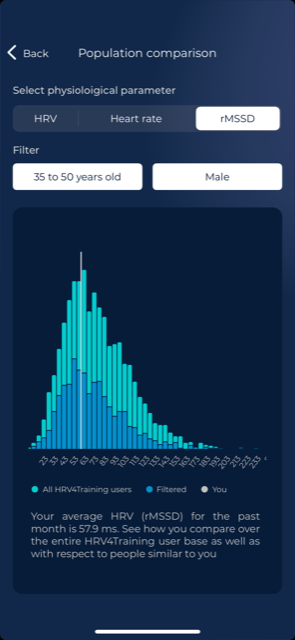
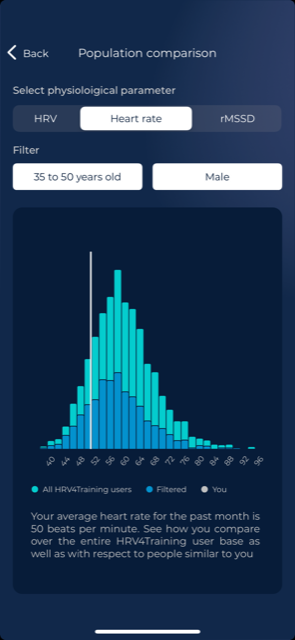
2.3 Population comparisons
In this page you can see how you compare with respect to other HRV4Training users. You'll be able to pick different physiological parameters (heart rate, rMSSD, HRV) as well as stratify by age and gender You can learn more about HR and HRV population values on this blog post In the context of HRV analysis, we always stress the importance of looking at your own relative changes over time. Our baseline HRV is probably affected by some factors that we cannot easily measure (genetics, for example, as reported once again recently), other factors that change but we have no control on (e.g. age), and factors we can probably influence (lifestyle) Hence, we highly recommend to focus only on relative changes, which is the most powerful way to make sense of your data |
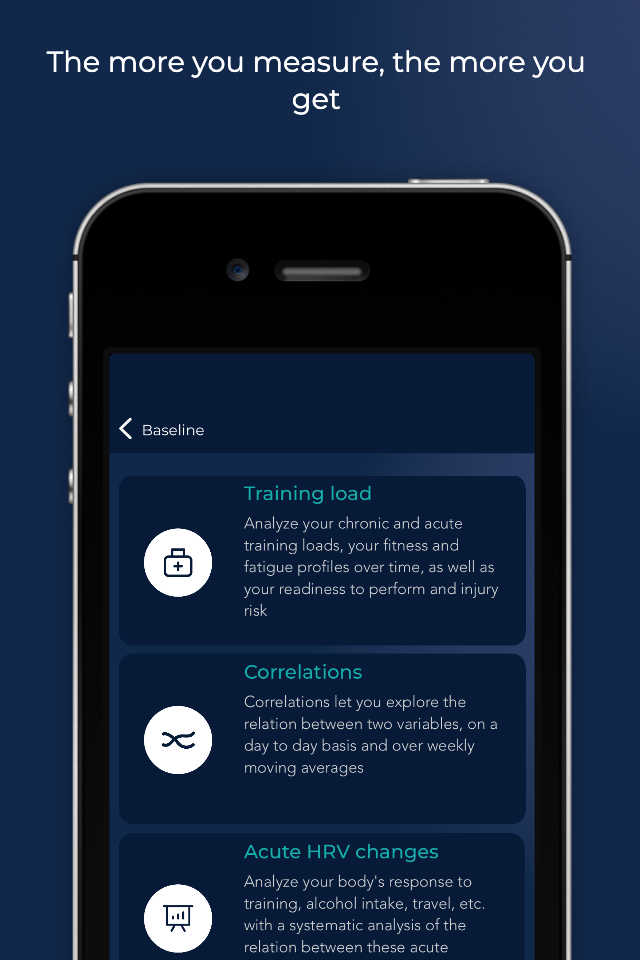
3. HRV4Training Insights
HRV4Training provides more advanced experimental analysis that look at both acute HRV changes and long term trends to better understand the big picture. In particular, under Menu - Insights, you can find:
|
|
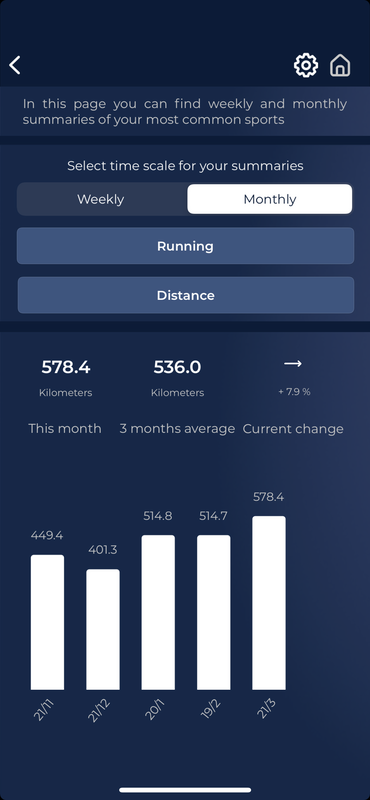
3.1 Weekly and Monthly summaries
Pick the metric most representative of your athlete's trainings (e.g. RPE, TSS, Suffer Score, training distance) and analyze training load breakdowns by week and month to keep better track of overall progress
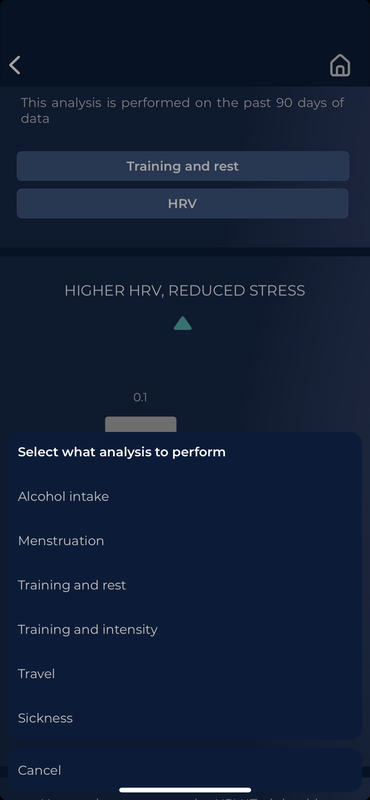
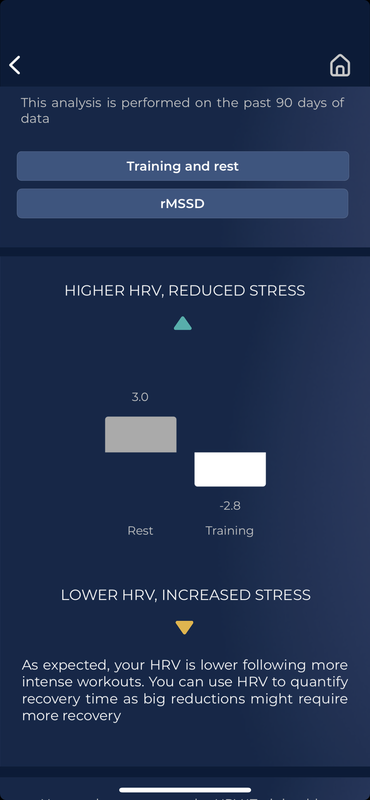
3.2 Acute HRV Changes in response to training, travel, alcohol intake, menstruation & getting sick
Acute stressors are events that affect your physiology in the immediate future. Think about an intense aerobic workout, an intercontinental flight, a night out with too many drinks, high caffeine intake, etc. Acute stressors are typically the easiest phenomena to interpret and reproduce, and looking at data in the context of acute stressors can help understanding how your physiology works. Looking at acute changes can also help in gaining confidence in the tools we use, as these changes should be captured more easily
In the Acute HRV Changes analysis you will be able to look at acute changes in two different ways. For certain stressors, which have an impact on the following day physiology (e.g. alcohol intake or a workout), we will show you the difference in HRV between "today" (stressor day) and "tomorrow" (day after the stressor), averaged over three months of data. Did your HRV decrease after a certain event? By how much? Is this decrease consistent? That's what you will be able to see for training (rest vs training as well as different annotated intensities) and alcohol intake. On the other hand, some stressors last for several days (for example getting sick, menstruation and travel). For these stressors we will not look at day to day changes but at the average HR or HRV values in the two conditions. What's your normal HR? Does it change when sick? See some additional screenshots above
|
|
|
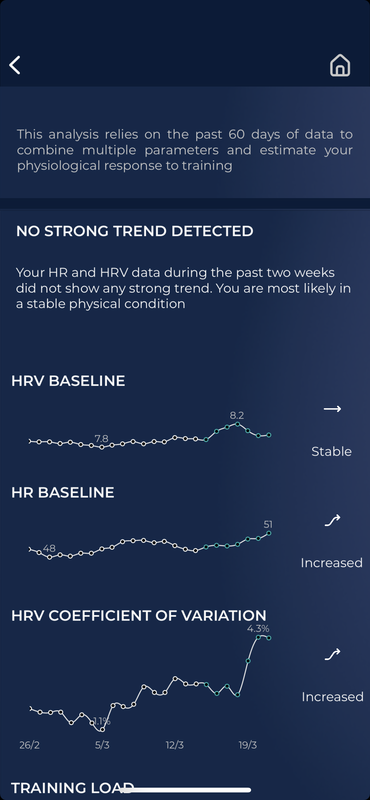
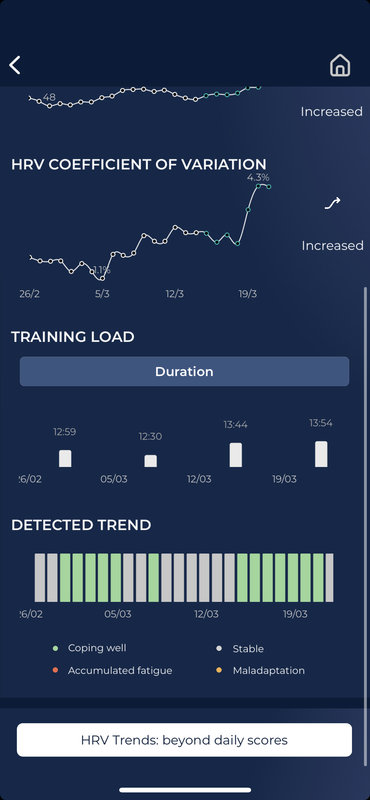
3.3 HRV Trends analysis
HRV4Training is also the first app that combines multi-parameter data to help you better understand the big picture. Looking at baseline changes in HRV, heart rate and the coefficient of variation of HRV, the app can automatically determine if your recent trends are changing in a trivial way, or if the change is something to take more seriously, based on your historical data
Once the various trends have been analyzed, HRV4Training will determine your physiological response to training as one of the following categories:
You can read more in this blog post and learn more about the Coefficient of Variation, here
Once the various trends have been analyzed, HRV4Training will determine your physiological response to training as one of the following categories:
- Stable physical condition
- Coping well with training
- Maladaptation to the current stimulus
- Accumulated fatigue
You can read more in this blog post and learn more about the Coefficient of Variation, here
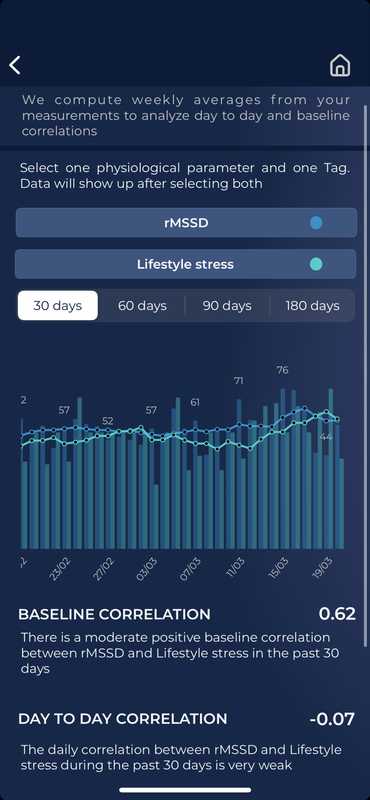
3.4 Correlations
You can explore the correlation between your annotations and physiological parameters (e.g. HR/HRV), under Insights - Correlations. Mainly for exploratory analysis inside the app. Look at what factors are related to physiological changes, and try to adjust your lifestyle accordingly (a good one is typically sleep quality)
Read more about this feature here
Read more about this feature here
|
|
|
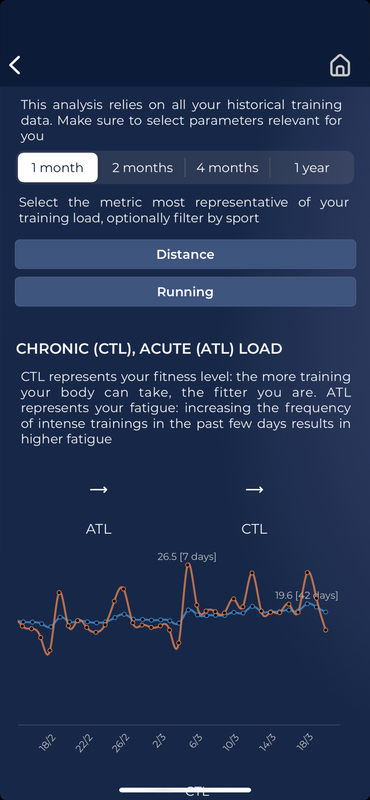
3.5 Training load analysis
HRV4Training lets you pick the metric most representative of your trainings (e.g. TSS, Suffer Score, training distance or your own custom metric) and analyze fitness & fatigue, determined as chronic and acute training loads, as well as readiness to perform and injury risk. You can find out more about this feature at this link
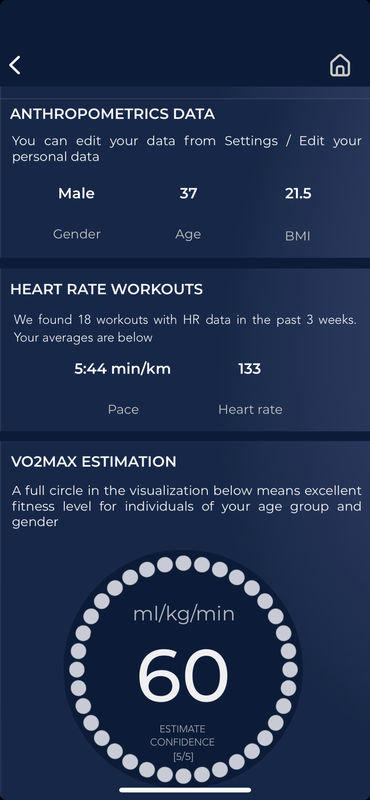
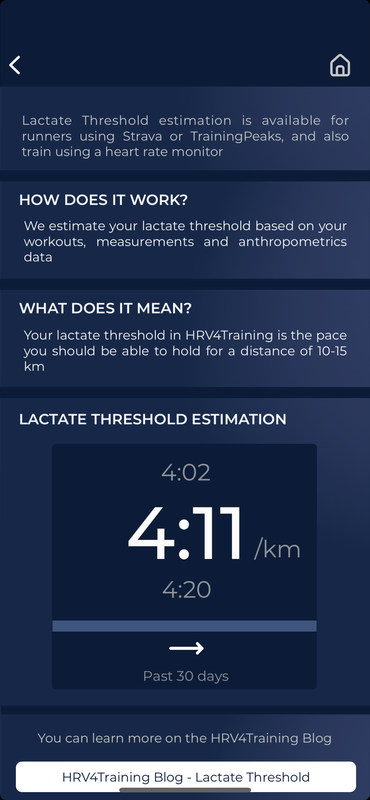
3.6 Lactate threshold and VO2max estimation
For runners and cyclists using the Strava integration and training with a HR monitor (and power), HRV4Training can estimate lactate threshold and cardiorespiratory fitness level (VO2max)
Check out this post for more details on VO2max and this post for an overview of the science behind our lactate threshold estimate and how you can use it
Check out this post for more details on VO2max and this post for an overview of the science behind our lactate threshold estimate and how you can use it
|
|
|
3.7 Training polarization analysis
This analysis allows you to get an overview of how hard you are training and potentially polarize more your training, as a more polarized approach, typically involving training about 80% of the time at very low intensities, has been shown to improve performance for both recreational and elite athletes. More details on this analysis at this link
4. Integration with other services
Once you authorize the app, HRV4Training can share data with the following apps and services:
- Strava: HRV4Training can read your workouts summaries, show them in your History page and fill in automatically some of the training-related tags for you, as explained here. Additionally, HRV4Training can estimate your VO2max based on strava running data
- TrainingPeaks: HRV4Training can send HR and HRV data to TrainingPeaks, as explained here. You can also configure the app to send all sort of additional parameters, from notes to sleep, muscle soreness, and more
- Apple Watch: you can measure HRV using the Breathe app, which writes to Health. HRV4Training can then read from Health your data, as explained here
- Oura ring: we can read night data from Oura cloud so that you do not need to take the morning measurement. Learn more here.
- SportTracks: HRV4Training can send HR and HRV data to SportTracks, as explained here
- Genetrainer: HRV4Training can send HR and HRV data to Genetrainer. Learn more about this integration here
- Health: HRV4Training can send HR and sleep data to the Health app as well as read sleep data from the Health app, in case you use another sleep tracker
- Today's Plan: HRV4Training can send HR and HRV data to Today's Plan. Learn more about this integration here
- Final Surge: HRV4Training can send HR and HRV data to Final Surge. Learn more about this integration here
- TrainAsOne: HRV4Training can send HR and HRV data to TrainAsOne. Learn more about this integration here