|
In the latest update of HRV4Training Pro, we have added your subjective score to the list of parameters you can pick in the Correlation analysis. You can try the new feature on HRV4Training Pro for free at this link, or use code SCIENCE for 20% off any package. 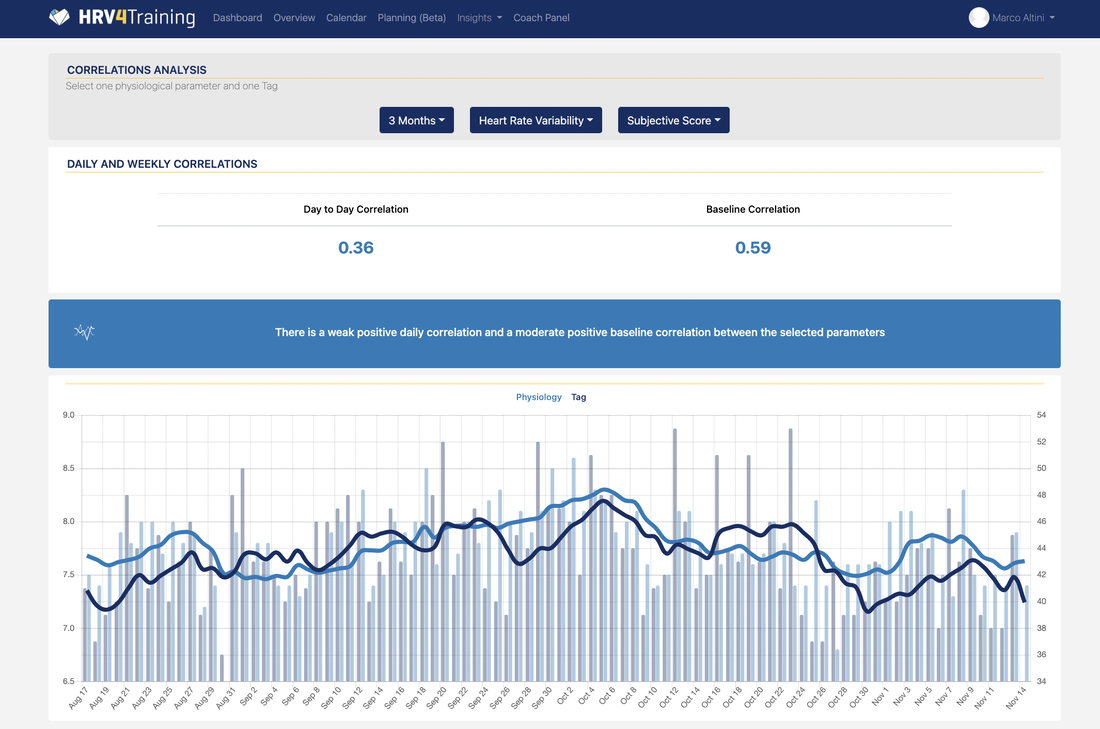 What's the subjective score and how is it used in HRV4Training?The subjective score in HRV4Training aims at capturing how you feel in response to training, and combines: perceived sleep quality, muscle soreness, motivation to train, perceived performance during training. In the app, when providing daily advice (color-coding and message) in HRV4Training we combine your physiology and your subjective feel (outputs) . However, we do not use or include your behavior, for example your activity / training (input). This is a key difference from what you get in terms of readiness or recovery scores in most wearables. Why is that? The whole point of assessing your state, either objectively via heart rate variability (HRV) or subjectively by feel, is to determine how you responded to your given circumstances. You already know the input (behavior) and are assessing the output (physiology or feel). In other words, if I train hard or more for a few days, I want to assess how I responded (output). Including activity (input) in my assessment would mean penalizing me regardless of my body's response. For athletes (of any level), this method is particularly ineffective: it hides information. If you train, there is no point looking at readiness or recovery scores to assess how you are responding to a given training stimulus as these scores confound your response with your behavior. Is the score low because I responded poorly, or just because I did more? The subjective score in HRV4Training is not impacted by these limitations, as it relfects your subjective input. When combined with your physiological response (heart rate, HRV), it can give you a more comprehensive picture of your response, and help you make meaningful adjustments to your plans. What are correlations about?Citing Wikipedia: "Correlation refers to any of a broad class of statistical relationships involving dependence. Familiar examples of dependent phenomena include the correlation between the physical statures of parents and their offspring, and the correlation between the demand for a product and its price. Correlations are useful because they can indicate a predictive relationship that can be exploited in practice." In other words, looking at correlations can help us to pinpoint which parameters have a stronger impact on our physiology, and potentially make adjustments (e.g. if there is a strong negative correlation between work stress and HRV, maybe we should try to reduce work stress). How should I configure this analysis?The correlation analysis in HRV4Training Pro lets you pick any timeframe between 30 days and 2 years. However, in general, we think that using a time frame between 60 and 90 days is ideal. Why is that? Most likely the stressors you face will change over time, and similarly your response to certain stressors will change, therefore we believe it can be more helpful to look at these relationships in the relatively short time frame (e.g. 60-90 days), to get a better idea of what factors are influencing your physiology the most. Shorter windows (e.g. 30 days) might not have enough data, unless some really large stressor was present (for example if you go from sea level to 2000m / 6000ft of altitude, then you will certainly see a strong correlation between resting heart rate and altitude), otherwise it might be better to extend the window. On the other hand, longer windows (e.g. a whole year) might fail to capture more complex, multidimensional relationships between various training and lifestyle aspects, and your physiology. Finally, we would recommend to look at baseline correlations, more than day-to-day correlations. Baseline correlations are computed on the 7 days moving average of each variable, and therefore provide a more stable trend of the data. Typically, this is more insightful than to look at the individual data points, especially in the longer term. Below you can seen an example:
 The important part after you start looking at these correlations, is not to jump to conclusions too quickly. For example, it could be that the relation you are seeing is actually caused by another variable excluded by the analysis. However, this can be a useful starting point to explore your data, and we hope the new color-coding will make it a bit easier.
Enjoy Comments are closed.
|


Register to the mailing list
and try the HRV4Training app! 
|