|
Blog post by Marco Altini To make sense of changes in physiology (in particular, HRV and heart rate), we need to interpret them with respect to what we call your "normal range". In the scientific literature, this is called the smallest worthwhile change (or SWC). In this short blog, I will cover our reasoning when it comes to how much data we should include to determine your normal range: a key aspect that will determine how changes in HRV are interpreted to provide you with useful advice. If you are new to the concept of the normal range or SWC, please check out this blog post first. How much data should we include?In the context of analyzing relative changes over time, for example to identify periods of higher stress, there are two important trade-offs to consider when it comes to resting heart rate and HRV:
In the scientific literature, for practical reasons, often one month is used to determine the normal range. However, we need to realize that scientific studies typically face obvious constraints (e.g. time and budget) and as such, might be trying to shorten the time required to capture an individual's normal range. I would like to argue that this is too short and ineffective to capture longer-term decouplings between baseline (weekly average) and your normal range. Let's look at an example: 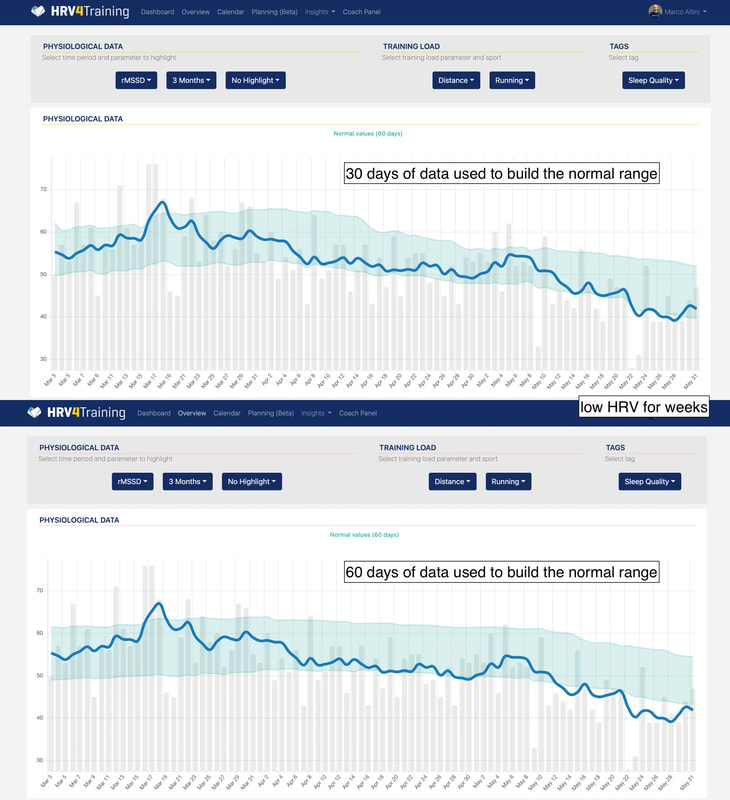 In the data above, towards the end of the 3 months, we can see a few bad weeks where HRV is quite suppressed. Let's look at the first graph first. If we were to build the normal range using only a month of data, the normal range would change too quickly: it would always include the baseline (blue line) despite a very large change in daily scores. In other words, if we use short windows, we are almost always within normal range. Now moving to the second graph. When using 60 days of data to build the normal range, we can see how the normal range decouples more effectively from the baseline and daily values. In this case, we can clearly see that we are in a negative phase of suppressed daily and baseline HRV, with respect to our normal range. In HRV4Training we use 60 days of data for these reasons. Obviously, there are always trade-offs to make and no choice is perfect, but in our experience, 2 months is an ideal time frame when looking at HRV data: you are not too reactive and can capture acute drops, you don't get stuck in very old data and seasonal changes. You can try Pro for free by logging in here. Once you are logged in, the Baseline page in the app will also show your normal range, as shown below. Use code SCIENCE for 15% off. Enjoy 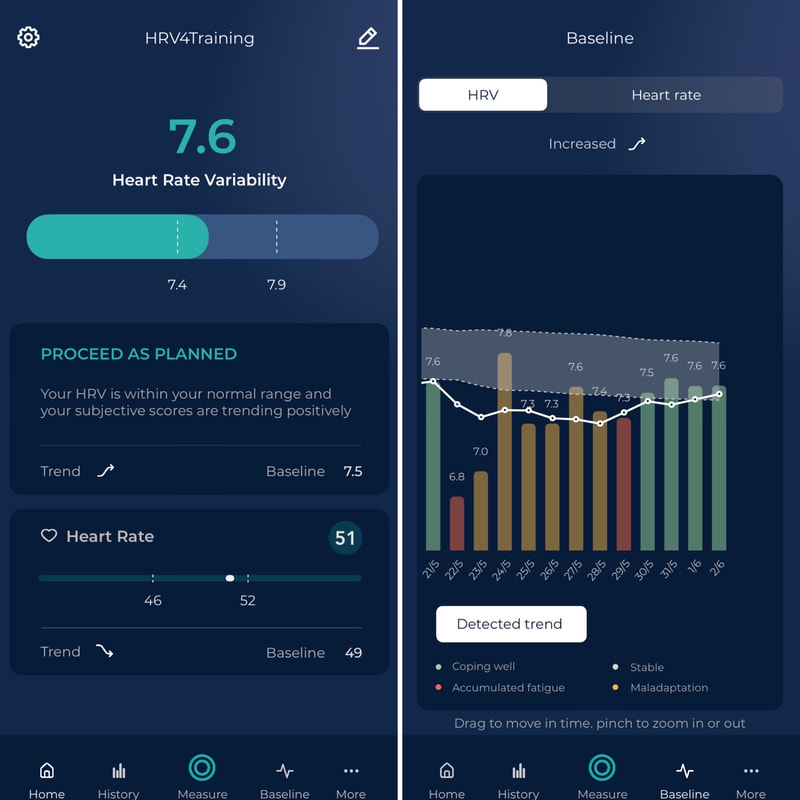 Comments are closed.
|


Register to the mailing list
and try the HRV4Training app! 
|