HRV4Training Quickstart Guide
What's HRV?
Practically speaking, our heart does not beat at a constant frequency. So even if we measure our pulse, and get a 60 beats per minute reading, it doesn’t mean we have a beat every second. The time differences between beats are slightly different, they can be 0.9 seconds, 1.2 seconds, and so on. When we talk about HRV, we talk about ways to quantify this variation between heart beats.
This explains also why HRV is not a single number, and there is sometimes a bit of confusion on different metrics to measure HRV since we can quantify these beat to beat differences in different ways (called features). Especially in the context of using HRV to monitor physiological stress, like training load and recovery, the community settled on one specific feature which is called rMSSD. It’s a time domain feature, easy to compute. So HRV4Training provides you with a transformation of rMSSD to make the value a bit easier to interpret, i.e. the Recovery Points. If you are an advanced user, you can also display actual features by selecting HRV View - Advanced from Settings.
This explains also why HRV is not a single number, and there is sometimes a bit of confusion on different metrics to measure HRV since we can quantify these beat to beat differences in different ways (called features). Especially in the context of using HRV to monitor physiological stress, like training load and recovery, the community settled on one specific feature which is called rMSSD. It’s a time domain feature, easy to compute. So HRV4Training provides you with a transformation of rMSSD to make the value a bit easier to interpret, i.e. the Recovery Points. If you are an advanced user, you can also display actual features by selecting HRV View - Advanced from Settings.
What does HRV represent?
Here we need to take a step back and talk a bit about the autonomic nervous system. The autonomic nervous system regulates many body functions, mainly unconsciously, such as respiration, the heart beating and so on, and consists of two branches, the sympathetic and parasympathetic branches.
The sympathetic branch, is in charge of the fight or flight response, while the parasympathetic branch promotes a rest and recovery. Making a few simplifications, since the autonomic nervous system maintains an adaptive state of balance in our body, we can understand how we react to stressors, by analyzing autonomic function.
This means we would expect higher parasympathetic activity under conditions of rest, when we are well recovered. Since the autonomic system regulates the heart beating, we can use HRV as a proxy to autonomic function, and therefore use HRV as a way to measure how we react to stressors like a workout for example. This is where collecting HRV data can become very interesting, because we can, for example, better understand how much time our body needs to get back to normal after an intense workout.
How do I use the app?
We'll break down app usage in three steps:
- Measurement & Tags: Take an HRV test each day right after waking up. This value will contribute to your baseline. After each measurement you will be prompted with a short questionnaire that will help contextualize your measurements and make sense of your data. Try to be consistent and follow the same monitoring routine. If you do get out of bed before taking your test, make sure you are again well rested (e.g. relax for a few minutes). Check out this short deck on best practices for short measurements.
- Daily advice: Changes in HRV on consecutive days and with respect to your baseline will be analyzed to determine possible periods of higher physiological stress. The daily advice can be used to understand under how much stress your body is, and make daily adjustments to your trainings accordingly.
- Insights: When you start accumulating weeks and months of data, advanced features will automatically unlock, providing you with much more insights on the relations between training intensity, recovery and performance. Make sure to fill in your tags after each measurement, and all the information will be processed to provide more accurate assessment of physical condition. Check out the sections below to find out more about HRV4Training's unique insights.
1. Measurement & Tags
|
|
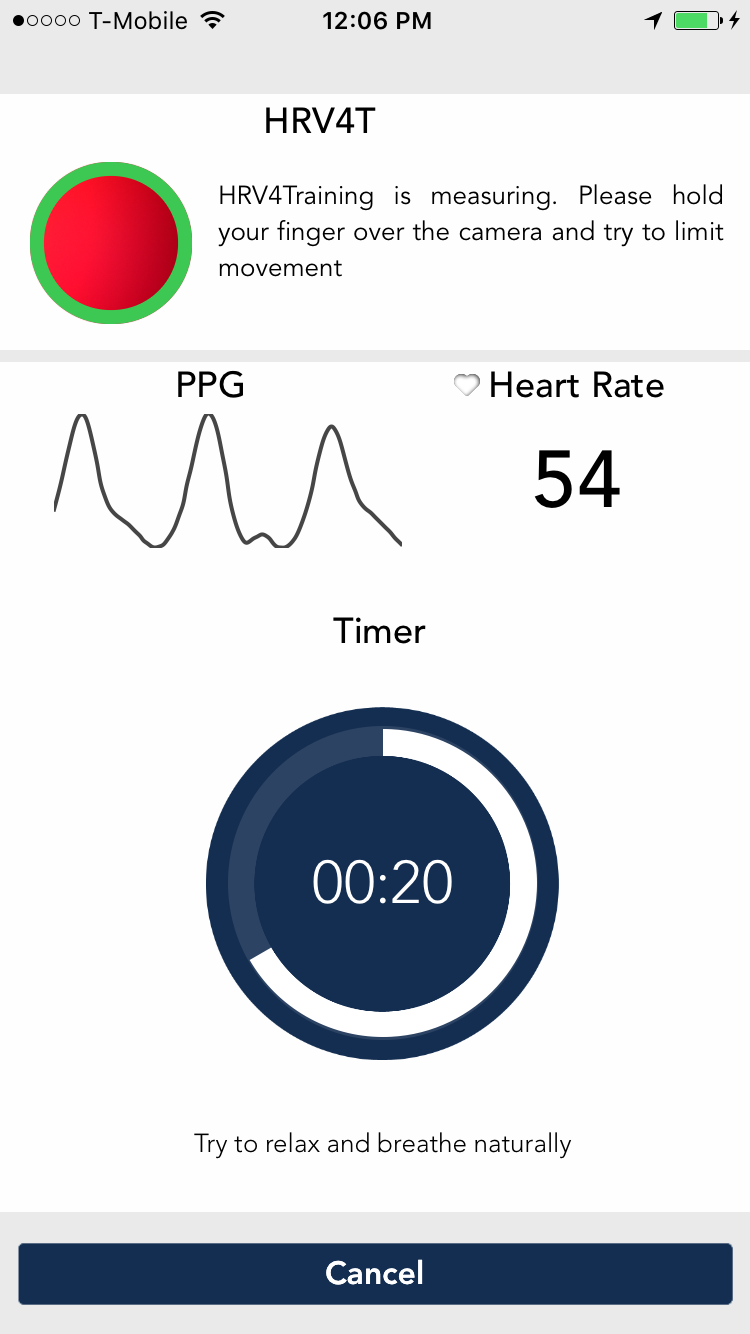
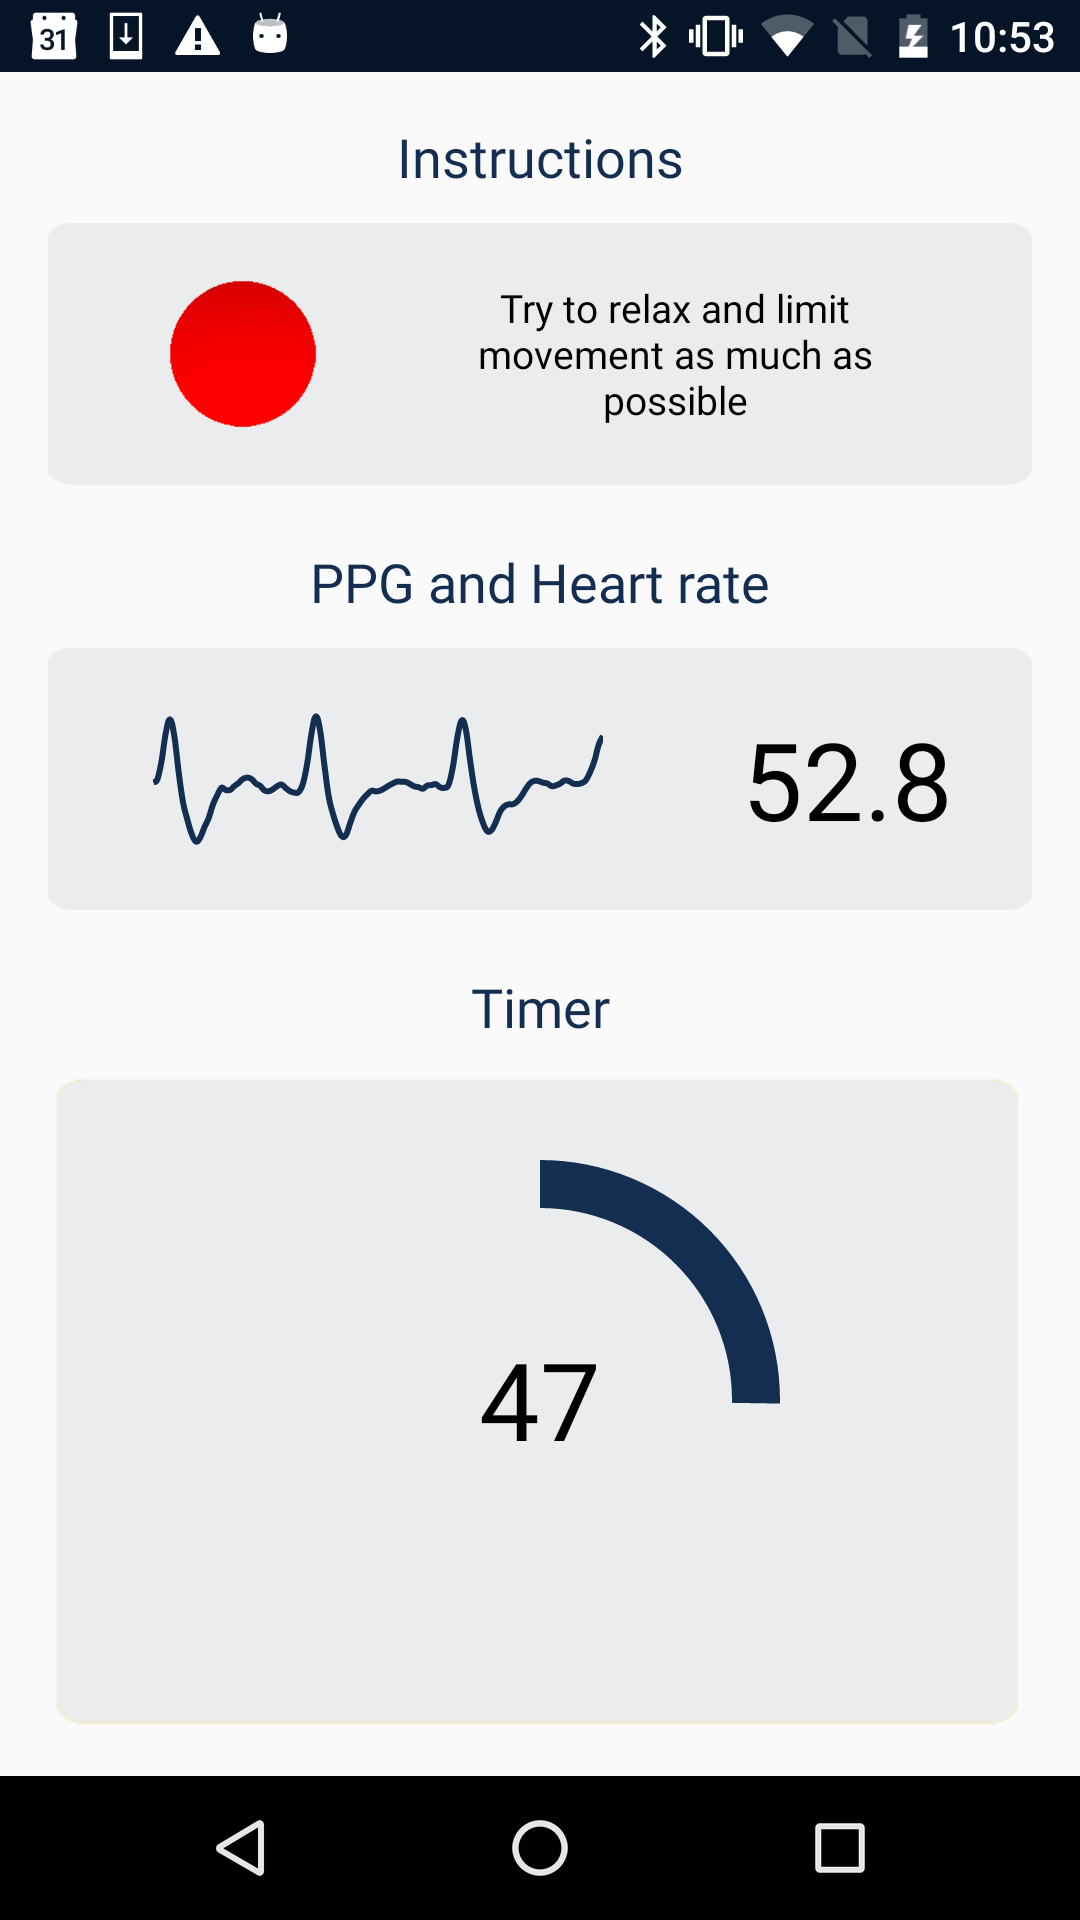
1.1 Camera acquisition
Current generation phones include both a camera and a light emitting diode, which can be used for reflection based bio-optical imaging. The technique is called photoplethysmography (PPG for short) and consists in detecting changes in blood volume during a cardiac cycle, by illuminating the skin and measuring changes in light absorption. HRV4Training uses the phone camera to extract PPG and then determine markers of the autonomous nervous system activity, in particular parasympathetic activity. PPG has been used for a long time in clinical settings, and has been validated multiple times, proving to be a reliable measurement of HRV, as good as standard electrocardiograms with sticky gel electrodes. Check out our validation at this link. |
Here are some practical tips in case you are using the camera:
Note that if you prefer to use a chest strap, HRV4Training supports most bluetooth low energy heart rate monitors. In this case, we recommend a Polar H7.
- Use your fingertip for the measurement
- Place your fingertip exactly on the camera, you need to cover it all
- Do touch the camera, but limit pressure. It's important to touch it gently, otherwise too much pressure will impede blood flow (which is what needs to be measured)
- Try not to move for the duration of the whole test, and breathe freely, without forcing any unnatural breathing pattern
Note that if you prefer to use a chest strap, HRV4Training supports most bluetooth low energy heart rate monitors. In this case, we recommend a Polar H7.
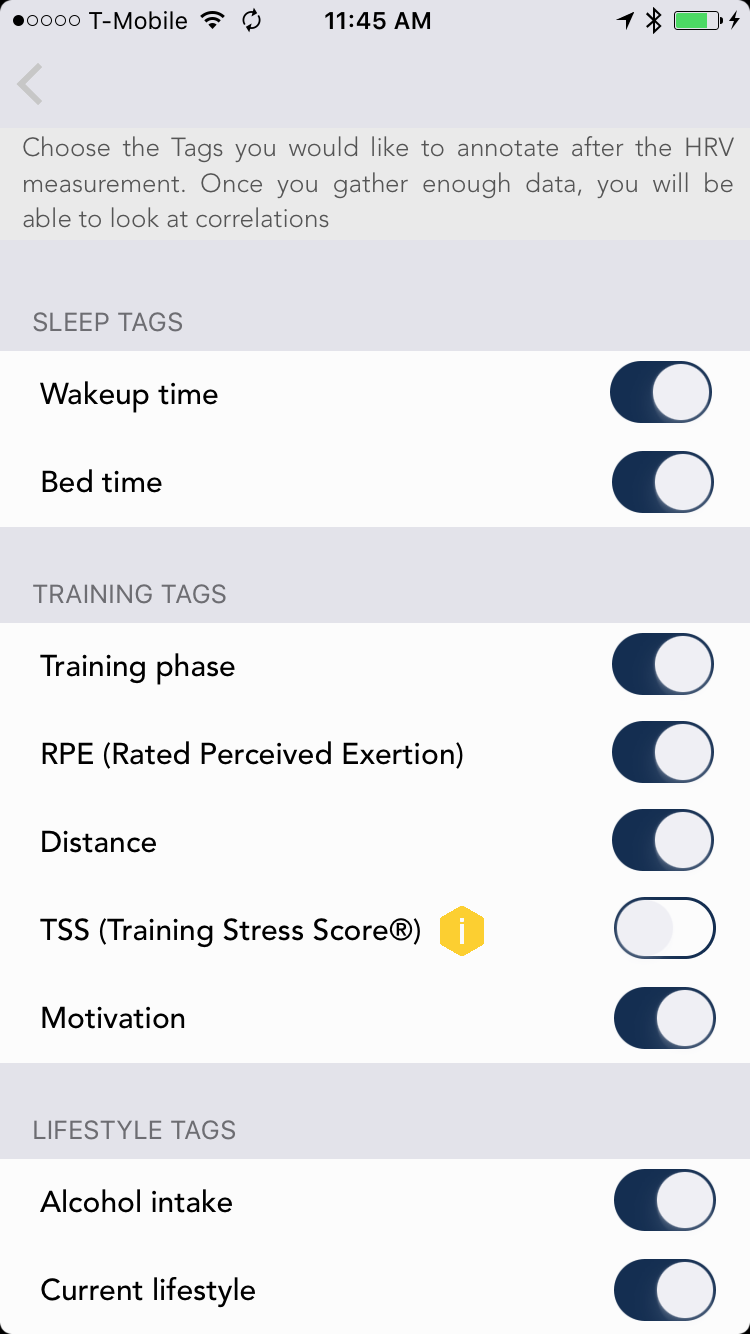
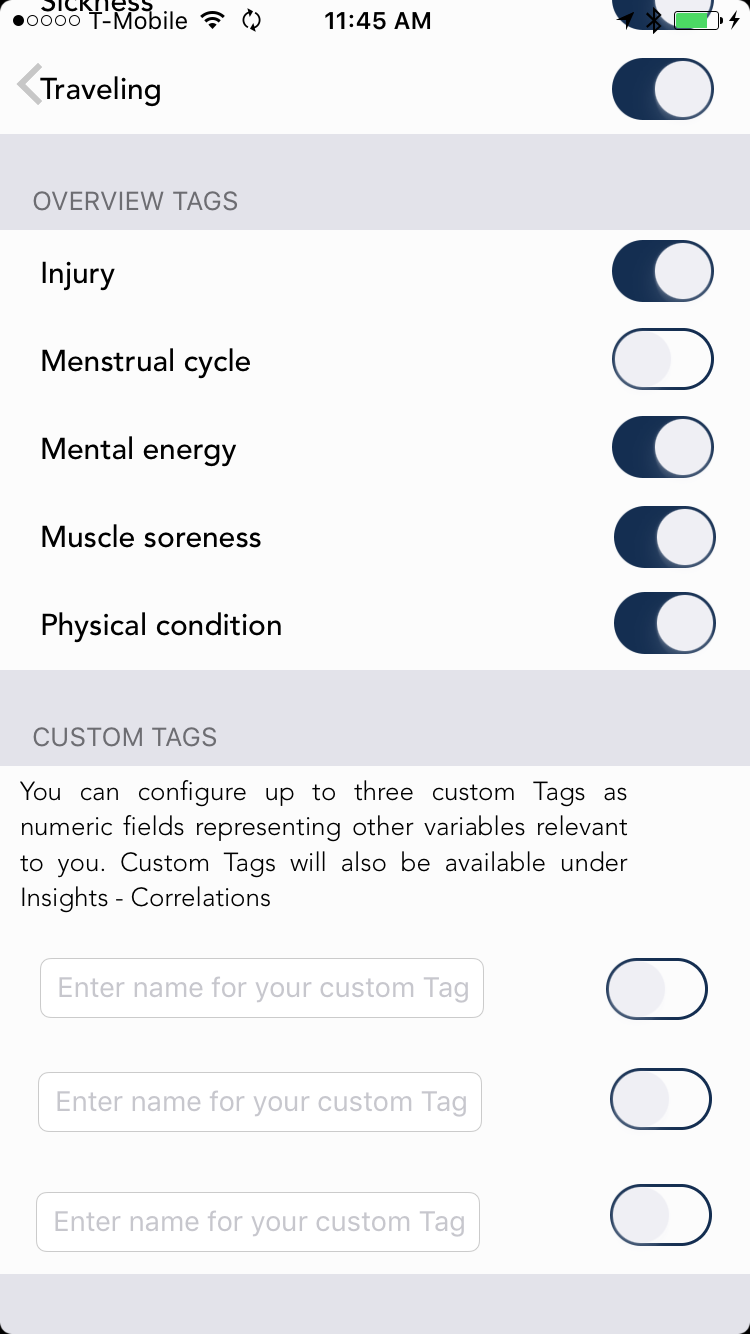
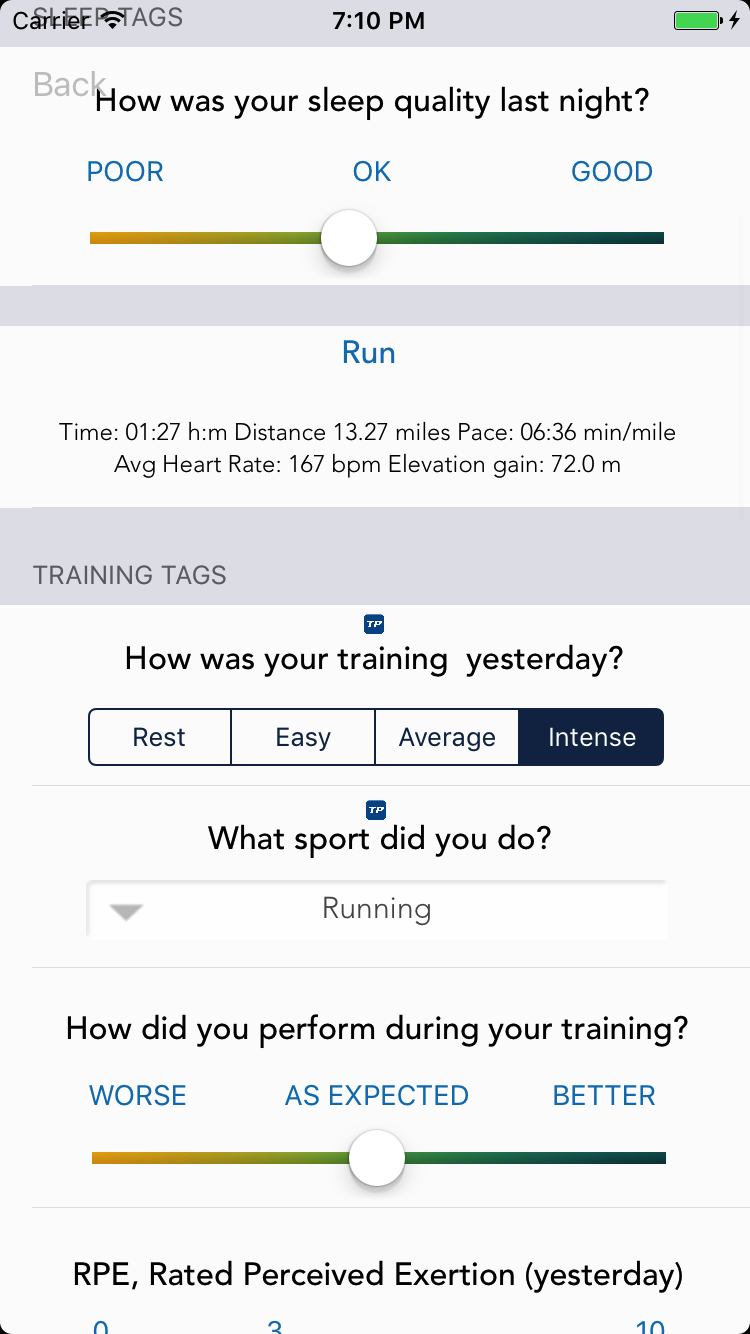
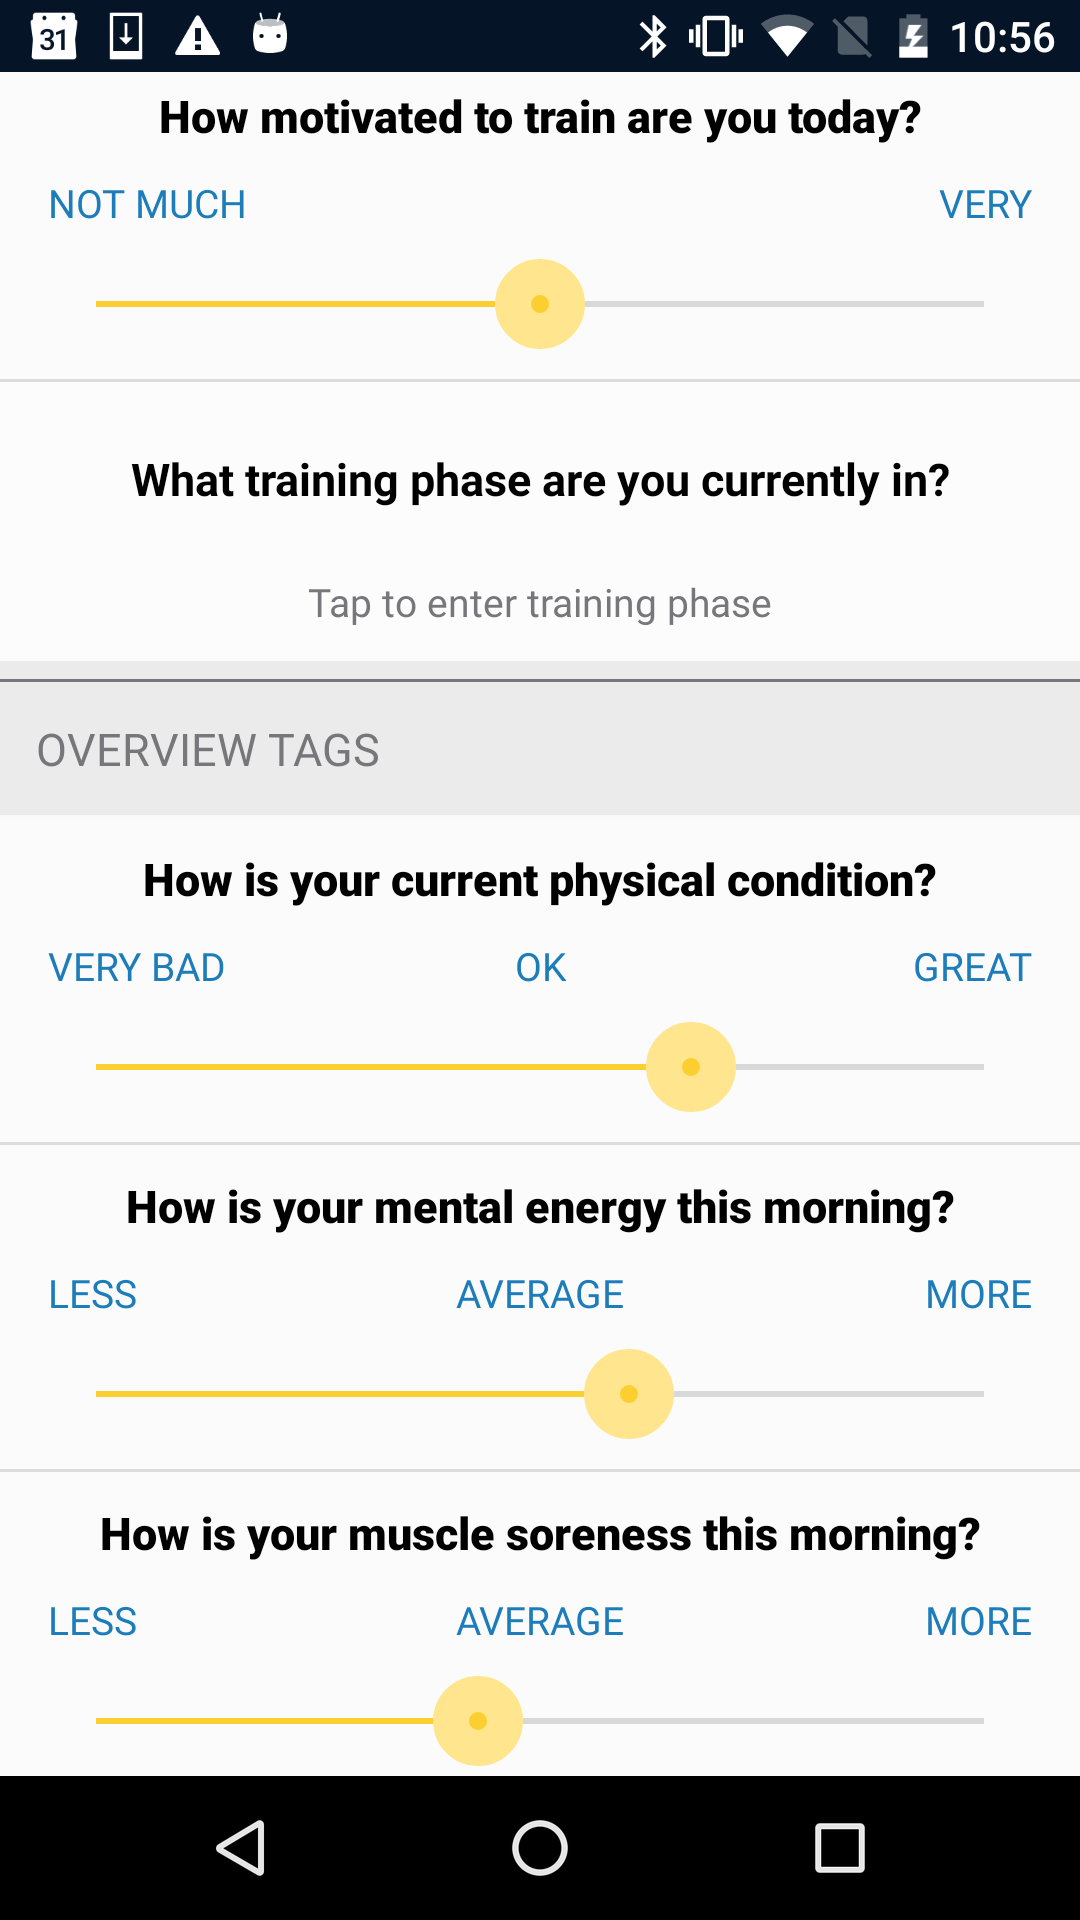
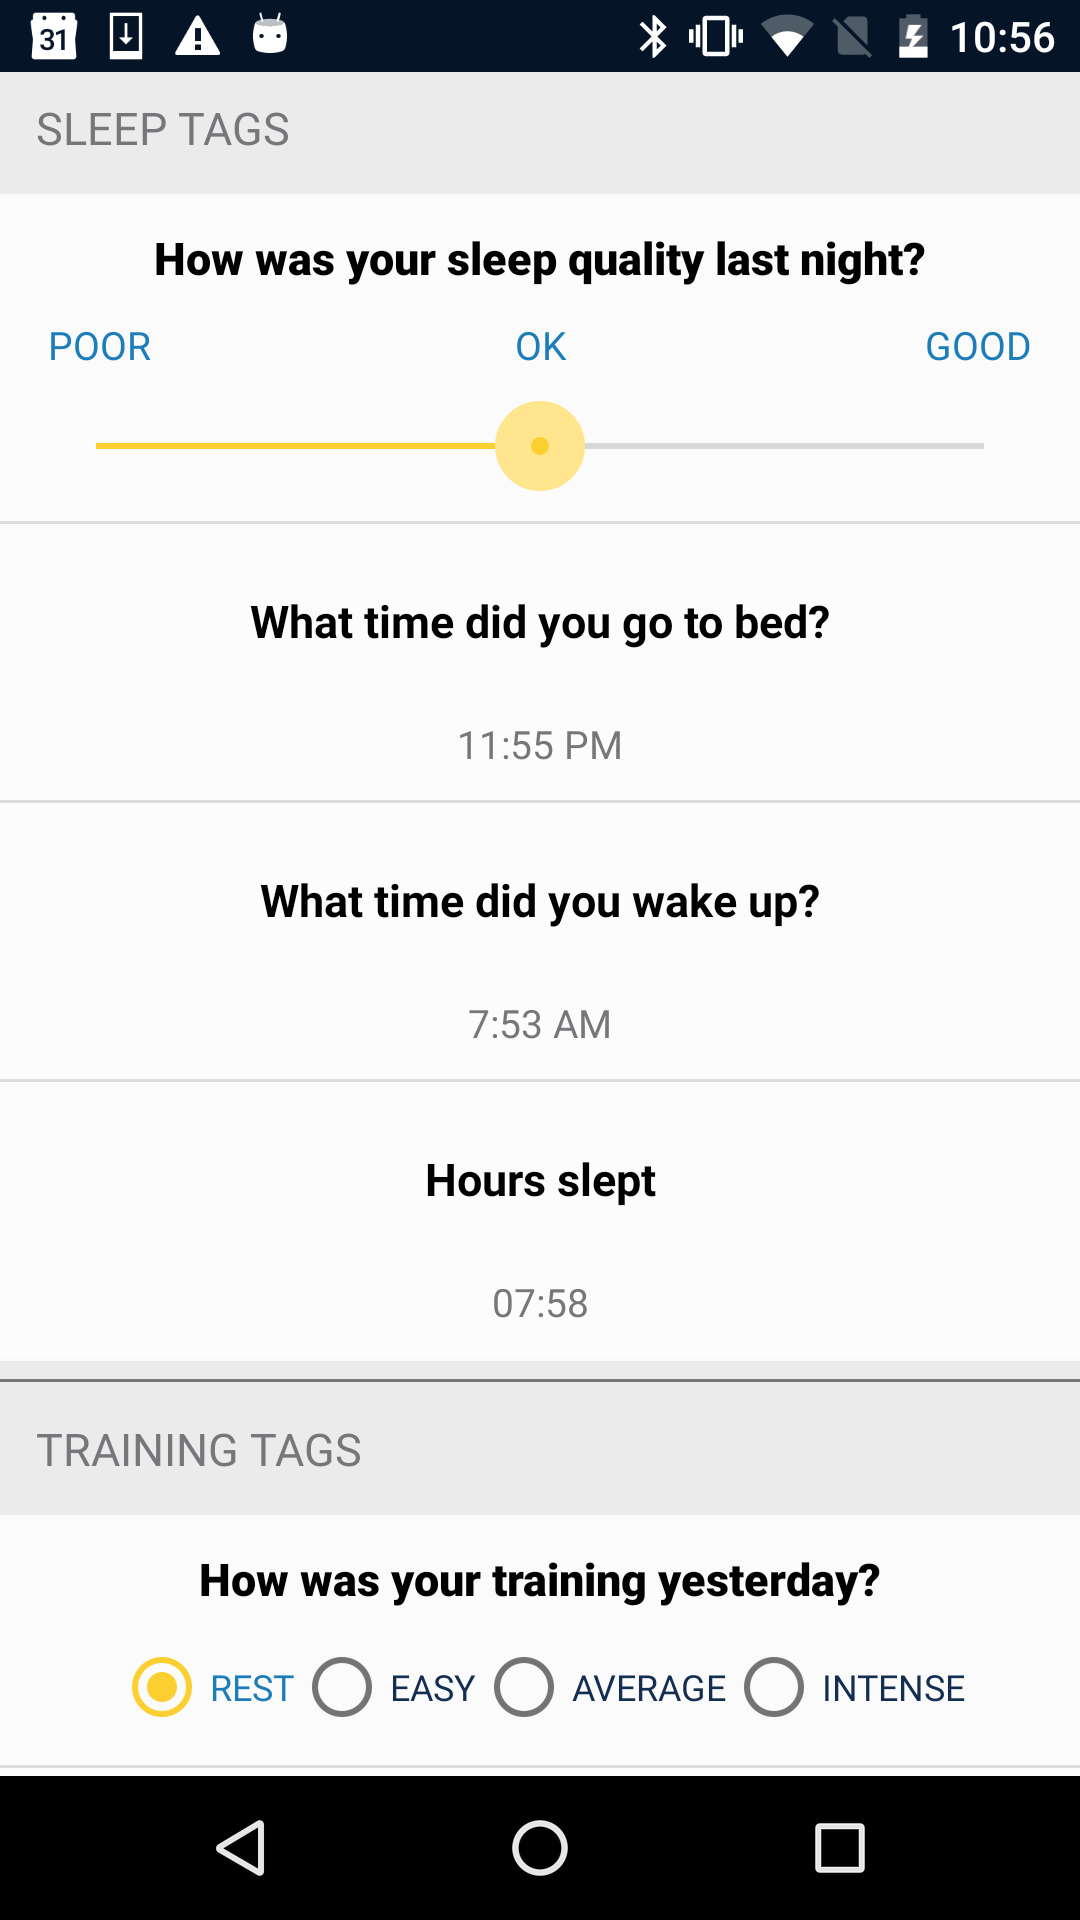
1.2 Tags
Context is everything. After each measurement you'll be prompted with different Tags related to your current lifestyle and trainings. You can annotate not only training days and intensities but also a series of other parameter that can affect physiological stress, performance, and training. For example sleep quality, mental tiredness, muscle fatigue and more.
Your annotated Tags will be used to provide more interesting analytics on the relation between your trainings and HRV. You'll also be able to see some of the tags in the history view and plot custom correlations. Finally, you can even add up to three custom tags.
If you are a Strava user, you can also link Strava and HRV4Training and get your training-related tags automatically in the app, as described here.
|
|
|
|
|
|
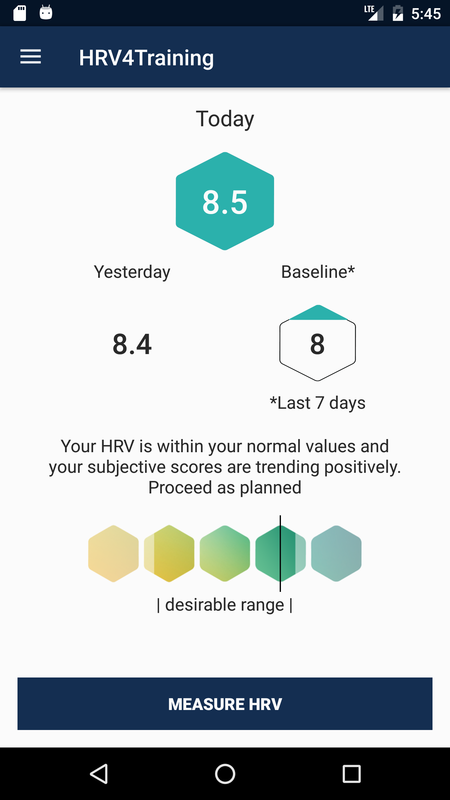
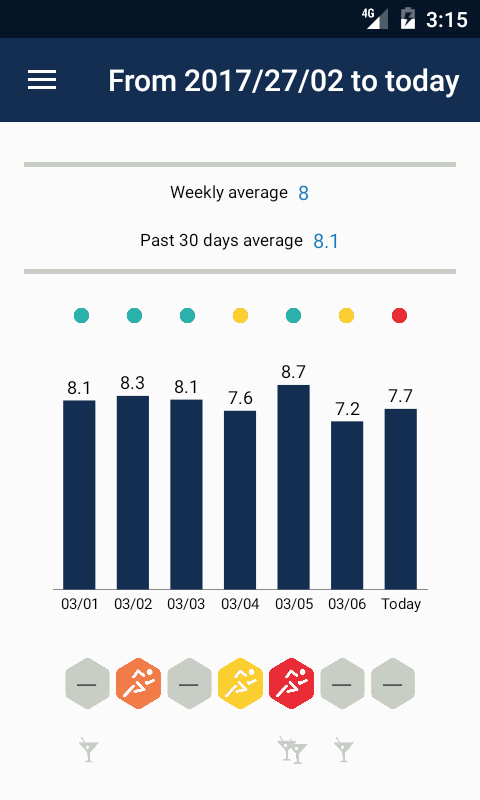
2. HRV-based Daily Advice
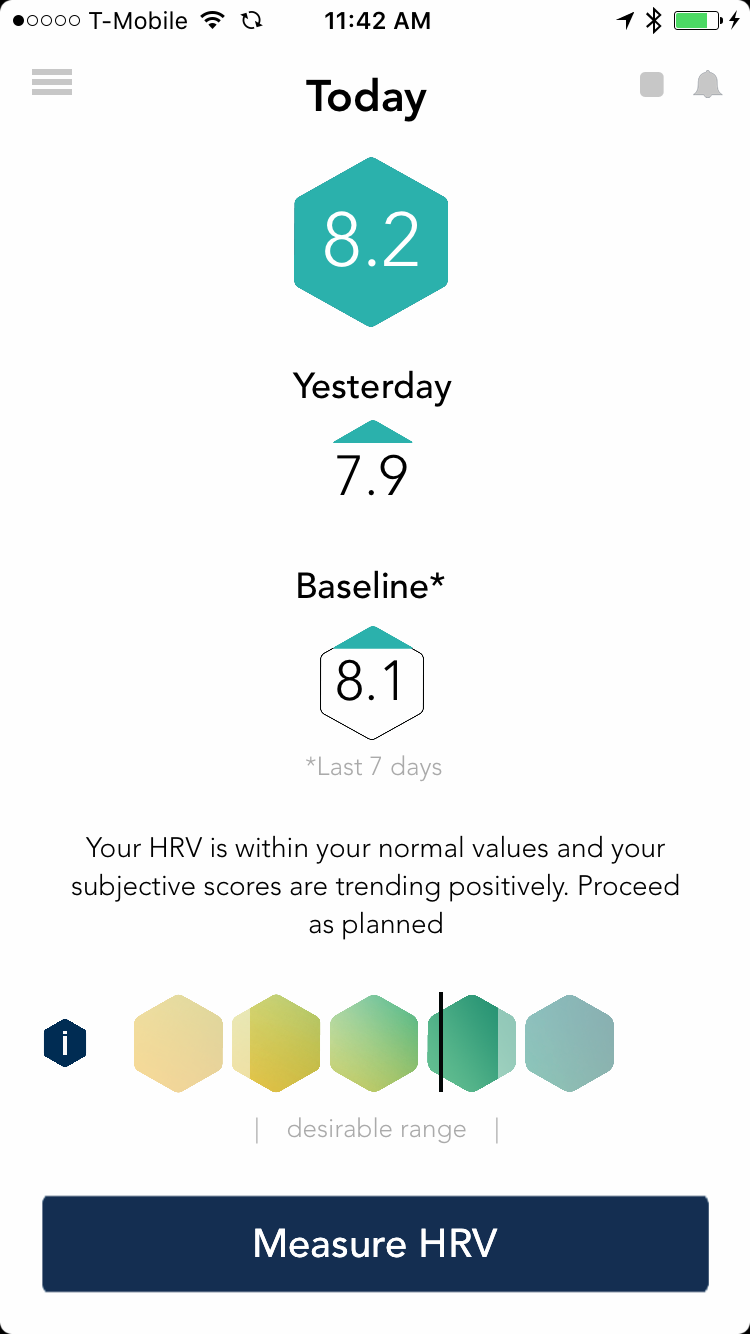
HRV4Training provides advice based on objective assessment of physical condition and your subjective scores. HRV over the last week is used to determine your baseline (at least 4 days of measurements are required), while the past 2 months of data are used to determine what your normal HRV values are. The daily advice aims at helping you in making small daily adjustments to your training program, by keeping in consideration not only how your score changed from yesterday's, but also with respect to your past 7 days moving average (i.e. the baseline), your normal values, and factoring in your subjective scores and recent trends (when enough data is present). You can learn more about the daily advice at this link. |
|
|
|
|
|
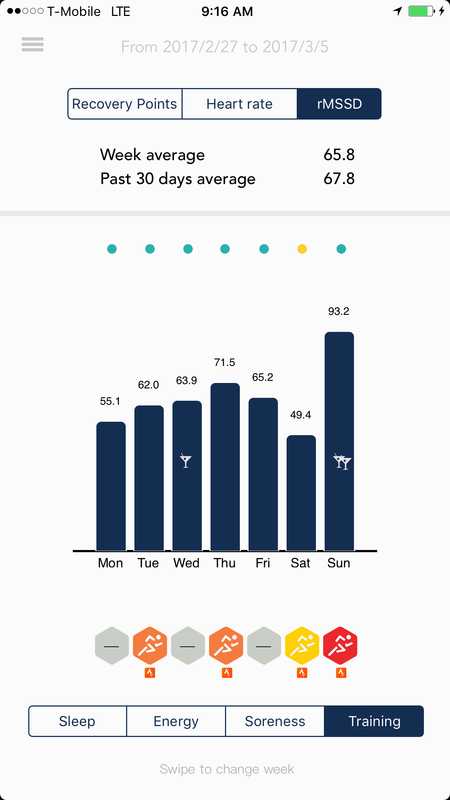
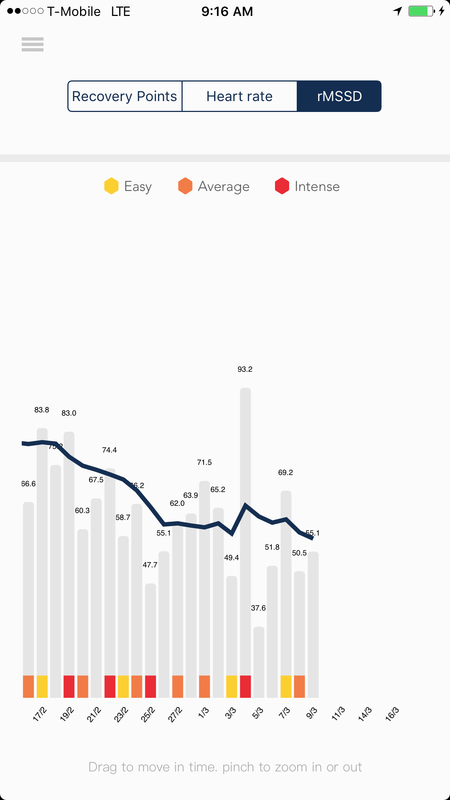
2.1 History and Training Annotations
Once you've got some data, use the history tab to browse through it and look at the different features that were extracted during the test. You'll also be able to see the impact of some of your tags (e.g. travel, alcohol intake, injuries, etc.) on your physiological stress level. The Baseline page helps you in going beyond short daily variability, and get a better overview of your physical condition. |
The blue line is a 7 days moving average, which captures the global trend of your HRV, without being too affected by daily swings. At the bottom you can see annotated trainings as well.
|
2.2 HRV4T Recovery Points HRV4T Recovery Points provide a single, straightforward metric to analyze your physical condition. They are based on the single most used metric to quantify recovery based on HRV, which is rMSSD. Additionally, HRV4T Recovery Points adapt the score based on your anthropometrics. HRV4T Recovery Points are used to compute your baseline. Daily deviations from this baseline are shown in the color-coded Advice bar, in your home screen. 2.3 Population comparisons
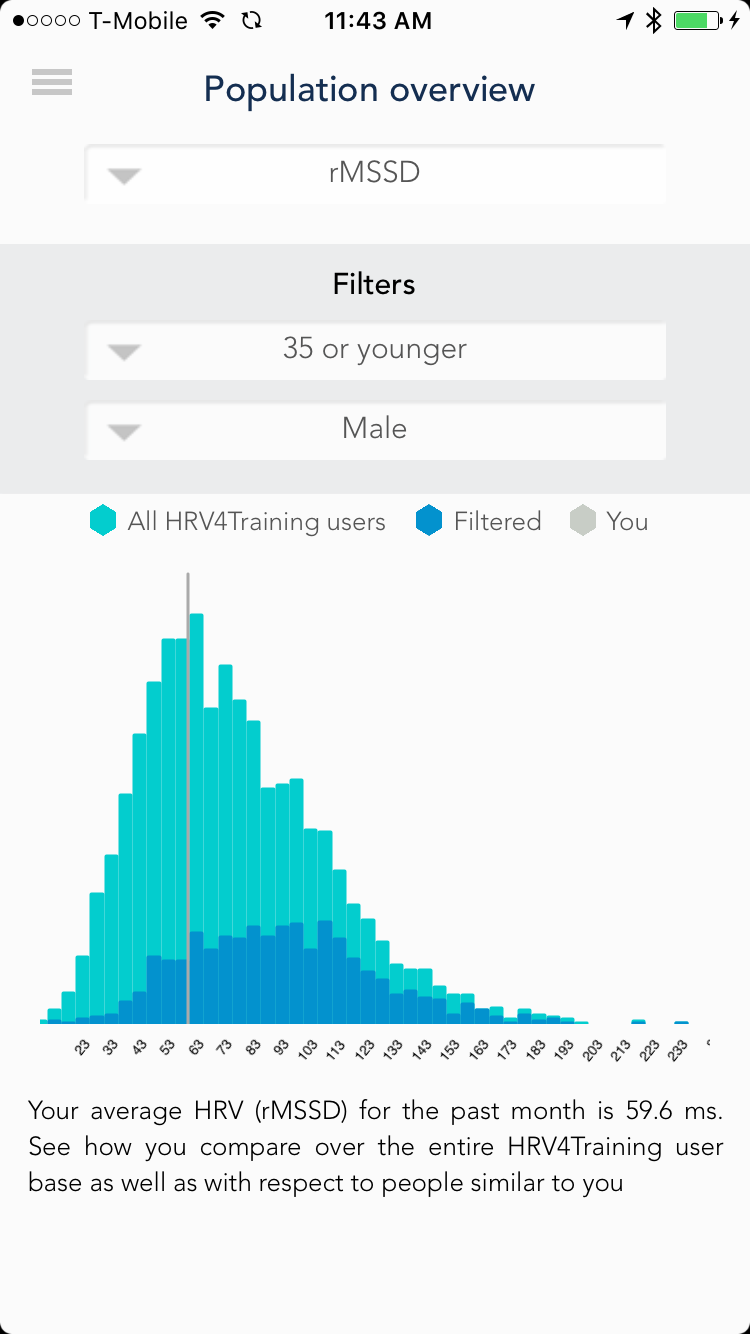
In this page you can see how you compare with respect to other HRV4T users. You'll be able to pick different physiological parameters (heart rate, rMSSD, Recovery Points) as well as stratify by age and gender. You can learn more about HR and HRV population values on this blog post. |
3. HRV4Training Insights
HRV4Training provides more advanced experimental analysis that look at both acute HRV changes and long term trends to better understand the big picture. In particular, under Menu - Insights, you can find:
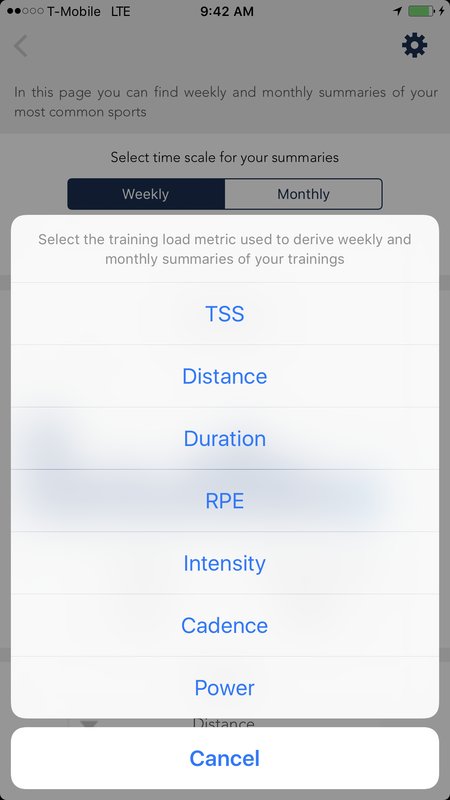
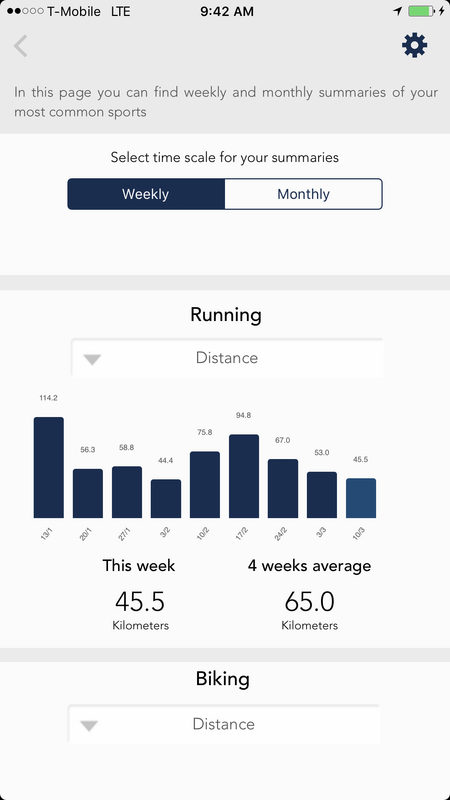
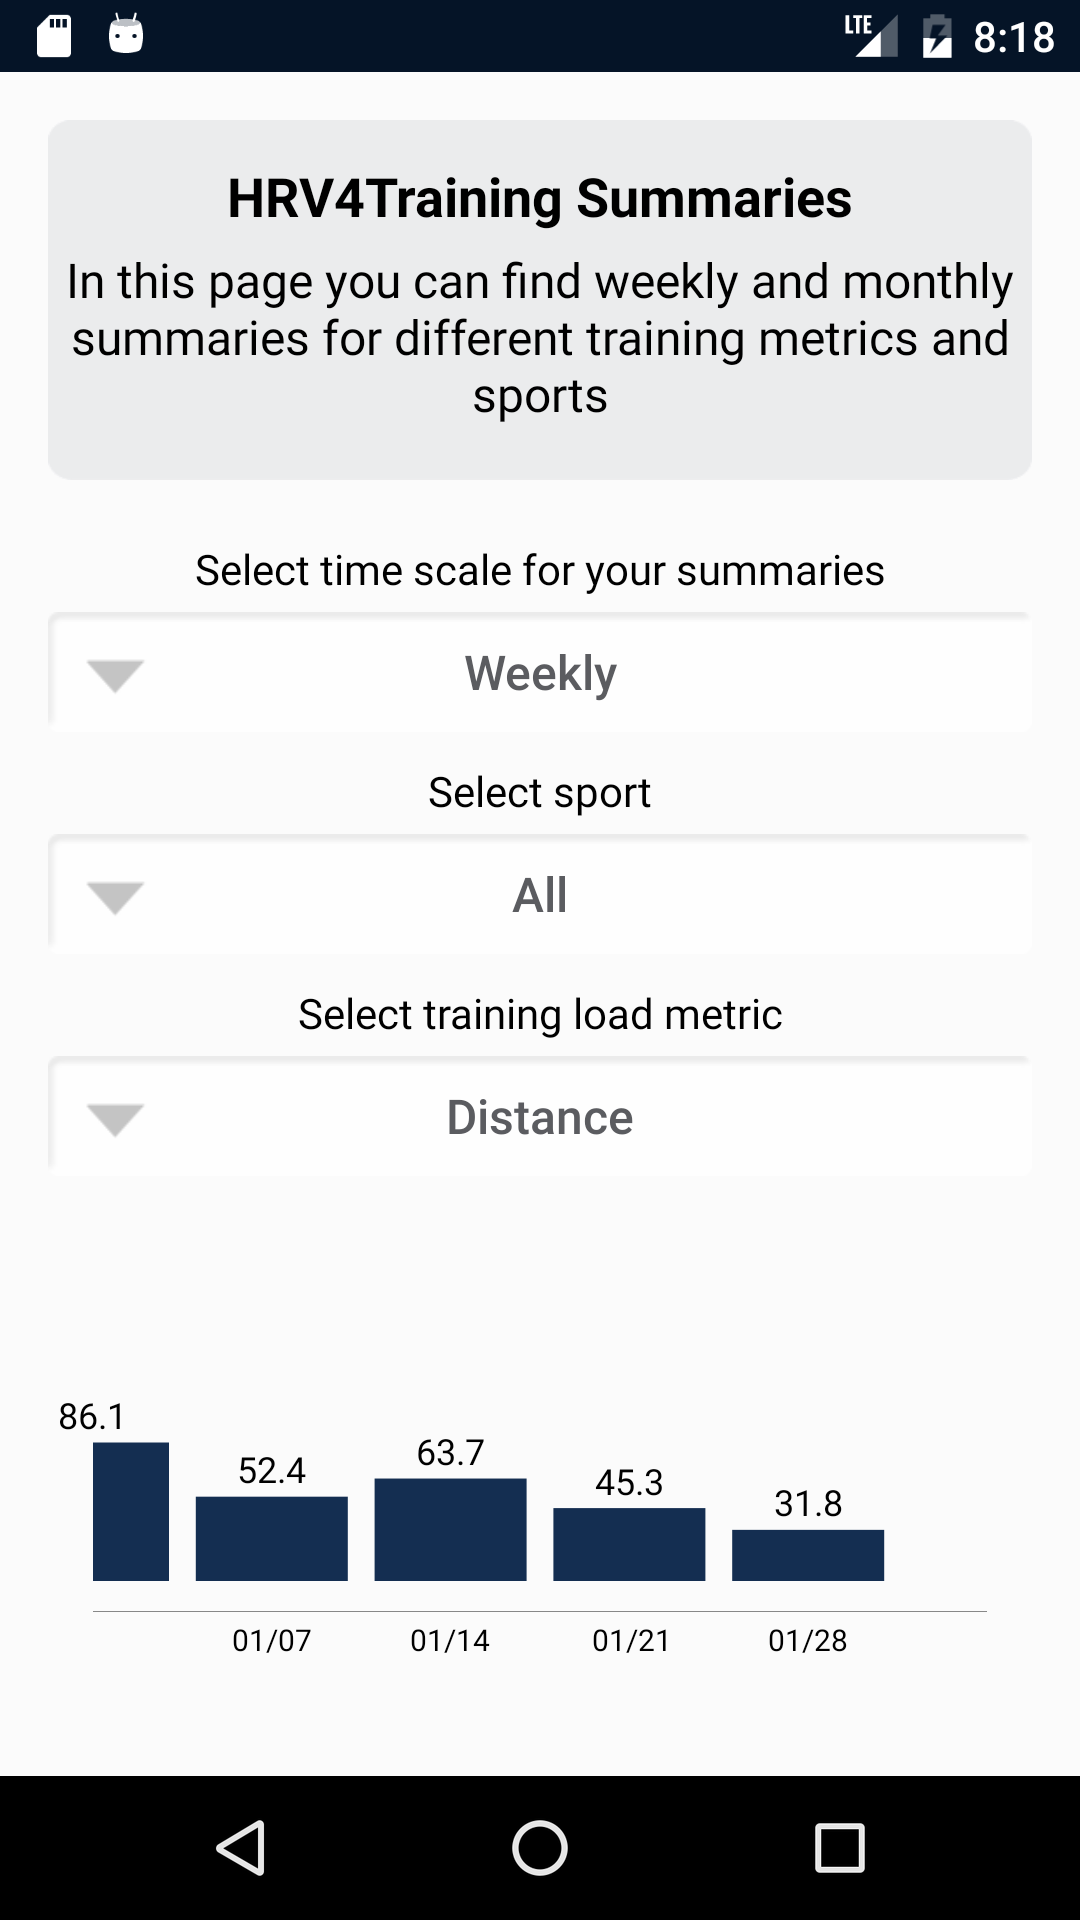
- Weekly and montlhy summaries: pick the metric most representative of your athlete's trainings (e.g. RPE, TSS, Suffer Score, training distance) and analyze training load breakdowns by week and month to keep better track of overall progress.
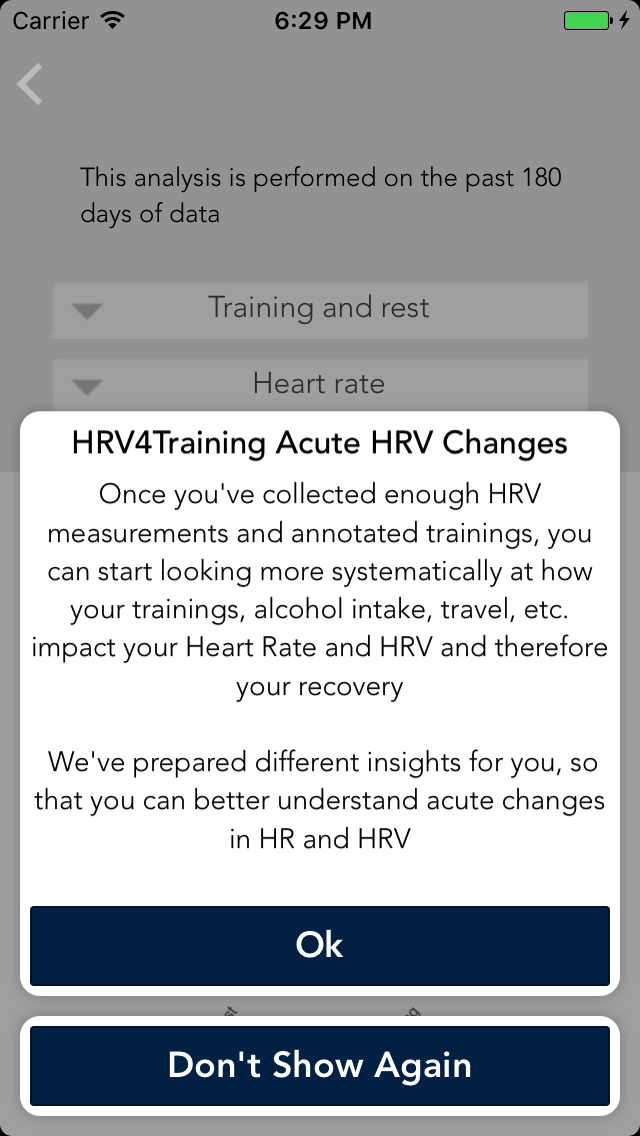
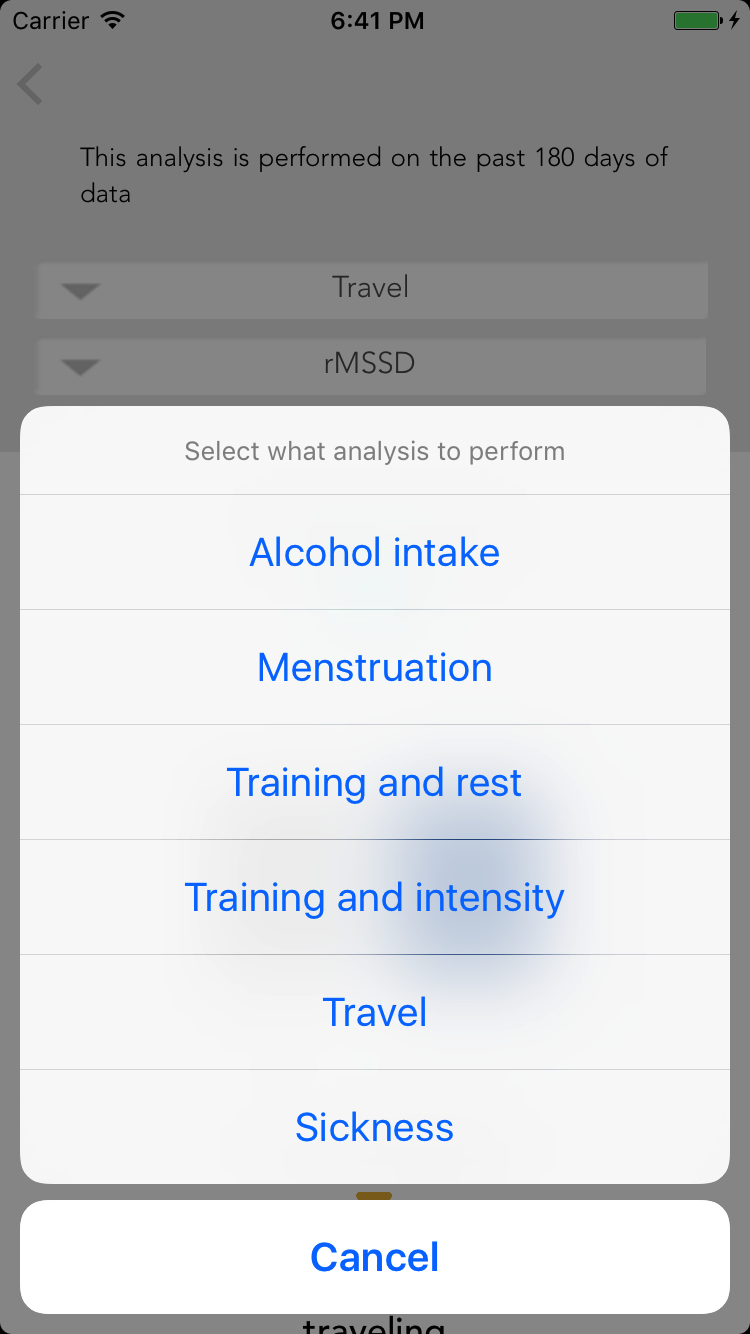
- Acute HRV changes in response to training and other stressors: systematic analysis of day to day changes in HRV on days following training, alcohol intake, travel, menstruation and sick days. Are your athletes physiologically rested after rest days and easy training? What drop in HRV can you expect after an intense training? How does travel affect their physiology?
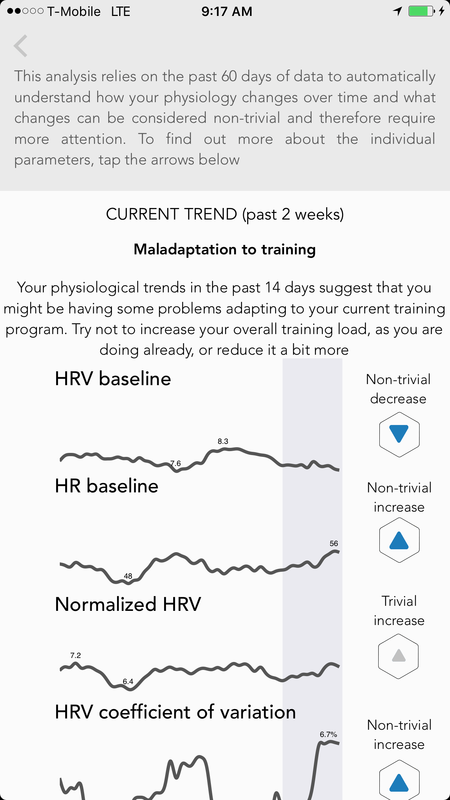
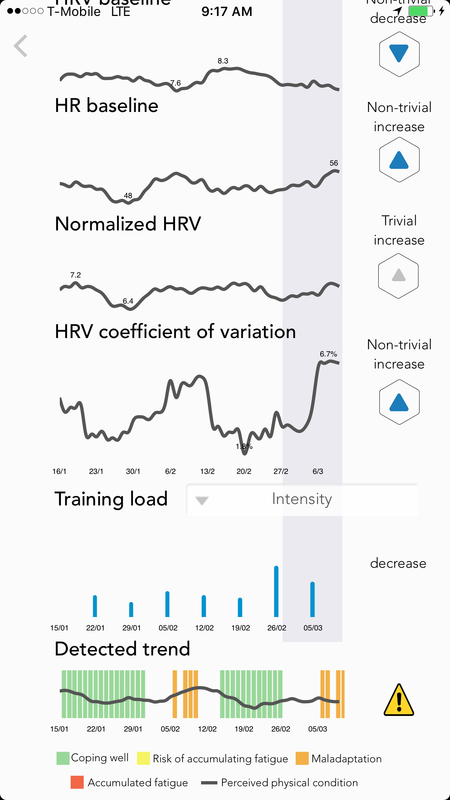
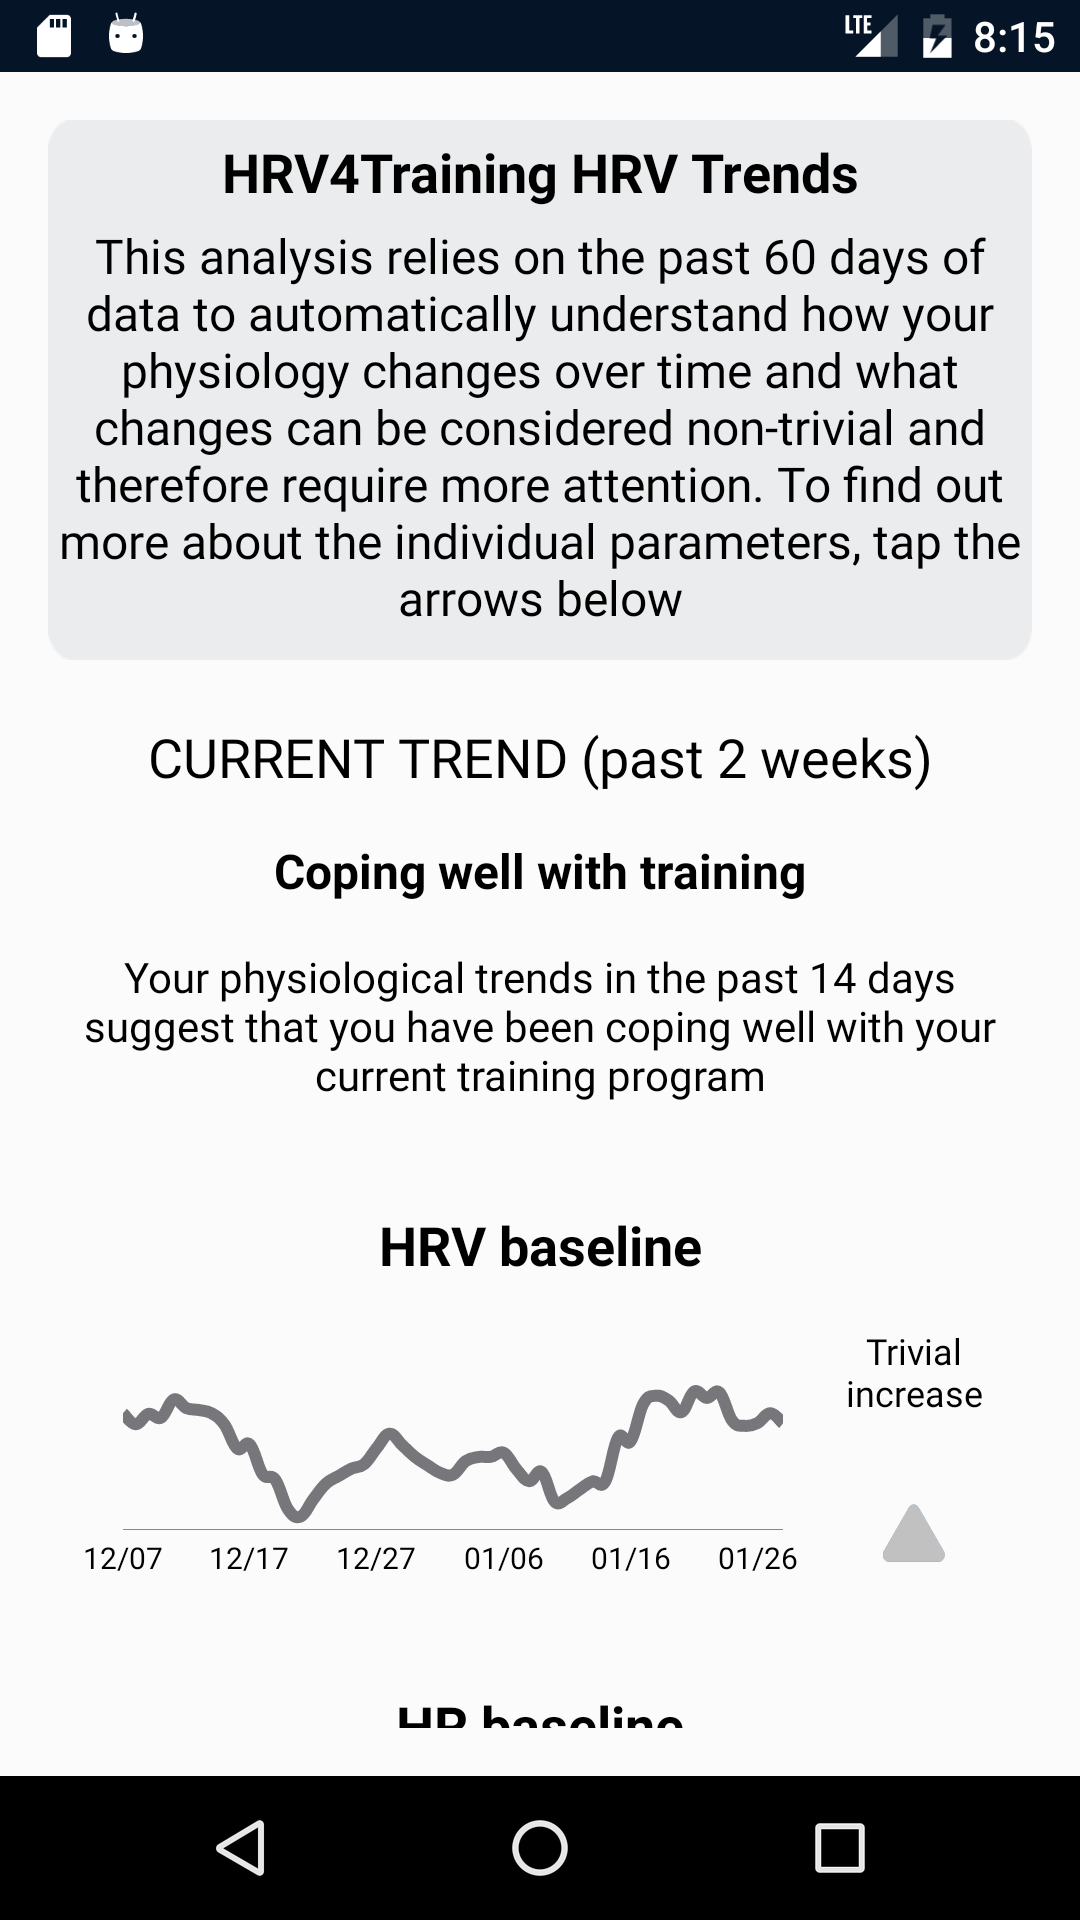
- HRV trends: provide more insights on the big picture. Look at baseline changes on multiple parameters relevant to your physical condition (e.g. HRV baseline, HRV, coefficient of variation, training load), etc. The app can automatically determine if your recent HR or HRV trend is changing in a trivial way, or if the change is something to take more seriously, based on your historical data.
- Correlations: mainly for exploratory analysis inside the app. Look at what factors are related to physiological changes, and try to adjust your lifestyle accordingly (a good one is typically sleep quality).
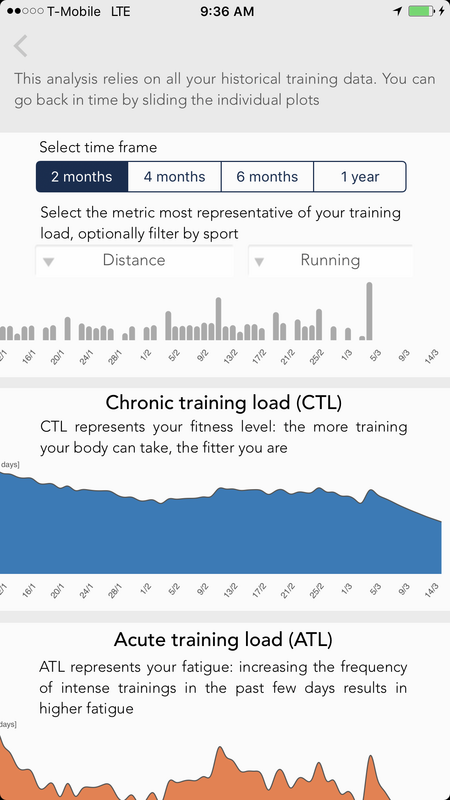
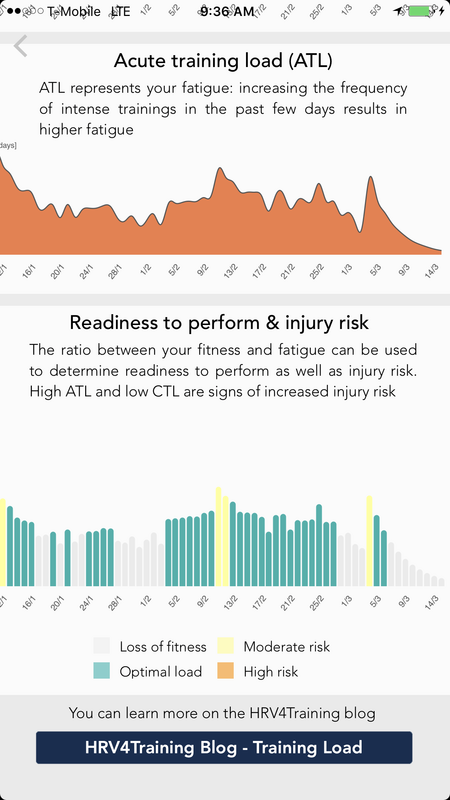
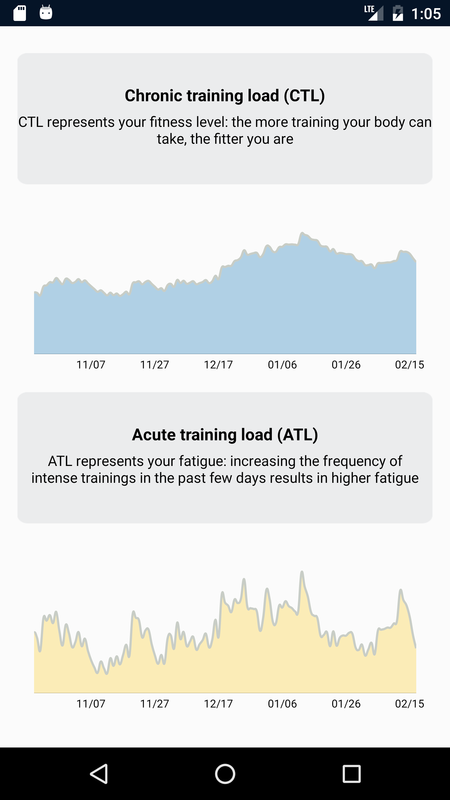
- Training load analysis: you can pick the metric most representative of your trainings (e.g. TSS, Suffer Score, training distance or your own custom metric) and analyze fitness & fatigue, determined as chronic and acute training loads, as well as readiness to perform and injury risk.
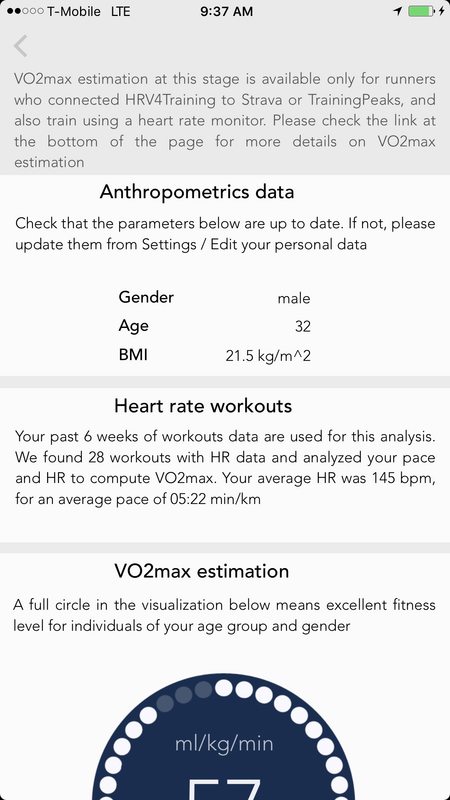
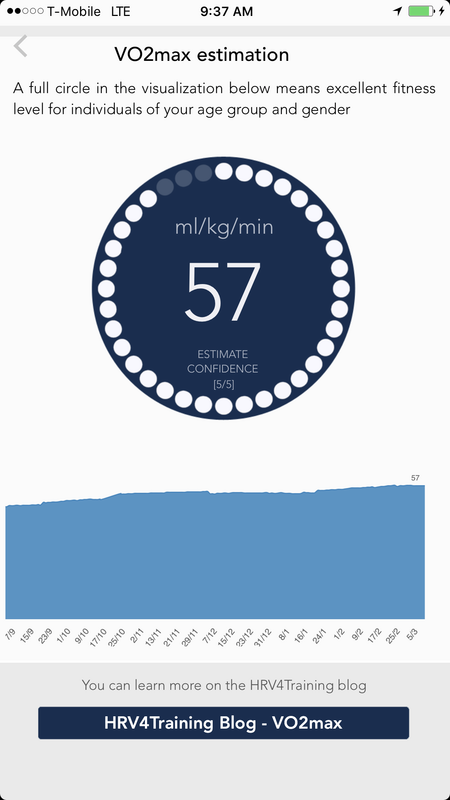
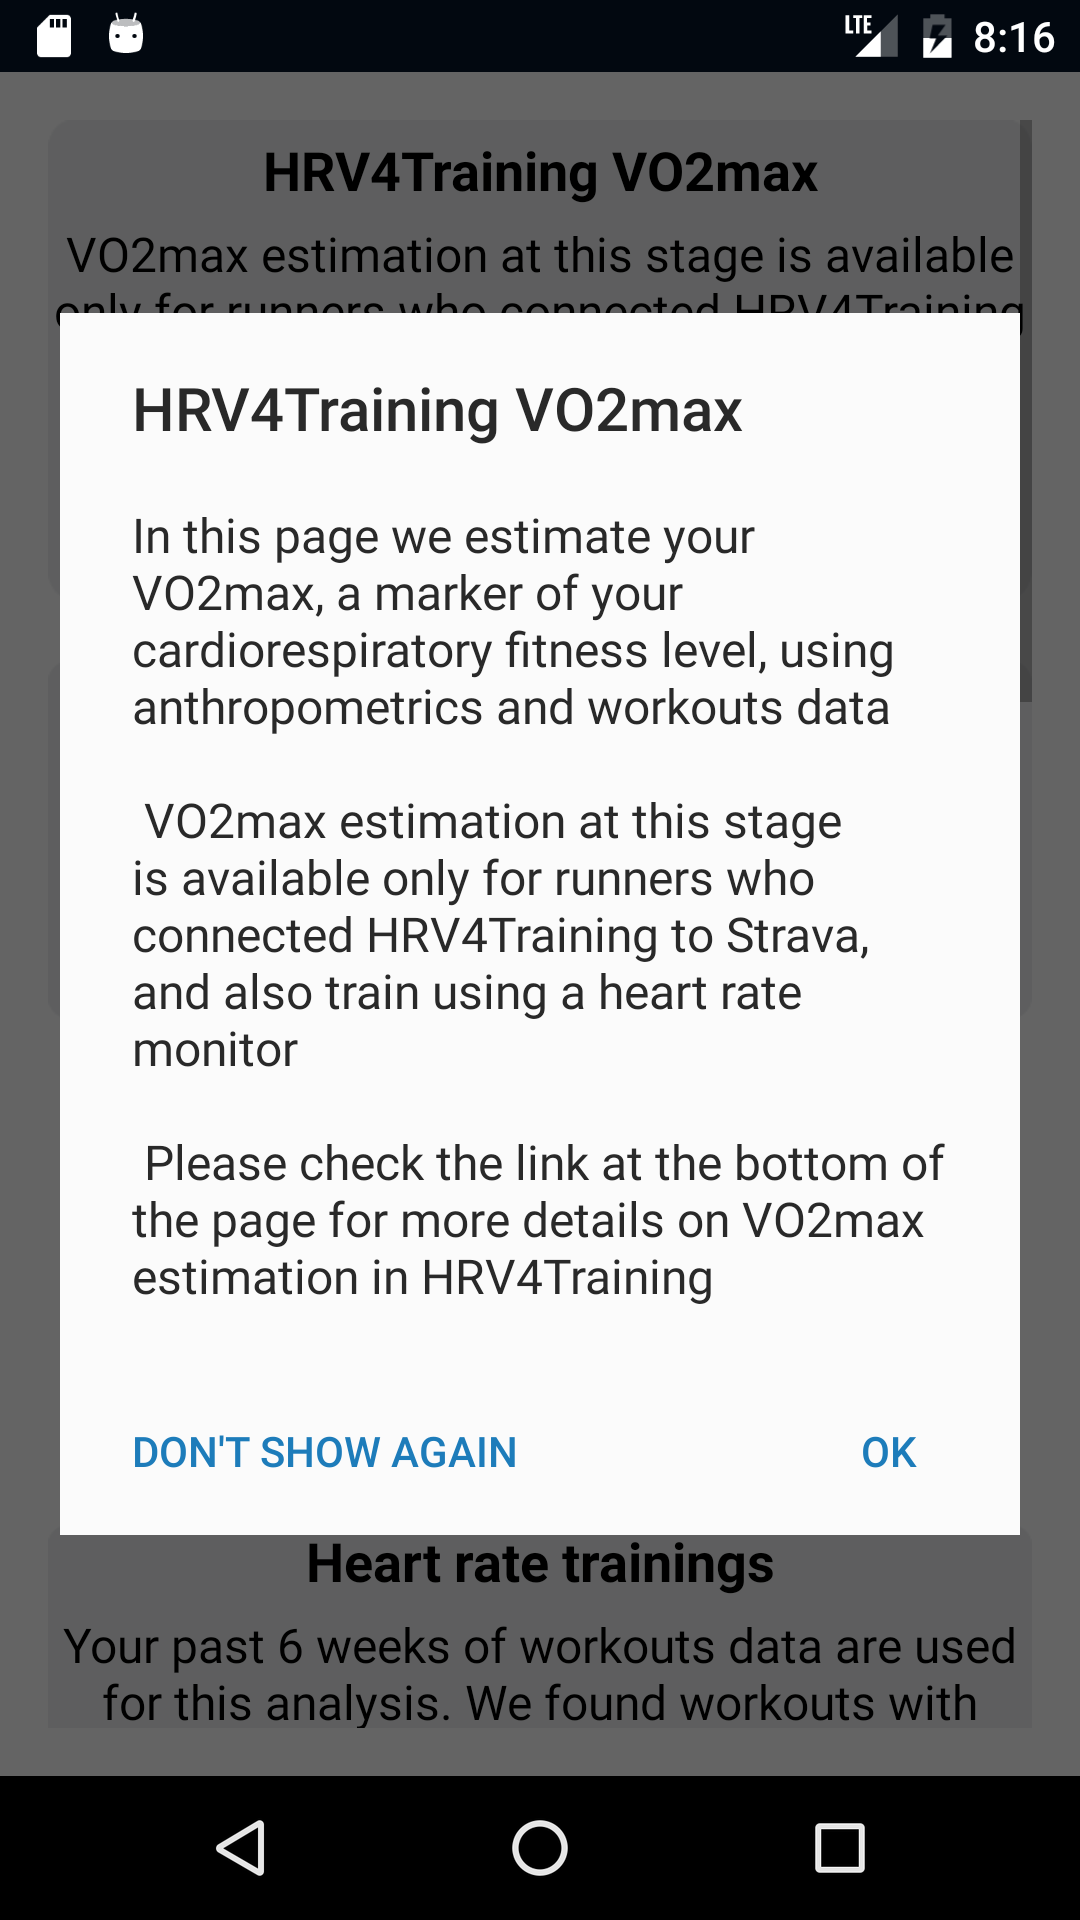
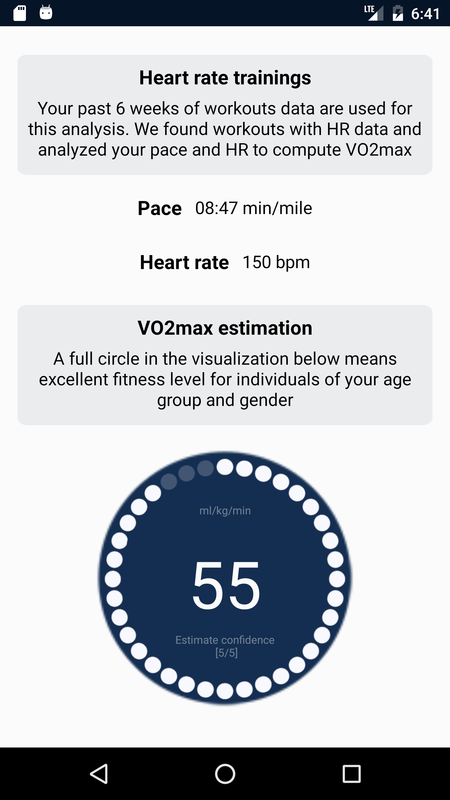
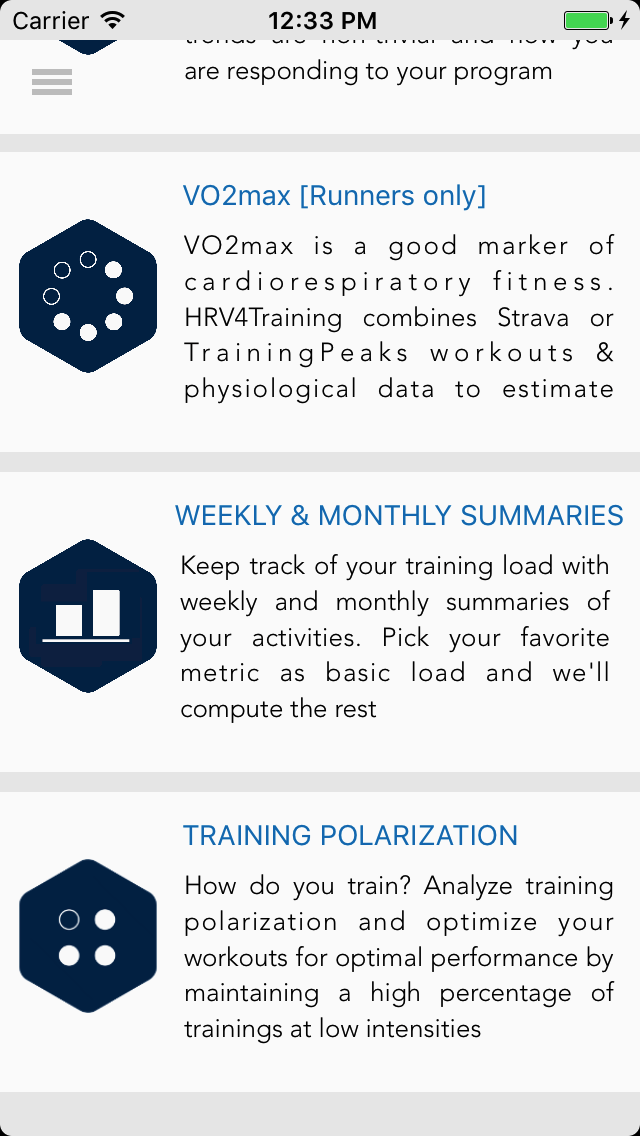
- VO2max estimation: For runners and cyclists using the Strava integration and training with a HR monitor (and power), HRV4Training can estimate cardiorespiratory fitness level (VO2max). Check out this post for more details.
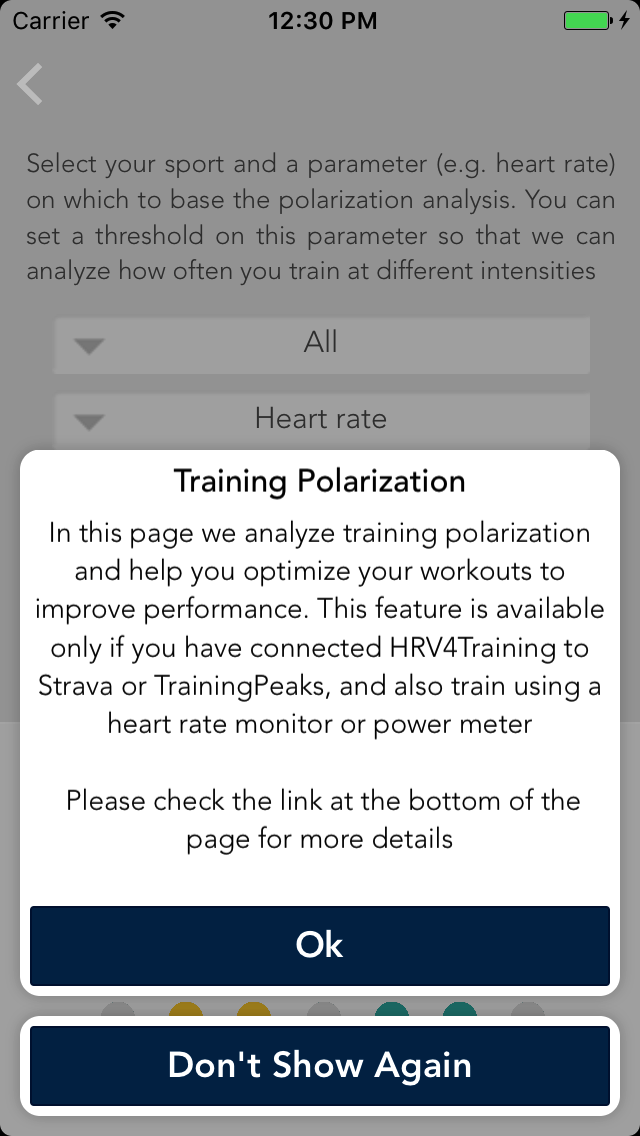
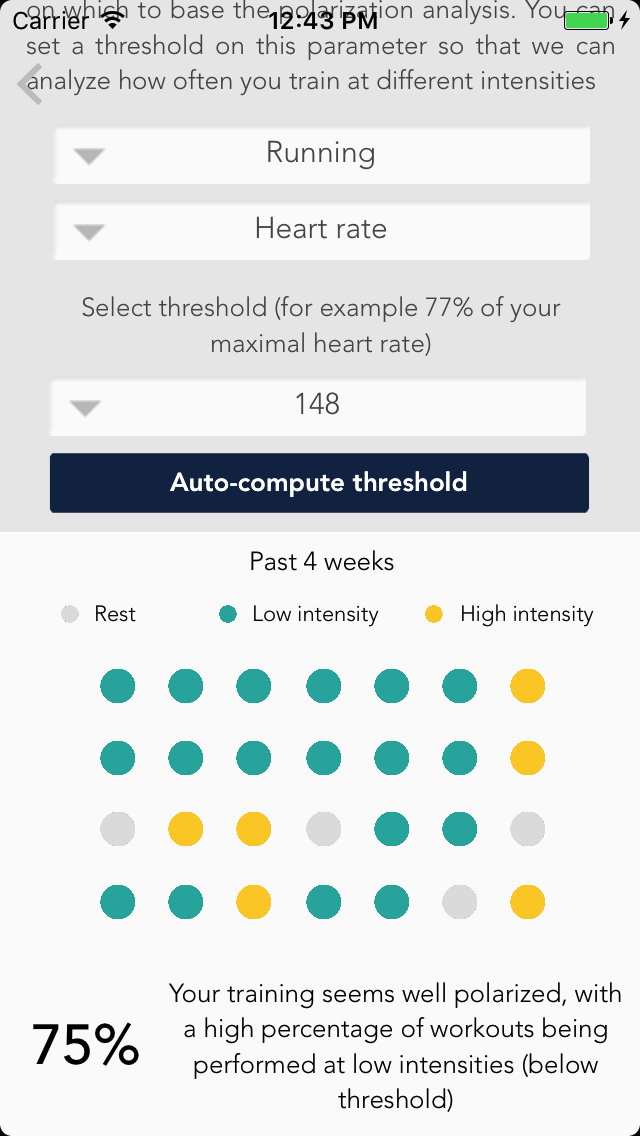
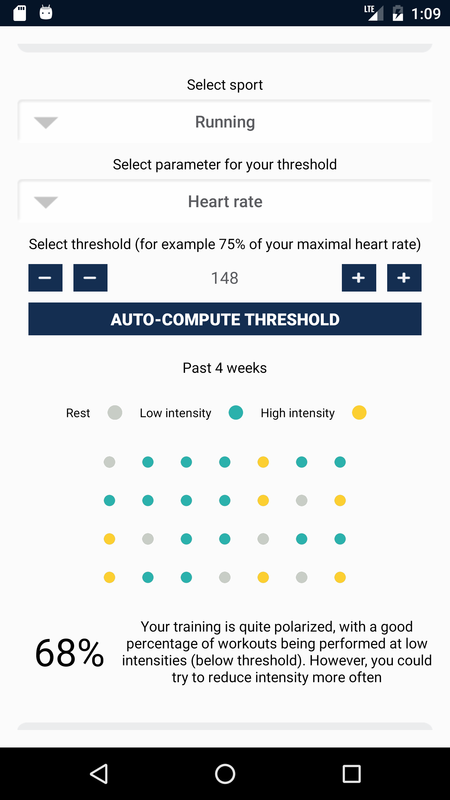
- Training polarization analysis: this analysis allows you to get an overview of how hard you are training and potentially polarize more your training, as a more polarized approach, typically involving training about 80% of the time at very low intensities, has been shown to improve performance for both recreational and elite athletes. More details on this analysis at this link.
3.1 Weekly and Monthly summaries
Pick the metric most representative of your athlete's trainings (e.g. RPE, TSS, Suffer Score, training distance) and analyze training load breakdowns by week and month to keep better track of overall progress.
|
|
|
|
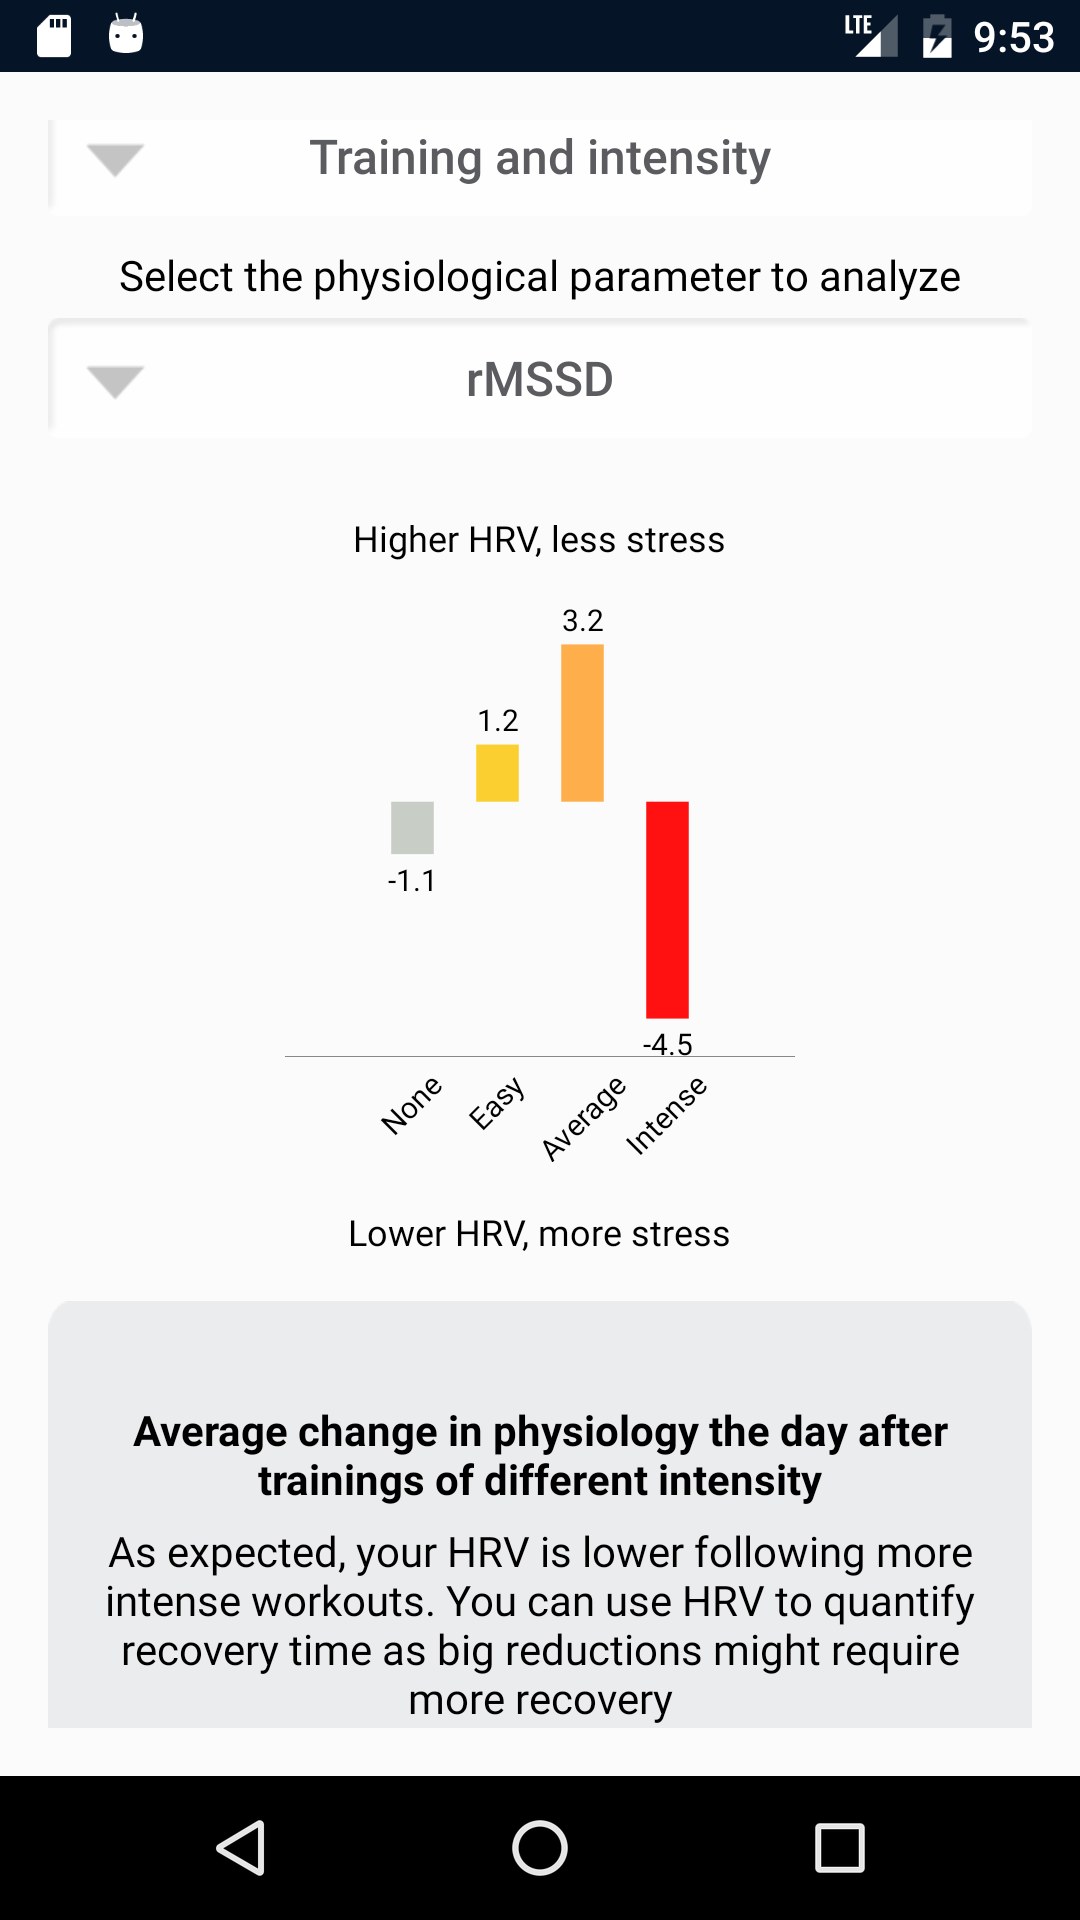
3.2 Acute HRV Changes in response to training, travel, alcohol intake, menstruation & getting sick
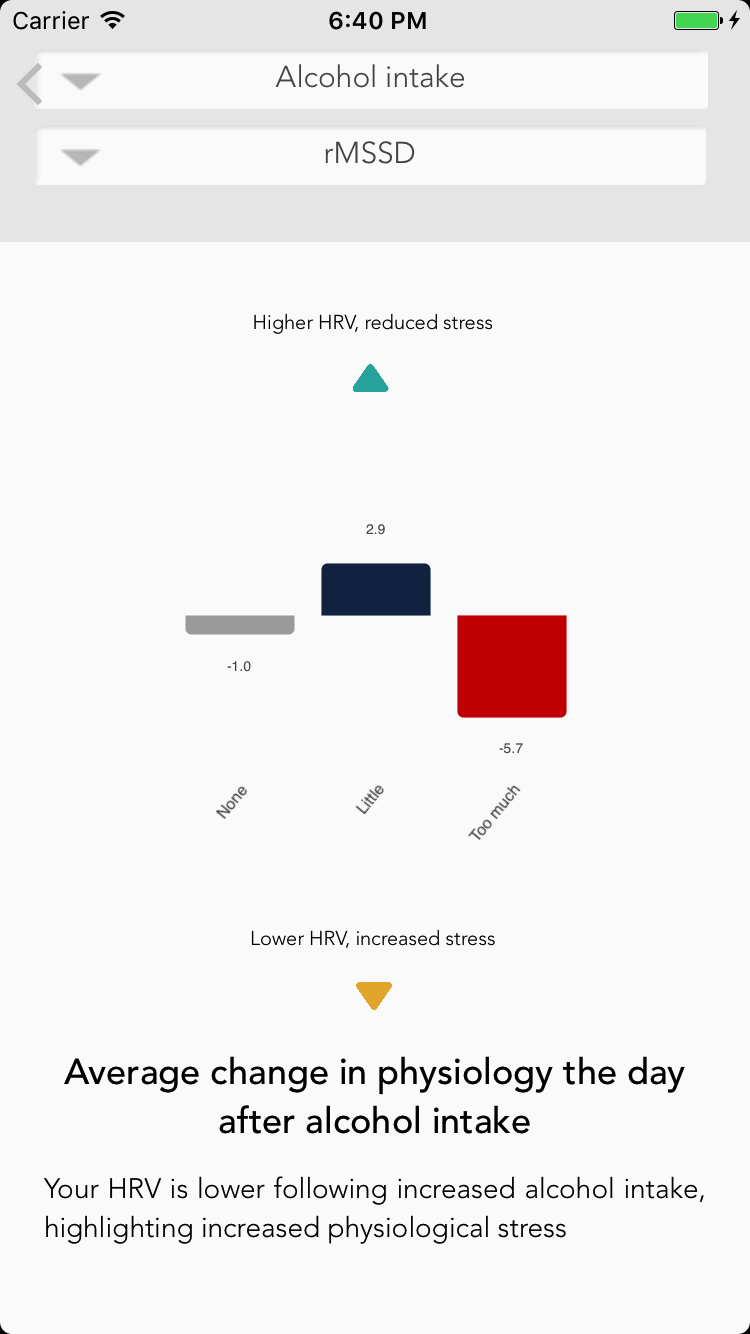
Acute stressors are events that affect your physiology in the immediate future. Think about an intense aerobic workout, an intercontinental flight, a night out with too many drinks, high caffeine intake, etc. Acute stressors are typically the easiest phenomena to interpret and reproduce, and looking at data in the context of acute stressors can help understanding how your physiology works. Looking at acute changes can also help in gaining confidence in the tools we use, as these changes should be captured more easily.
|
|
|
|
In the Acute HRV Changes analysis you will be able to look at acute changes in two different ways. For certain stressors, which have an impact on the following day physiology (e.g. alcohol intake or a workout), we will show you the difference in HRV between "today" (stressor day) and "tomorrow" (day after the stressor), averaged over three months of data. Did your HRV decrease after a certain event? By how much? Is this decrease consistent? That's what you will be able to see for training (rest vs training as well as different annotated intensities) and alcohol intake. On the other hand, some stressors last for several days (for example getting sick, menstruation and travel). For these stressors we will not look at day to day changes but at the average HR or HRV values in the two conditions. What's your normal HR? Does it change when sick? See some additional screenshots above.
3.3 HRV Trends analysis
HRV4Training is also the first app that combines multi-parameter data to help you better understand the big picture. Look at baseline changes on multiple parameters relevant to your physical condition (e.g. HRV, HRV, coefficient of variation, training load), etc. The app can automatically determine if your recent HR orHRV trend is changing in a trivial way, or if the change is something to take more seriously, based on your historical data. You can read more in this blog post.
|
|
|
|
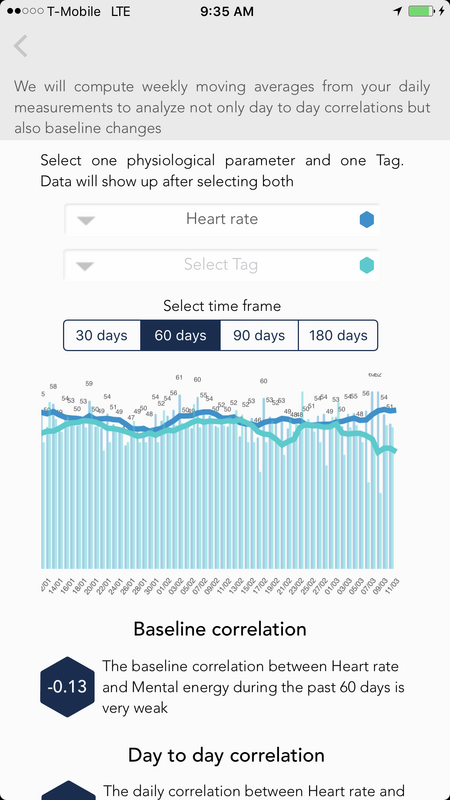
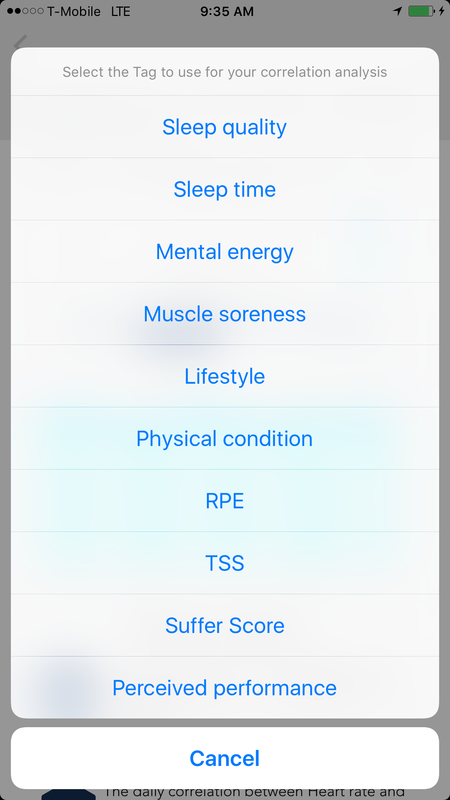
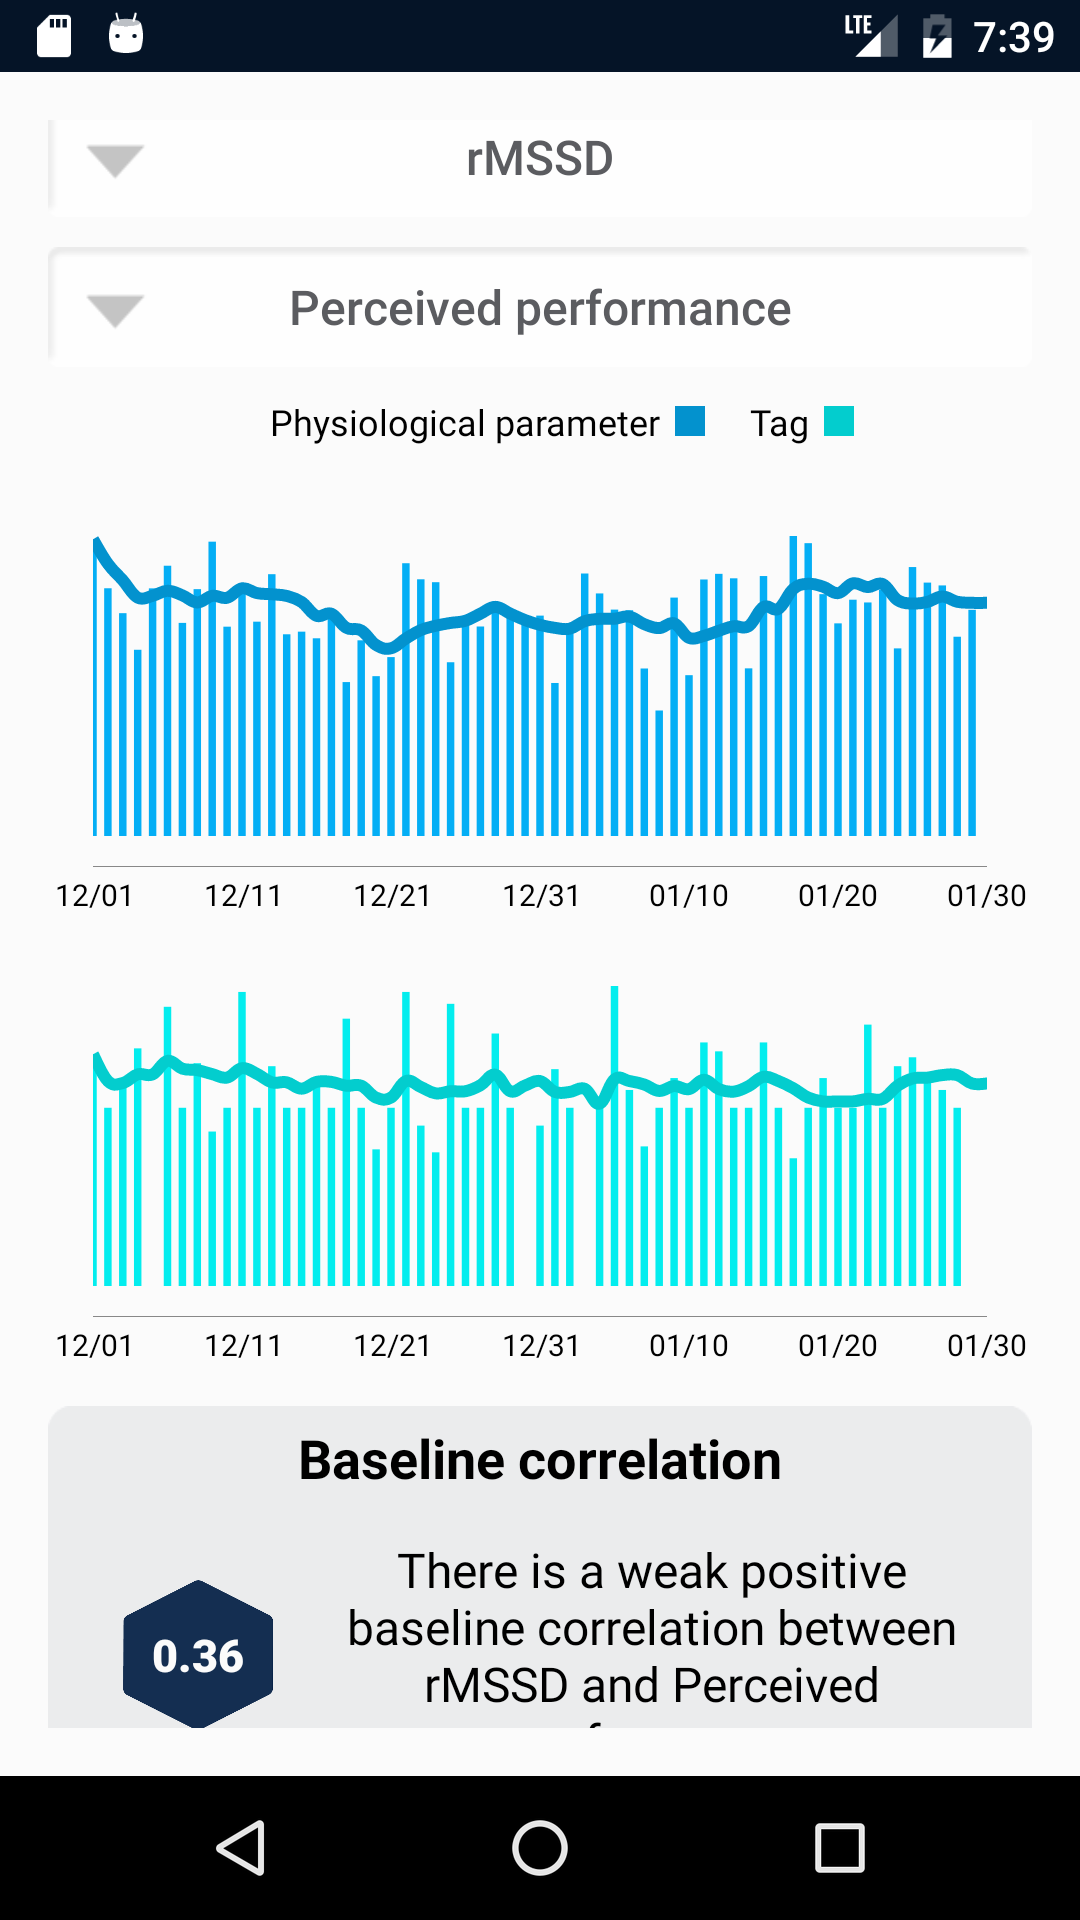
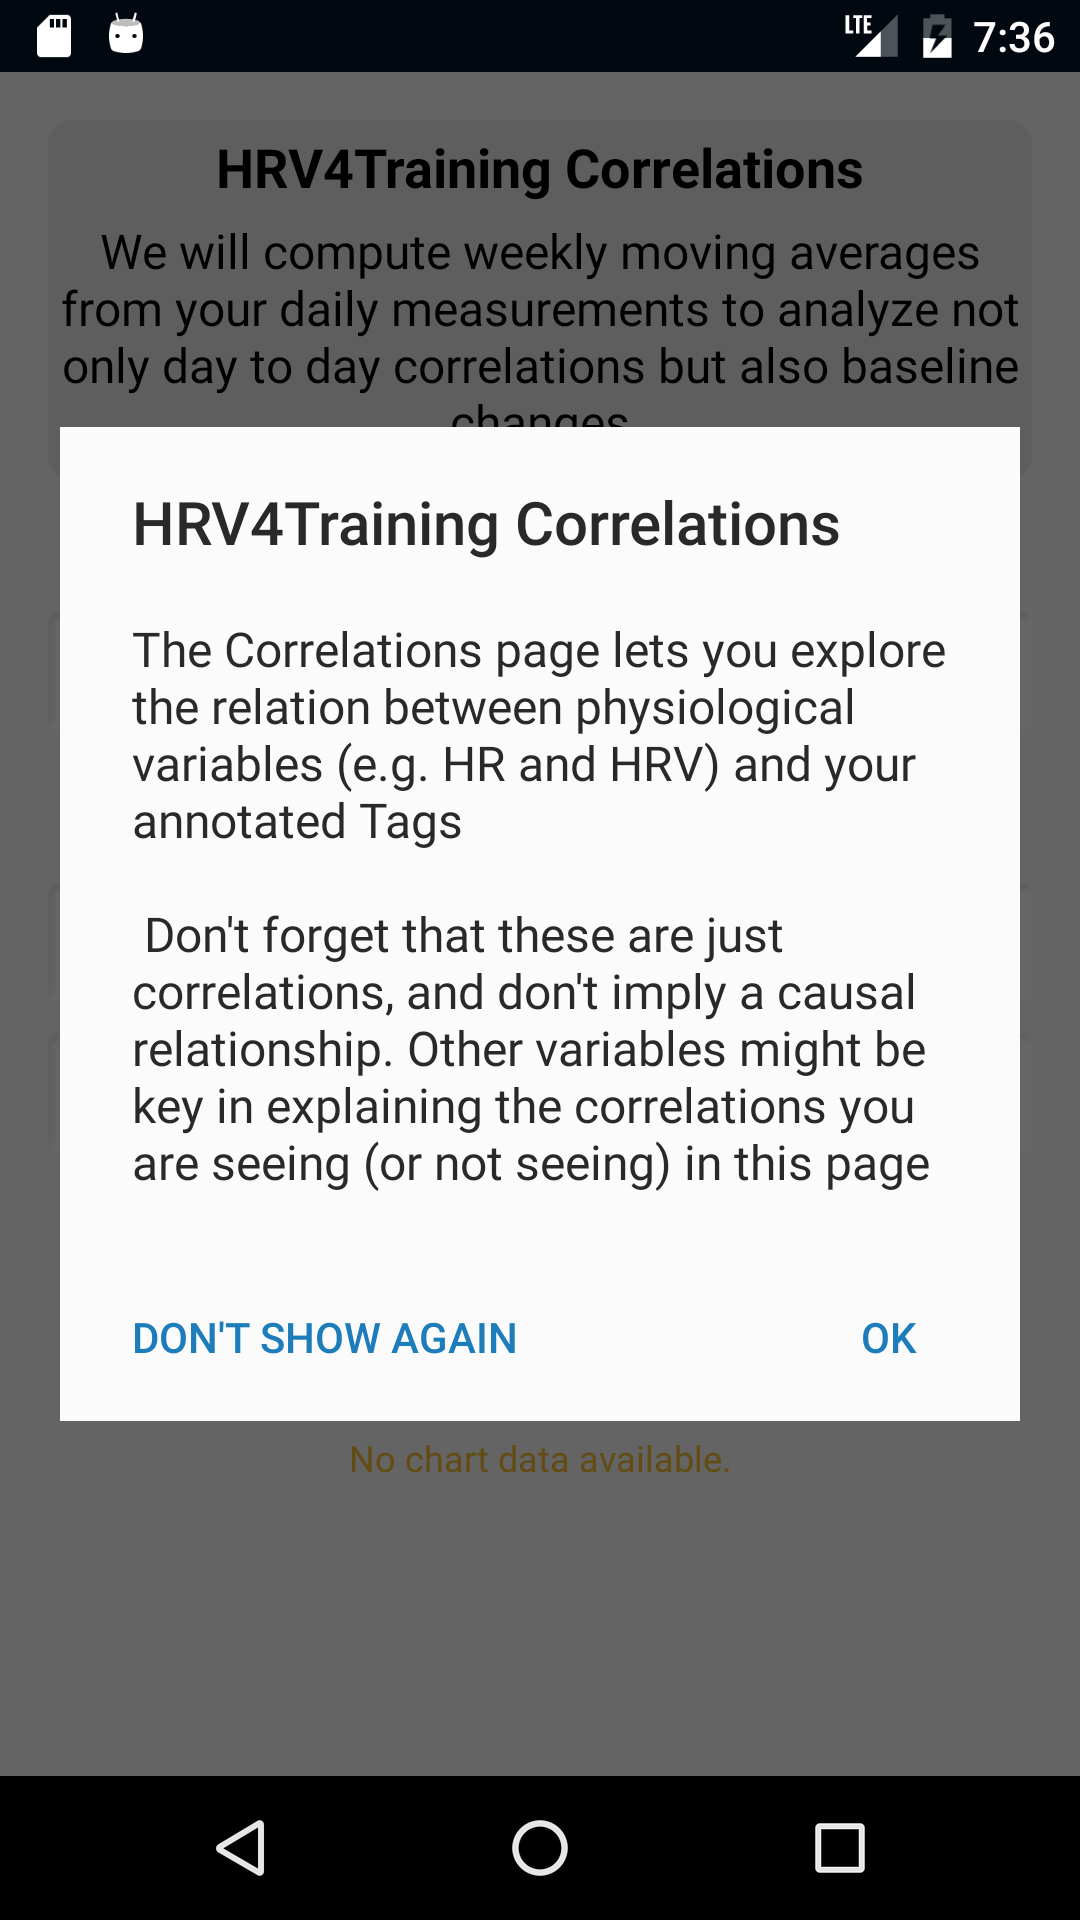
3.4 Correlations
You can explore the correlation between your annotations and physiological parameters (e.g. HR/HRV), under Insights - Correlations. Mainly for exploratory analysis inside the app. Look at what factors are related to physiological changes, and try to adjust your lifestyle accordingly (a good one is typically sleep quality).
Read more about this feature here.
Read more about this feature here.
|
|
|
|
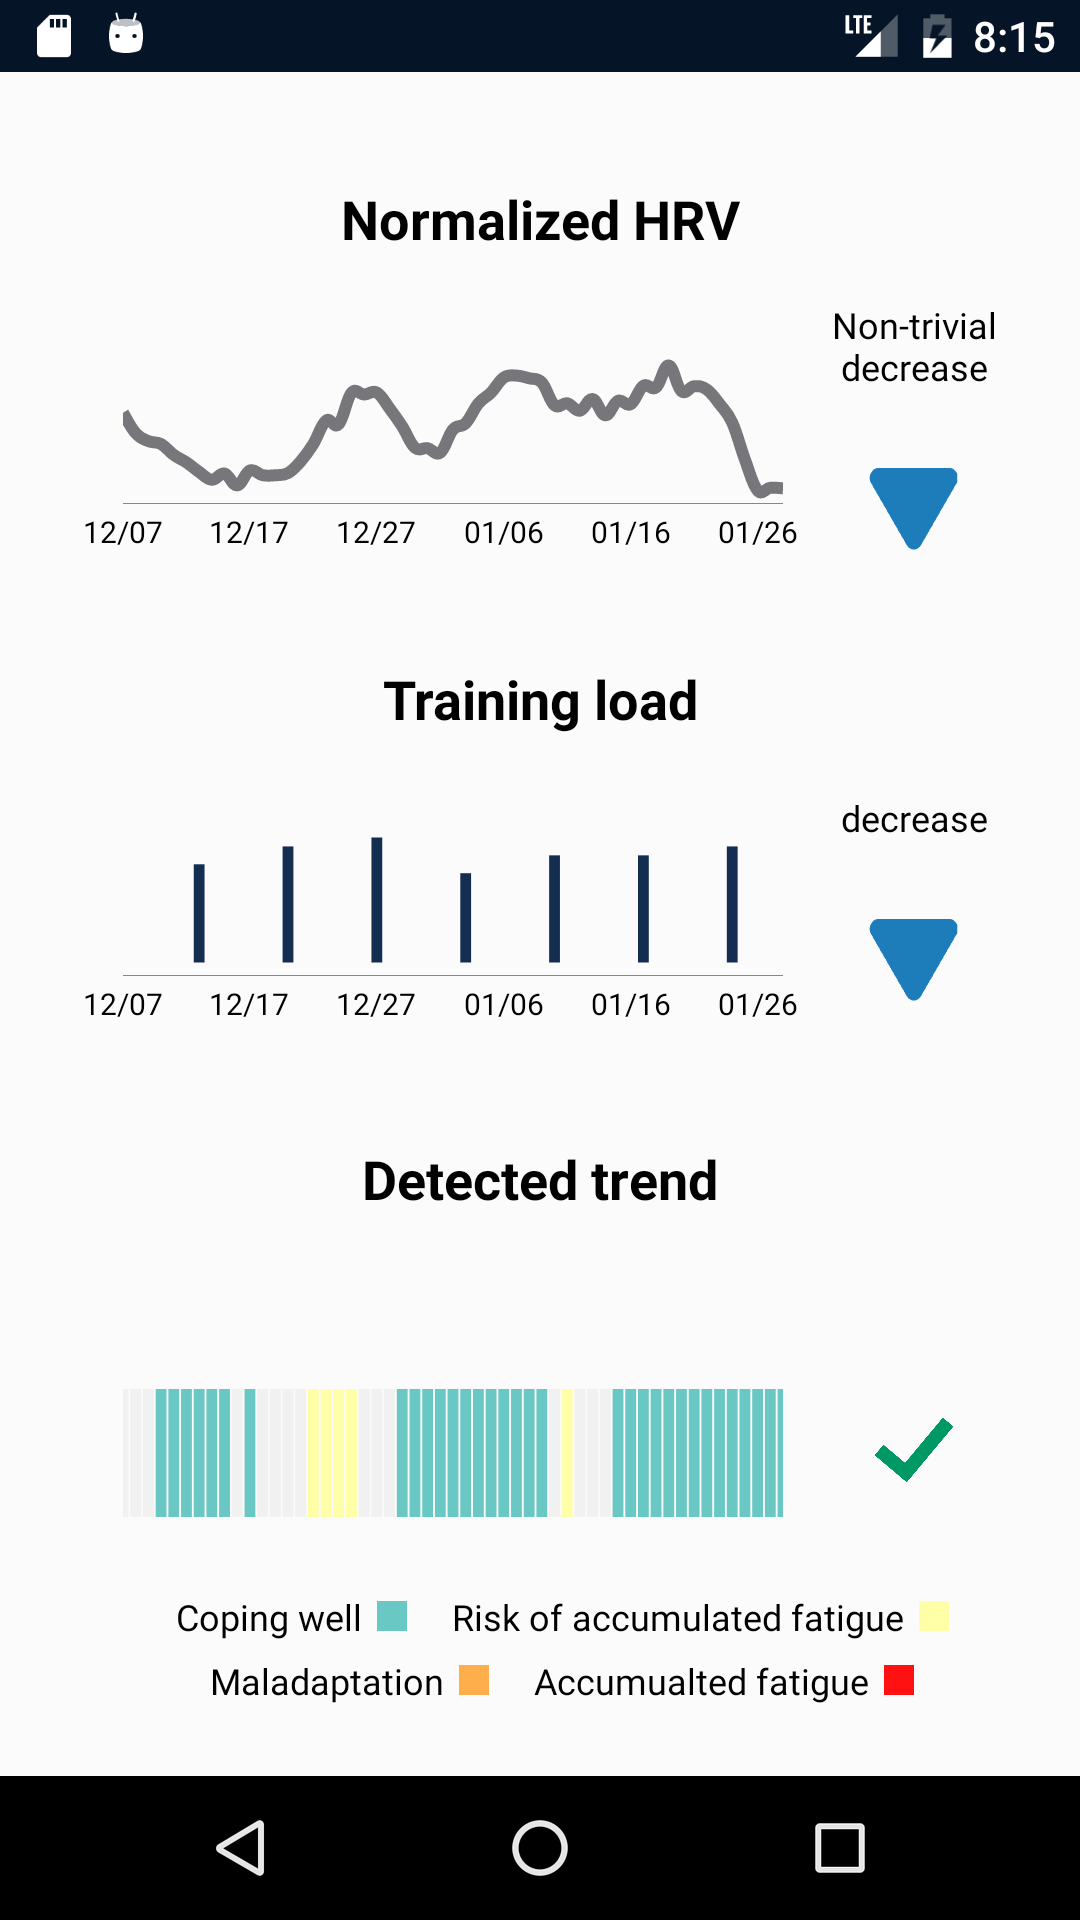
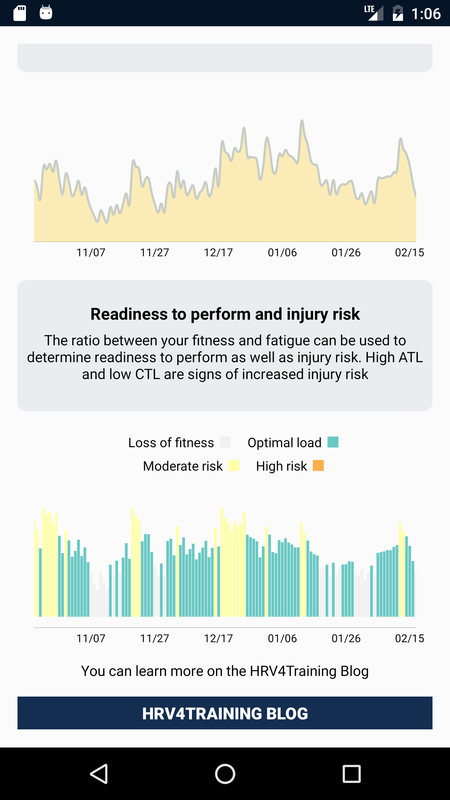
3.5 Training load analysis
HRV4Training lets you pick the metric most representative of your trainings (e.g. TSS, Suffer Score, training distance or your own custom metric) and analyze fitness & fatigue, determined as chronic and acute training loads, as well as readiness to perform and injury risk. You can find out more about this feature at this link.
|
|
|
|
3.6 VO2max estimation
For runners and cyclists using the Strava integration and training with a HR monitor (and power), HRV4Training can estimate cardiorespiratory fitness level (VO2max). Check out this post for more details.
|
|
|
|
3.7 Training polarization analysis
This analysis allows you to get an overview of how hard you are training and potentially polarize more your training, as a more polarized approach, typically involving training about 80% of the time at very low intensities, has been shown to improve performance for both recreational and elite athletes. More details on this analysis at this link.
|
|
|
|
4. Integration with other services
|
Once you authorize the app, HRV4Training can share data with the following apps and services:
|
|