|
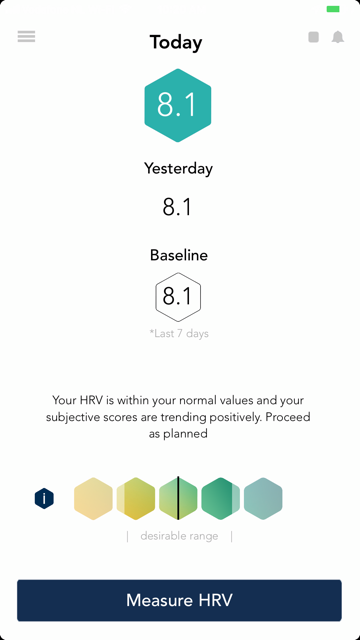
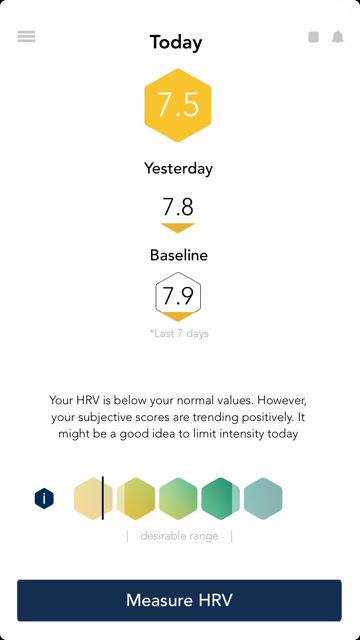
Blog post by Marco Altini In this post, we'd like to talk about the big picture. In particular, on how to interpret your HRV data with respect to your historical data, so that you do not get lost in small irrelevant changes that naturally happen as your physiology is never in the same exact state, and instead you can focus on meaningful, significant changes that might require more attention or simply truly represent positive adaptation to training and other stressors. HRV analysis requires a mindset shift. First of all, we need to understand the nature of the data and the constant re-adjusting of the autonomous nervous system, and therefore take all the necessary steps to acquire a reliable measurement. This is typically addressed by the morning routine: the importance of context, limiting external factors, measuring as soon as you wake up and in the same body position every day. Secondly, we need to shift from a “higher is better” to a “normal is better” mentality, as physiologically speaking, being in a stable condition is typically a good sign. The inherent variability of HRV measurements is something that your app or software of choice, needs to deal with. This is something we have spent a lot of time researching and designing in HRV4Training, starting with the way the daily advice is built. A software that interprets any HRV increase as a good sign, or any HRV decrease as a bad sign, is failing to correctly represent the fact that there are normal variations in physiology, and that only variations outside of this normal range, should trigger concern or more attention or simply be interpreted as actual changes. What are your normal values and how should you use them?Scientists typically talk about the Smallest Worthwhile Change (SWC). What’s the SWC? We talk about the SWC when we want to identify changes in a metric that are not only due to chance or some confounding factor, but are a true representation of an underlying change in performance or adaptation in your physiology. If your HRV differs one day from the other, or even in terms of repeated measurements within a few minutes (especially in this case), it could be that such change is simply due to normal variations in physiology, and a small decrease or increase, is completely irrelevant. What the measurement is telling you is that it’s all normal. This is why in HRV4Training we call the SWC “normal values”, as this is a range determined using your historical data and highlighting what changes in HRV are simply normal due to the nature of a parameter that is always changing a bit, and what changes in HRV are significant. For example, a score that is below your SWC or normal values, clearly highlights higher stress and the need for recovery. A number that is on the other hand just a little lower than your previous score, means absolutely nothing, and you should not be overthinking it. Normal values in HRV4TrainingThe appThe HRV4Training app does the math for you. We deal with day to day variations and the fact that physiology is often changing by learning what variations are normal in your specific case, and building a model relying on the past 60 days of measurements so that only significant changes will be interpreted as such, when providing daily advice for your workouts. In the app homescreen, we always provide a message and a visualization telling you where your daily score stands, with respect to your normal values. The daily advice, which combines this information with your subjective scores, is also reported in the small dots in the History page:
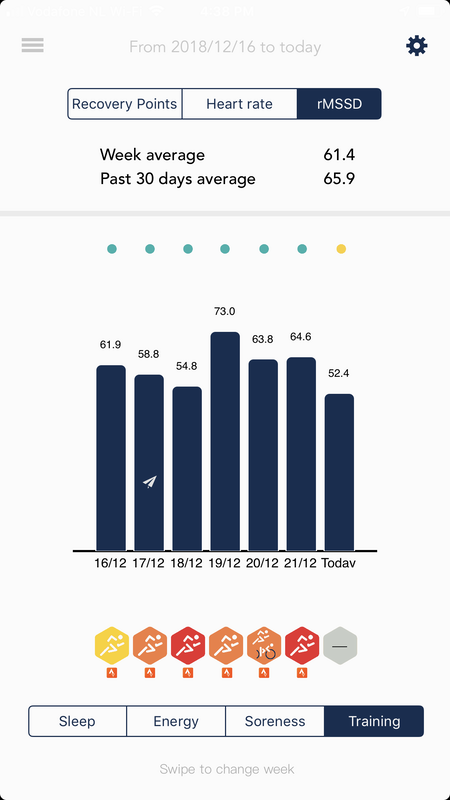
An example of daily score (Today), and relation between the daily score and a person's historical data (bottom image, showing the desirable range, or normal values, basically where we expect the score to be unless there are significant changes due to higher stress, positive adaptation or other). The third figure shows a summary of the daily advice, which is normally color-coded in the homescreen, as reported in the History page, above the measurement bars. Taking it to the next level in HRV4Training ProAs explained elsewhere, focusing on your historical data and normal values, so that we can go beyond day to day variability, was one of the principles behind the development of HRV4Training Pro. HRV4Training Pro builds on our previous work on physiological trends to easily highlight how your baseline is changing with respect to your historical data and allow you to understand if variations are just normal or are consistently outside of your normal ranges, at a glance. In this case, we want to shift even more from daily scores to medium and long term trends, hence the normal values are a slightly narrower range, and what we look at, is where the baseline - instead of the daily score - stands with respect to your normal values. A baseline drifting towards the bottom or outside the normal values, highlights periods of significantly higher stress where recovery should be prioritized. On the contrary, a baseline going above the normal range on a period of higher training load, is typically a sign of positive adaptation to training. 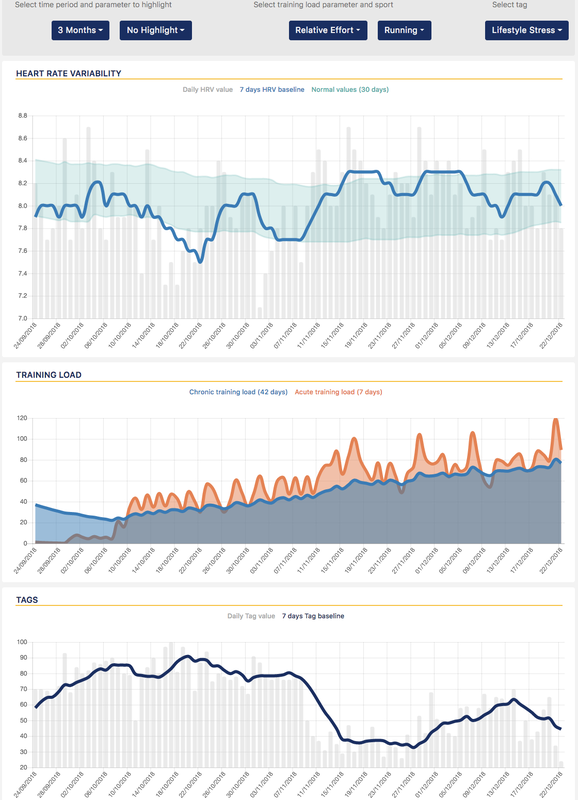 An example of normal ranges (greenish bar) and baseline (blue bar) changes over time. Periods of significantly higher stress can be spotted easily as they end up below the lower bound of the normal ranges, while variations within the green band are most likely just due to normal variability in physiology on a day to day basis. In particular, this is my data and it can be seen quite obviously how very high stress that was not training related caused a significant reduction in HRV, for several days, until my baseline ended up way below my normal values. As this period finally passed (shown in the third plot where I subjectively reported my "life stress"), I was also increasing consistently my training load. In the second part of the plots we can see how my body was showing the typical positive adaptations to high training load described by Dan Plews in his blog post linked above. Finally, things settled back within my normal range. SummaryThe main point that I have been trying to make is that context and your historical data are key for data analysis and interpretation. The software you decide to use needs to be able to contextualize your measurement with respect to your historical data, so that you can easily determine if a score is within your SWC or normal values, or if it is not and you should pay a little more attention to it, potentially implementing changes in your planned training. HRV4Training and HRV4Training Pro provide very intuitive visualizations of your historical data, that we hope can make it easier to correctly interpret physiological changes for you and your team. Note that all that has been discussed is completely independent from your interest in training, regardless of the application of interest, HRV data must always be interpreted and analyzed with respect to a person's historical data and normal values, otherwise it is hardly possible to understand if a change is significant or it is simply a normal variation in physiology. We hope you'll find this post and our visualizations useful to better understand physiological adaptations to training and lifestyle. 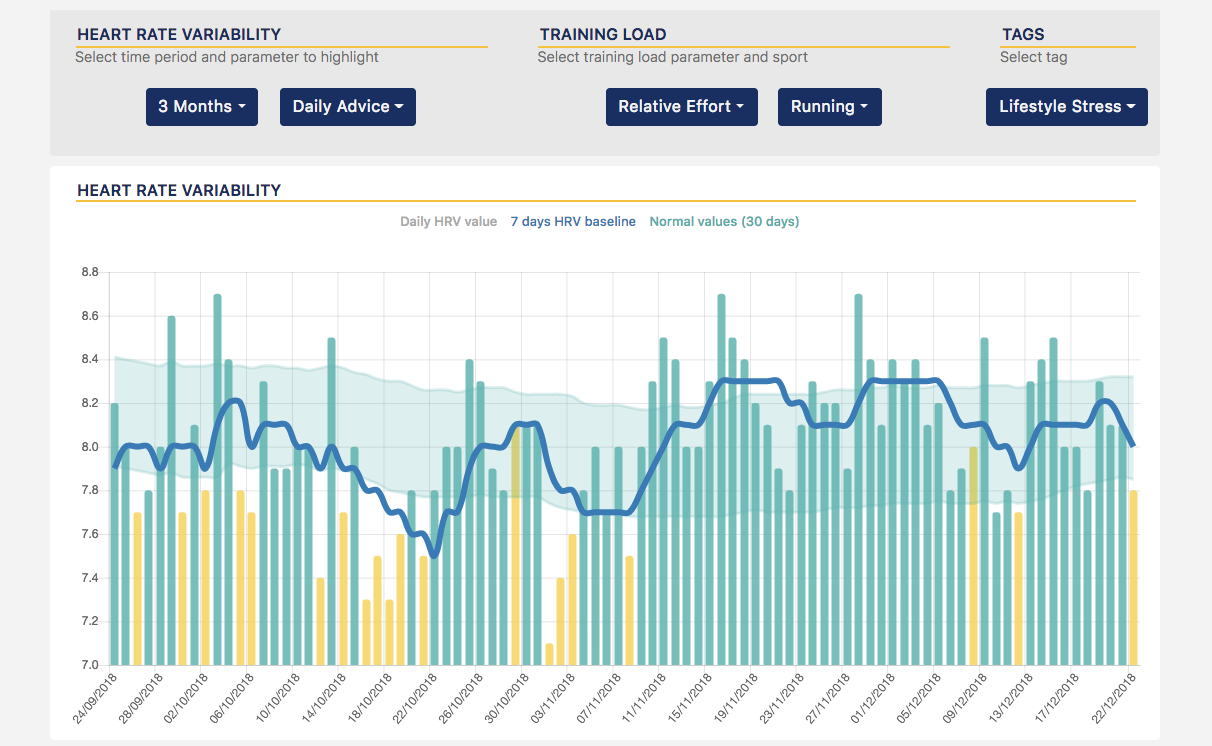 The color-coded daily advice can also be highlighted in HRV4Training Pro, so that you can see what was the app advice with respect to your normal values, baseline and daily scores. As expected during higher stress I got quite a few yellow lights (caution), while positive adaptation to the higher training load was consistently in the green (all good). Haven't tried HRV4Training Pro yet?You can try HRV4Training Pro by logging in with your credentials here and get 20% off until end of the year using referral code bigpicture Useful linksComments are closed.
|


Register to the mailing list
and try the HRV4Training app! 
|