|
Blog post by Marco Altini Recently we have talked a lot about normal values and the big picture (here), how to use deviations from normal values to guide training (here) and the importance of looking not only at baseline HRV with respect to normal values, but also the coefficient of variation (here). In this post, we show how you can easily analyze your data and look at the big picture, using the Overview page in HRV4Training Pro. In particular, we'll look at:
You can try HRV4Training Pro at HRV4T.com and get 15% off using promo code BIGPICTURE Baseline and normal valuesWhen you login in Pro, tap the Overview button in the top bar, and you'll get this view: 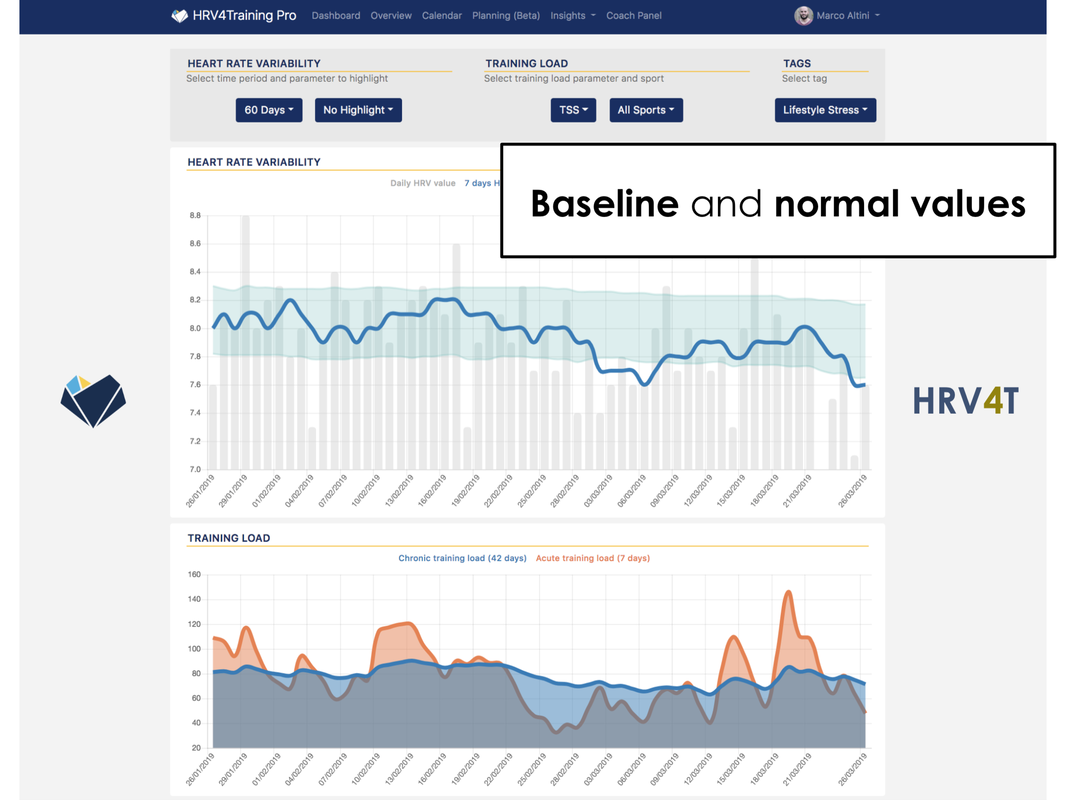 In this page you can analyze your physiological data focusing on the big picture, instead of day to day variability. In particular, the top plots shows your HRV baseline, depicted in light blue, with respect to your normal values. Periods of higher or lower physiological stress can be easily highlighted when the baseline moves below or above your normal values. Normal values are computed based on your historical data, in particular as one standard deviation from your mean HRV, using always the previous 60 days of data: 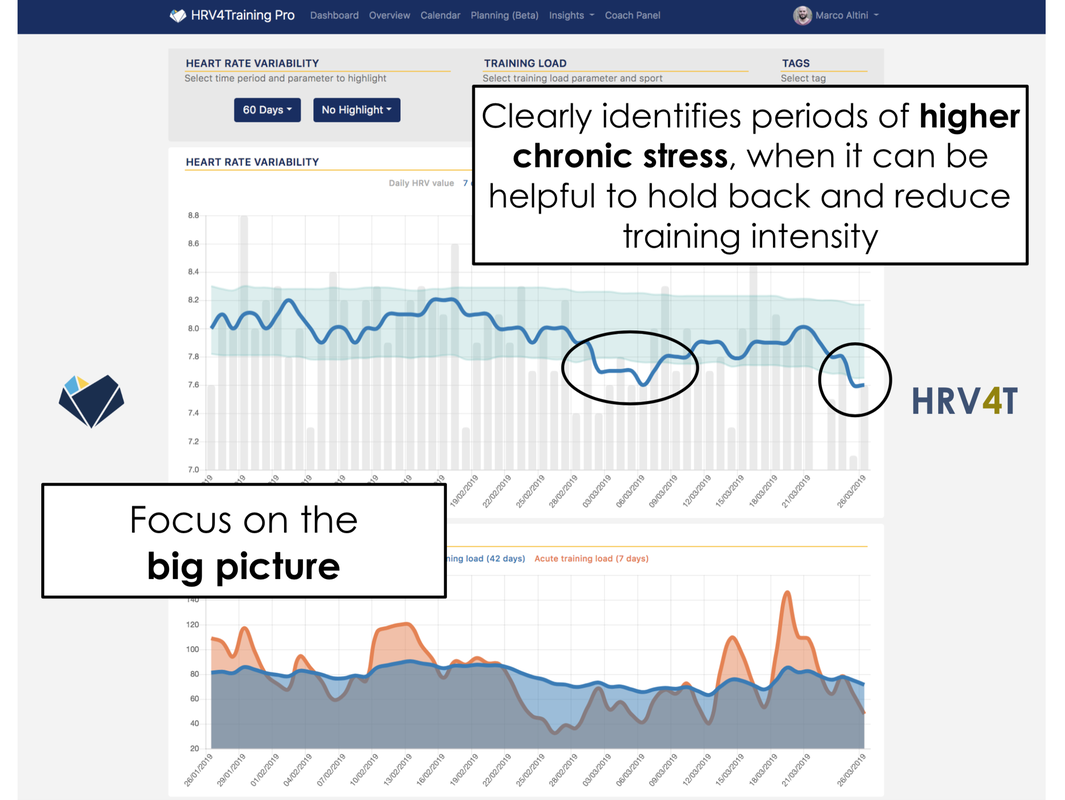 Context: training load and subjective dataThe second and third plot provide more context, allowing you to display data related to training load and other tags you might be annotating in the morning after the measurement. Here is a training load example, showing positive adaptation to an increased load (baseline stays within normal values and even increases a bit): 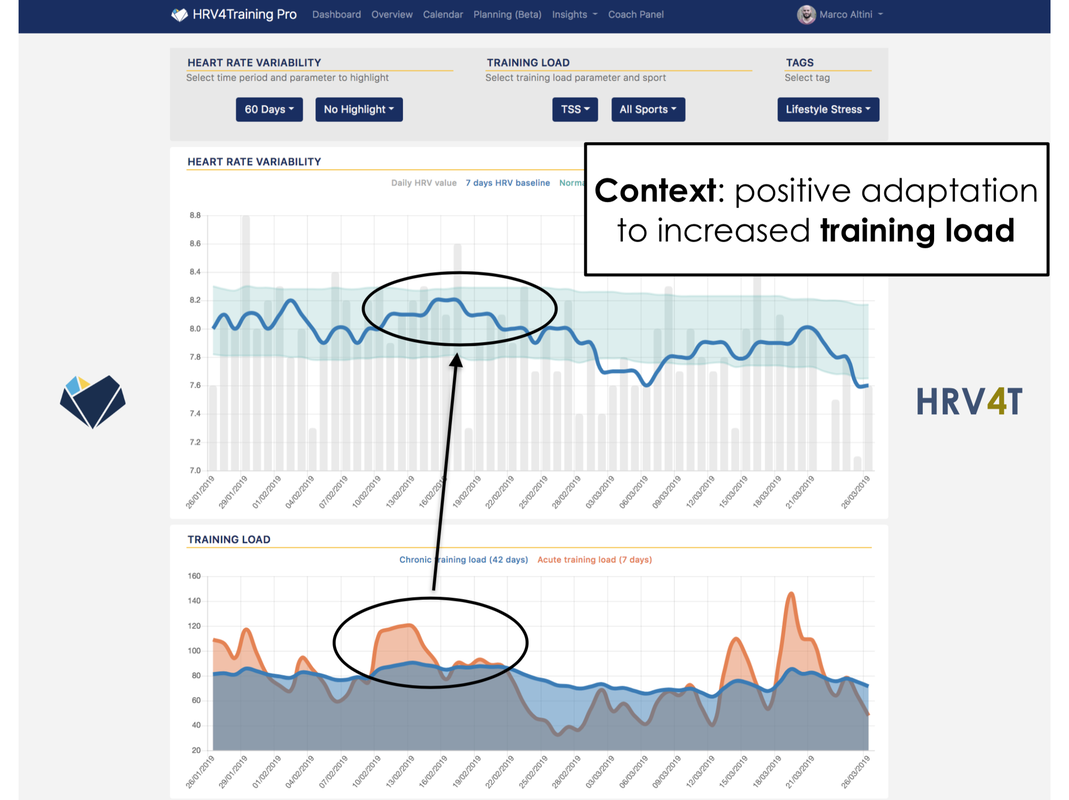 And here is an example where we have chronic physiological stress unrelated to training, but due to poor sleep: 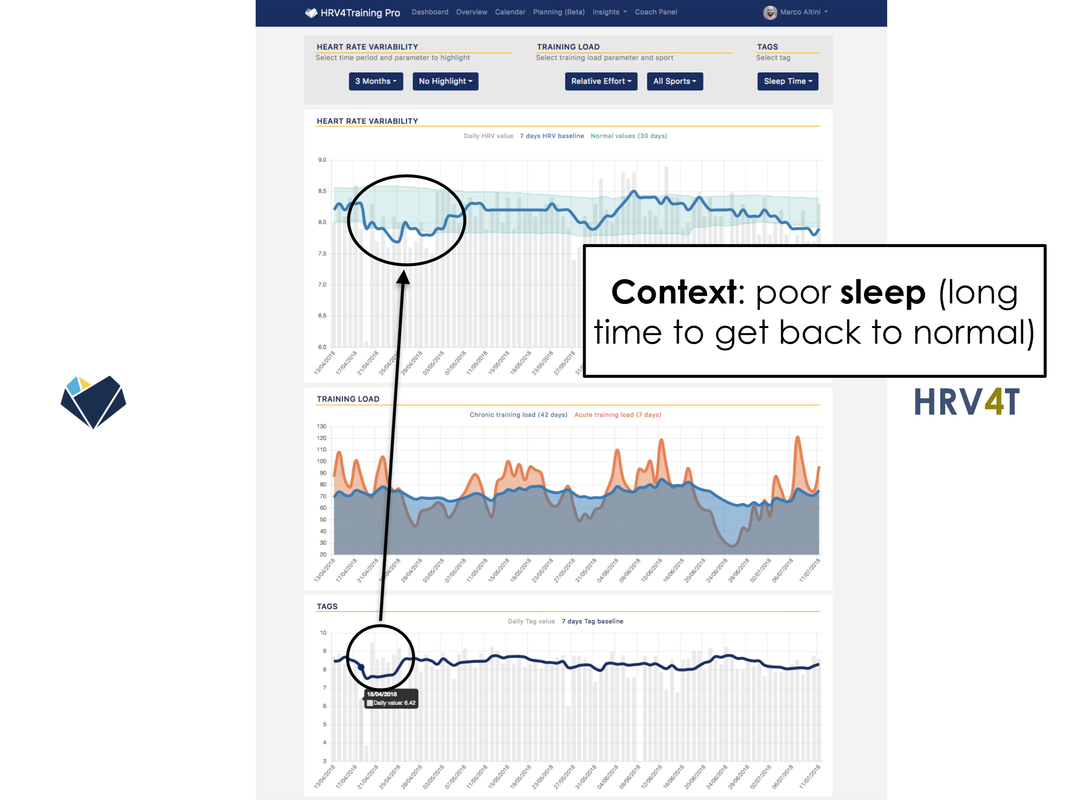 You can also highlight your daily scores to show more contextual information, for example traveling days, alcohol intake, menstruation, etc (not shown here). Coefficient of Variation (CV) TrendIn our latest HRV4Training Pro update, we have added the possibility to highlight the current trend in your Coefficient of Variation (CV), directly in the Overview page, so that you can see at the same time your baseline with respect to normal values, as well as how the CV is trending (stable, increase or decrease). See an example below: 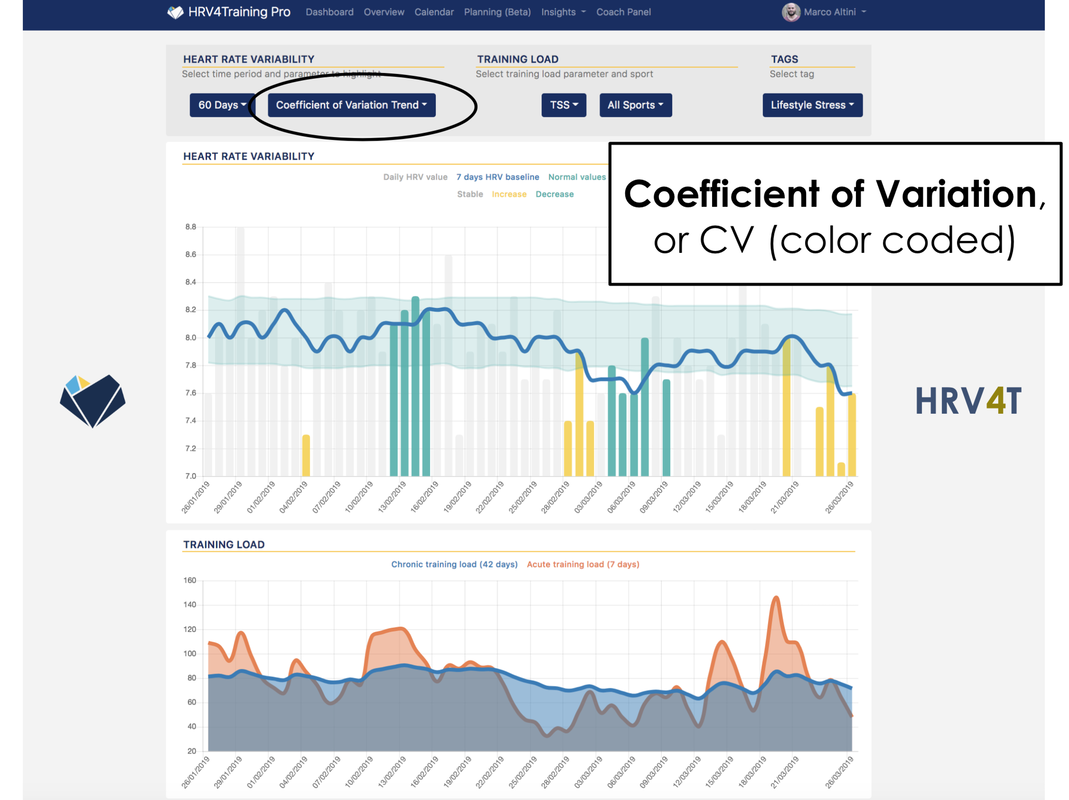 Why is this important? The amount of day to day variability (the CV), combined with baseline changes with respect to normal values, can provide additional insights on adaptation to training and other stressors. A reduced CV is often associated with coping well with training. What we are measuring is how we are responding to a workout or block of workouts, with certain trends (stable or upwards HRV, reduced CV) being indicative of good adaptation, even in periods of very high load. This means also that the opposite trends, reductions in HRV or larger fluctuations in CV are signs of poor adaptation and should trigger changes in training. 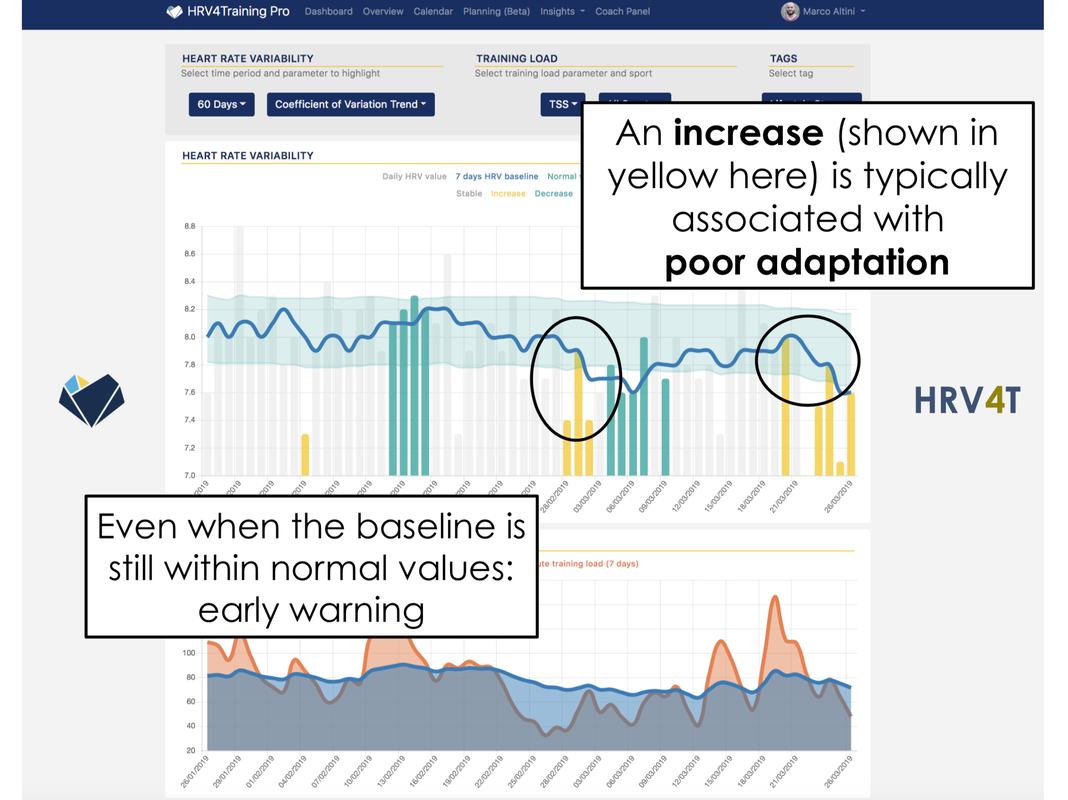 Is a decrease in CV always representative of positive adaptation? Research has shown that this is not the case, for example if we have a very low baseline (below our normal values), and our CV is also low, it is likely that our physiology is not responsive to any stimulus, due to a highly fatigued state: 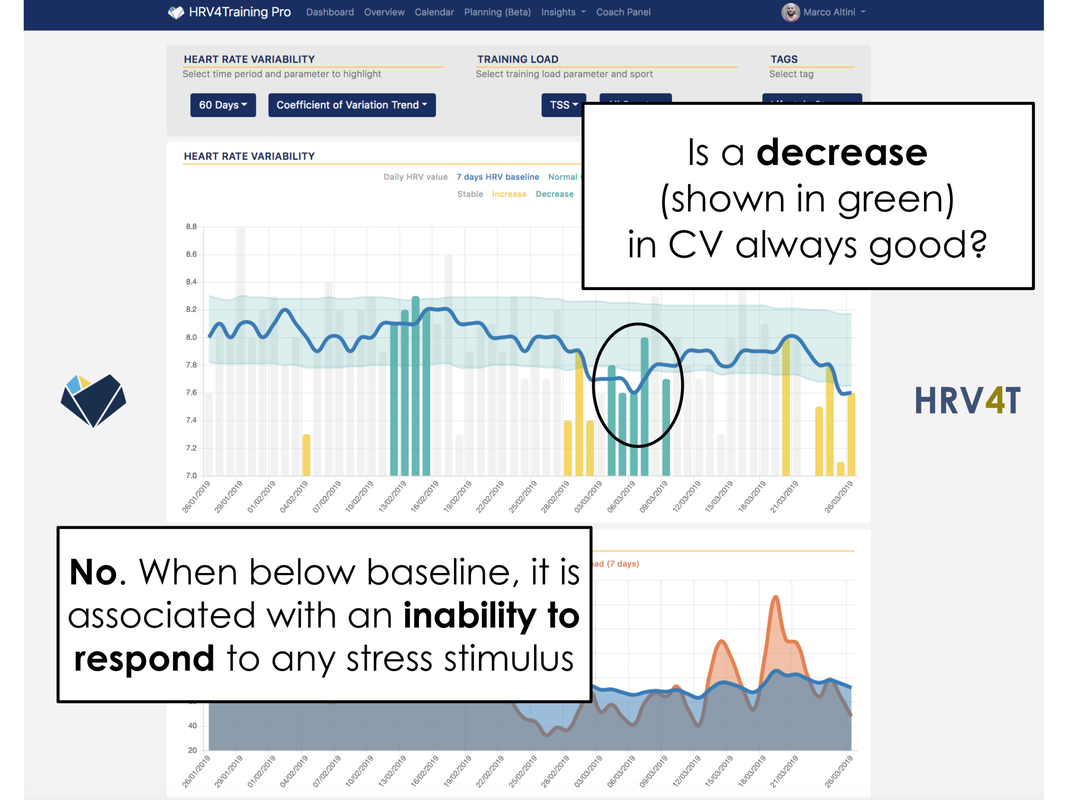 Automatic trend detectionWhile we have added the CV trend in the view just described, you do not really need to do the math yourself, as this analysis is present in HRV4Training. In particular, HRV4Training can automatically determine how you are coping with your training load by combining heart rate variability, heart rate, Coefficient of Variation and training information. The detected trend is one of the following: coping well with training, being in a stable condition, risk of maladaptation or accumulated fatigue. You can overlay the trend detection analysis with your normal values as well, so that you can get a better overview of not only your physiological data with respect to normal values, but also the detected trend based on a combination of baseline HRV, heart rate and coefficient of variation, contextualized by training load. 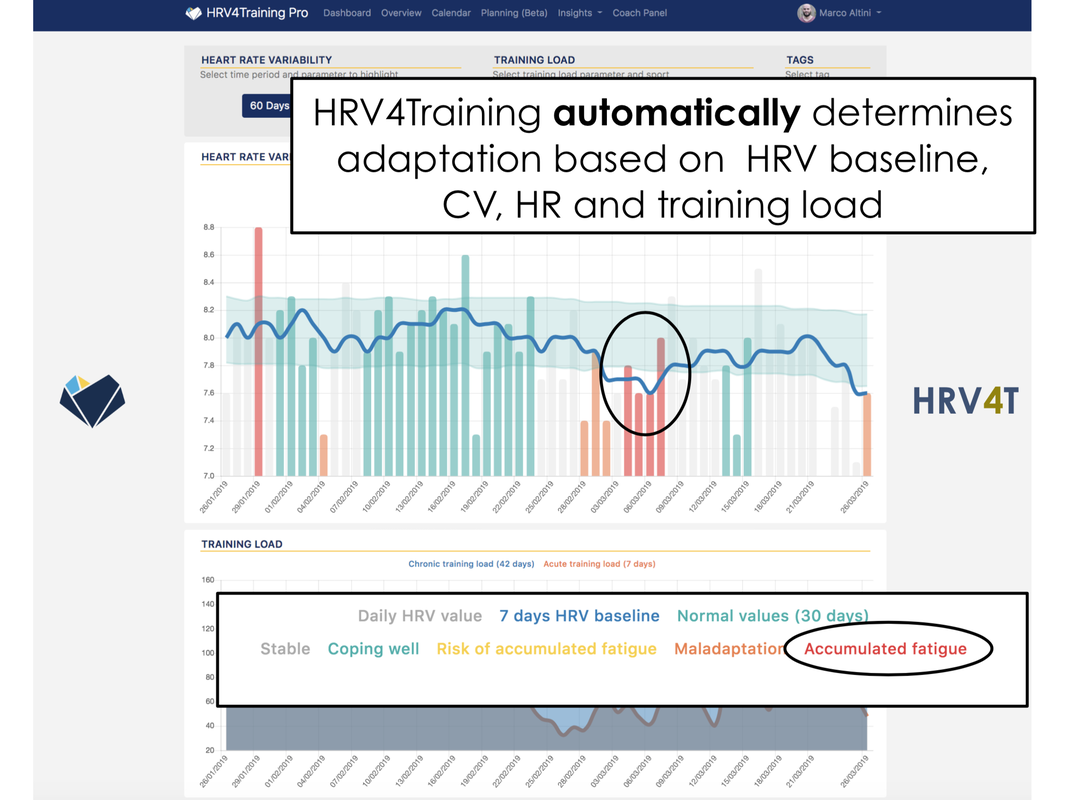 Try HRV4Training ProWe hope you will find the latest features in Pro useful to better understand physiological responses to training and lifestyle stressors.
You can try HRV4Training Pro at HRV4T.com and get 15% off using promo code BIGPICTURE Enjoy. Comments are closed.
|


Register to the mailing list
and try the HRV4Training app! 
|