|
Blog post by Marco Altini As previously reported we have added support for Samsung Galaxy's dedicated sensor. The dedicated sensor is typically found next to the camera on the back side of phones such as the S7-S10, and is a sensor you can use rather than a cheststrap or the actual camera. The advantage is that this sensor is designed to measure PPG, and therefore should allow you to obtain high quality data with high reliability, provided that PPG data is processed with accurate algorithms able to filter the data, clean it from artefacts, determine the location of peaks in the PPG signal, and then compute HRV from these peak to peak differences. The procedure we employ in HRV4Training has already been validated and is detailed in this blog post and also covered in this paper.
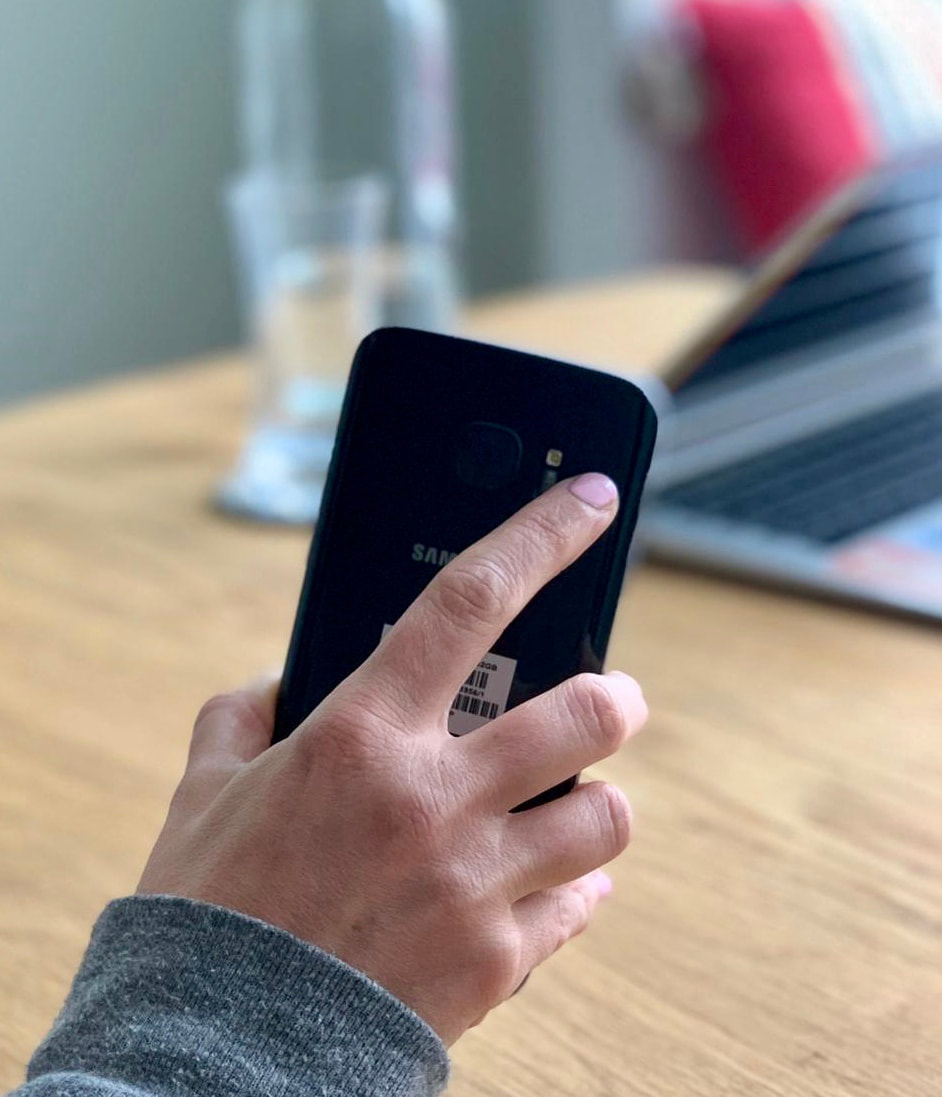
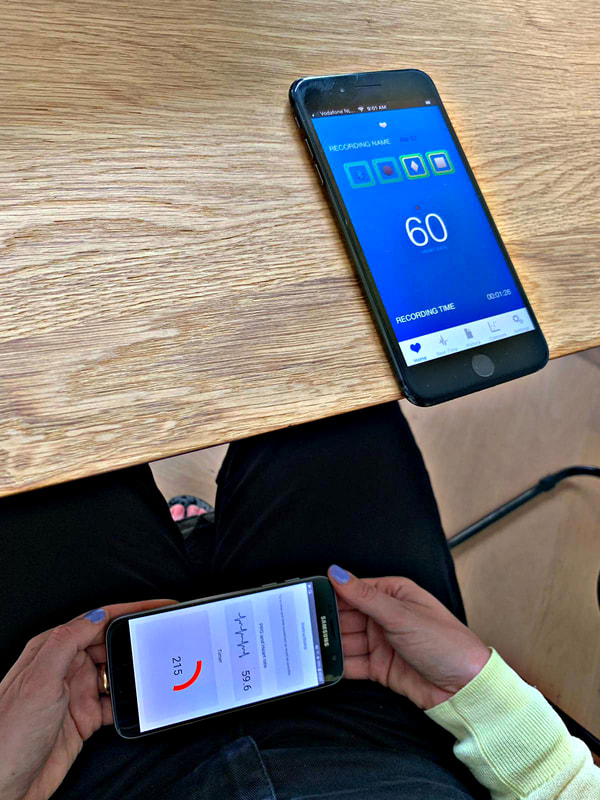
In this post, we'll show a few minutes of data collected under different conditions, highlighting how the dedicated sensor combined with our algorithms is a very accurate way to detect RR intervals and compute HRV (rMSSD in this analysis). Data collectionData was acquired using the Samsung S7 dedicated PPG sensor and a Polar H7 (previously validated with respect to ECG here), both connected to a different device running the HRV Logger app and Camera HRV app for Android, which are apps that simply record everything coming from the sensor plus additional features. During data acquisition, we collected data a few minutes while breathing freely, and a few minutes while deep breathing, to elicitate higher HRV due to RSA. You will see in the plots below visually the effect of deep breathing as we get greater swings in RR intervals. A final note on data synchronization: data cannot be perfectly synchronized because it is not timestamped by the sensors. What we can do is either to log real time and then to split data in windows based on when data was collected, then compute HRV features on these windows or to sum up RR intervals over time. For this analysis we went with the second option and also tried to visually align the data streams.
RR intervalsWe will start by looking at RR intervals, the basic unit we need to compute HRV features. RR intervals (peak to peak differences in consecutive heart beats) are provided by the Polar chest strap directly, so we don't really need to do much to collect them from Polar's sensor, apart from linking the sensor to the HRV Logger app and export the csv files. For Samsung's dedicated sensor, things are a bit more complex as the only data stream provided is the raw PPG, hence we need to run our pipeline shown above, to filter the data, find peaks, and finally compute RR intervals. This procedure is all implemented in HRV4Training and Camera HRV, and the RR intervals can also be exported in Camera HRV, which is what is show below: 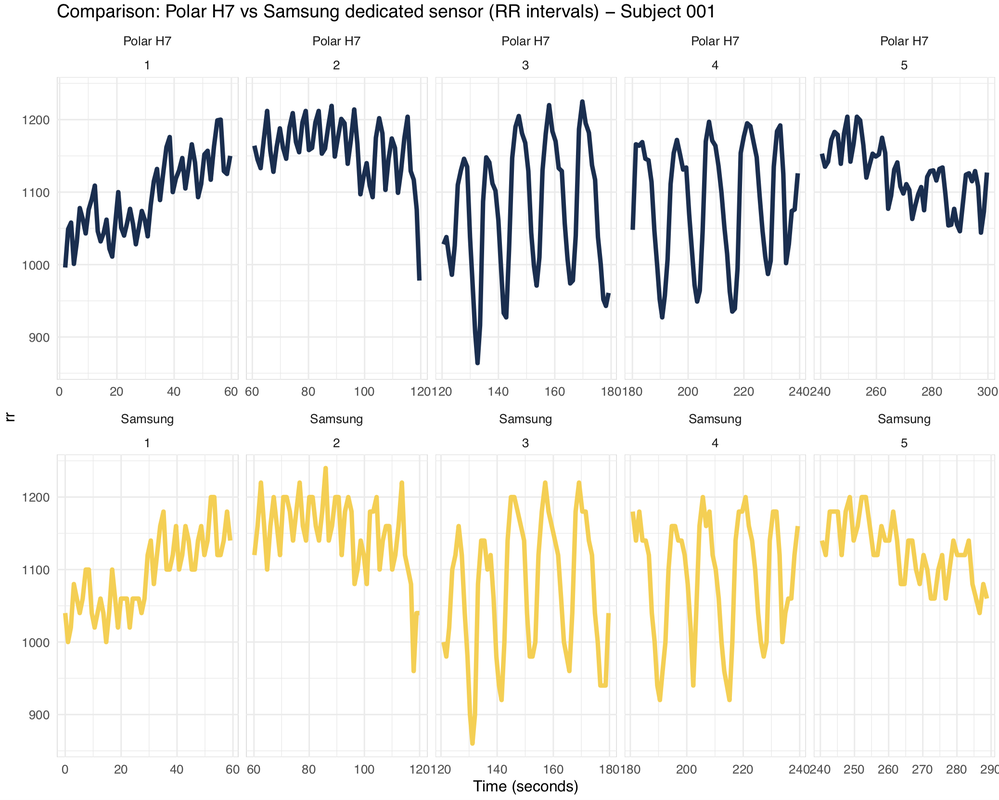 What can we derive from these data? You can see clearly almost perfect correlation between Polar H7 and RR intervals extracted combining Samsung's dedicated PPG sensor and our peak detection algorithms, for all conditions (relaxed vs paced breathing as highlighted by bigger oscillations in RR intervals or instantaneous heart rate during minutes 3 and 4), meaning that the sensor works really well in this modality. Heart rate variability: rMSSDAs features, we will look only at rMSSD, the only feature we really care about. rMSSD is a clear marker of parasympathetic activity and the main feature we use for our analysis in HRV4Training, similarly to what other apps do as well. Additionally, the sports science community seems to have settled on this feature for several reasons (practical as well as it is easy to acquire, compute and reliable over short time windows and less controlled conditions), and therefore we'll stick to it. What we expect given the data above is to see extremely close values between the Polar H7 chest strap and Samsung's data. For the plot below, I computed rMSSD for each time window (60 seconds in this case) and two people with very different baseline HRV, so that you can see how the sensor behaves in both cases: 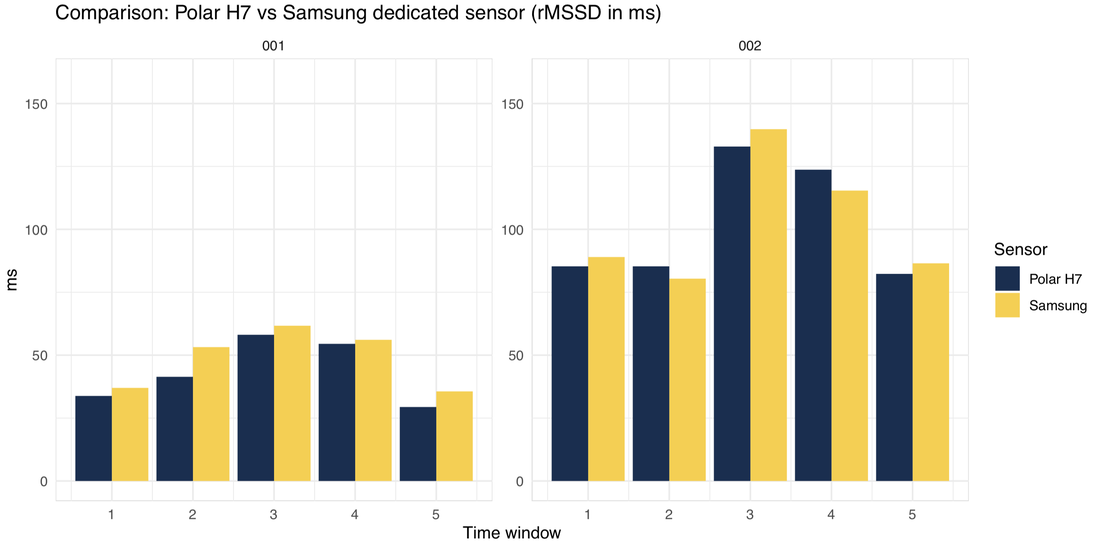 Results are extremely good considering normal variation in physiology and limitations in data synchronization. We can see how for both individuals minutes 3 and 4 show the highest HRV, artificially increased by deep breathing, and how rMSSD is very similar in minutes 1-2 and 5, during regular self-paced breathing. Subject 2 is able to elicit much greater oscillation during paced breathing, with respect to subject one, and both sensors report the same output. Summary and other useful resourcesThat's all for this post. We are very pleased to see a major mobile phone manufacturer providing access to verified developers to data streams such as PPG which can be used to enrich the functionality of the phone without sacrificing accuracy with respect to using external sensors.
We hope that more will come in the future, making it easier for you to gather reliable data. Some additional resources on sensors and measurements:
And some useful link on making use of the data to better understand how we are responding to training and lifestyle stressors, so that we can improve our decision making process towards better performance (or simply a more balanced lifestyle!): Comments are closed.
|


Register to the mailing list
and try the HRV4Training app! 
|