|
Blog post by Marco Altini [data, code and plots used in this blog post are available on github, at this link] In early 2016 I answered to a question on Quora on wrist based HRV sensors. The answer was read about 6000 times as of mid 2017, which feels like a decent amount of interest for an obscure platform and a niche topic. I've been updating the answer over time as we've tested more wrist based sensors with the ability to provide RR intervals or raw PPG data, however none of them was up to the standards required by the sports science industry until now. With the Zoom HRV wrist based sensor, developed by LifeTrak (it's about 139 USD on Amazon), we finally have a device that is able to measure HRV from the wrist reliably and also comply to standard protocols so that you can use it with your favorite apps, just like a chest strap. Before we start looking at the data, I'd like to list what we'll be focusing on with this post, as there are many aspects to possibly discuss, and we will cover only a few. In particular, we'll cover:
We will not be discussing the software platform around this device and other functionalities. In particular, this is not a review of the Zoom HRV device, this blog post serves only as a validation of the basic ability of the device to measure RR intervals and as a discussion around other points I consider valuable (standards, type of measurements). We leave it up to others to evaluate the user interface, usability, effectiveness of the additional features built on top of the basic measure. It would make little sense for us to comment as this is supposedly a 'competitor product'. Why we picked this device and why we believe complying to standards is key to be taken seriously in this businessThe Zoom HRV device is not the only one claiming accurate HRV analysis from the wrist. The reason why we choose this one is that it's basically the only one that complies to standard protocols, capturing RR intervals (beat to beat differences used to calculate HRV) and sending them via the standard bluetooth 4.0 heart rate protocol. Why is this important? Unfortunately most sensors are either locked behind proprietary software / apps or providing only custom metrics, hence they cannot be evaluated in their ability to do what they claim (can they actually measure HRV?), and they cannot be used by other apps. In our view, wrist based sensors should be just like chest straps, complying to standard protocols, cost effective, allowing users to pick the one they want and use them with different apps, for both working out (Strava, Polar flow, ecc.) and HRV analysis (HRV4Training, Elite HRV, etc). The only product today on the market that seems to have understood this, is the Zoom HRV wristband by LifeTrak, which does offer also an app and a series of additional tools should you be interested in using their platform, but it does not preclude you from using the device with other apps. This seems to me a smart choice, as more people might be interested in buying your hardware even if they don't care about your software solution (as I did myself). 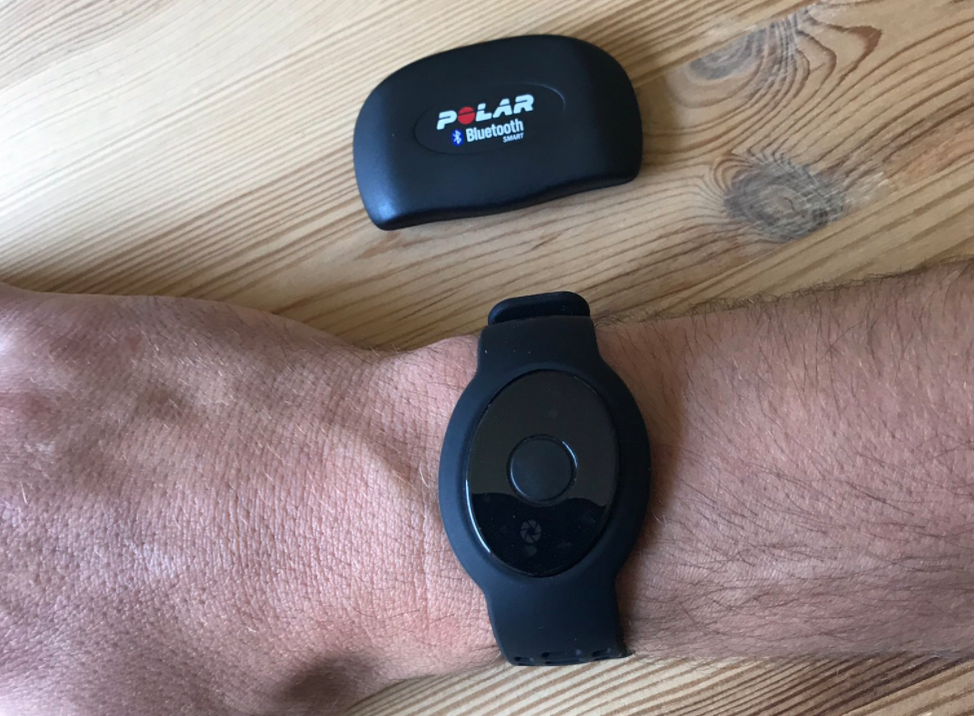 How accurate is the Zoom HRV device in detecting individual beats used to compute HRV features such as rMSSDAs we've shown in the past, the fact that some sensors send RR intervals, does not mean that the RR intervals are accurate and can be used for HRV analysis. As a matter of fact, most of the times the data are heavily filtered to make sure heart rate is measured correctly (dealing with movement and artifacts is tough), and therefore we loose the accurate beat to beat information that we need to compute HRV reliably. It's simply a different target application, and it is unfortunate that manufacturers do not provide more information to consumers, leading to the wrong assumptions (more on the importance of signal quality metrics, in this post). Note that the same holds for chest straps, sometimes there seem to be the belief that chest straps always work, however this is not true. Chest straps, similarly to wristbands, might have been designed with no attention to accurate beat to beat differences, but only to accurate average heart rate, which is what matters during sports anyway, so always question your chest strap too, especially if no validations have been reported (for example for Garmin this seems to be the case, possibly also Tickr - they might work well, but don't take it for granted). This is also why we keep recommending the Polar H7, that we validated against ECG, the real reference system for these applications. Data acquisition setup & measurement protocolEnough with the explanations, let's look at some data. Data was acquired using a Polar H7 as reference, connected to an iPhone running the HRV Logger app, which is an app that simply records everything coming from the sensor plus additional features. RR intervals from the Zoom HRV sensor and HRV4Training PPG data were acquired using a custom app that I developed for our clinical validations at the Sports Performance Research Institute in New Zealand (full paper here). This app is not commercially available and can record simultaneously data from the two sensing devices, making it easier to synchronize data (still with some limitations, also described in the paper). During data acquisition, we collected data a few minutes while breathing freely, and a few minutes while deep breathing, to elicitate higher HRV due to RSA. You will see in the plots below visually the effect of deep breathing as we get greater swings in RR intervals. Note that this is not a comprehensive analysis and the HRV range covered is pretty small as I've done tests only myself. As you will see results are pretty good and I have no reason to think the device would behave differently for someone with higher HRV, however more test should be done on a larger population to make sure this is actually the case. What we have here is a preliminary analysis that was already sufficient to dismiss most currently available sensors, but worked very well for the Zoom HRV. A final note on data synchronization: data cannot be perfectly synchronized because it is not timestamped by the sensors. What we can do is either to log real time and then to split data in windows based on when data was collected, then compute HRV features on these windows or to sum up RR intervals over time. Here we went for the first option, you will see signals are not perfectly aligned, but for this analysis this is not a major problem. Data analysisRR intervalsWe will start by looking at RR intervals, the basic unit we need to compute HRV features. RR intervals (peak to peak differences in consecutive heart beats) are provided by all these sensors, so we don't really need to do much to collect them, apart from linking the sensor to the HRV Logger app. For the camera based algorithms, RR intervals are also computed directly in the app and can be exported as csv files (you can do this using the Camera HRV app, in HRV4Training we do not store RR intervals but only features). Here is a free breathing example: 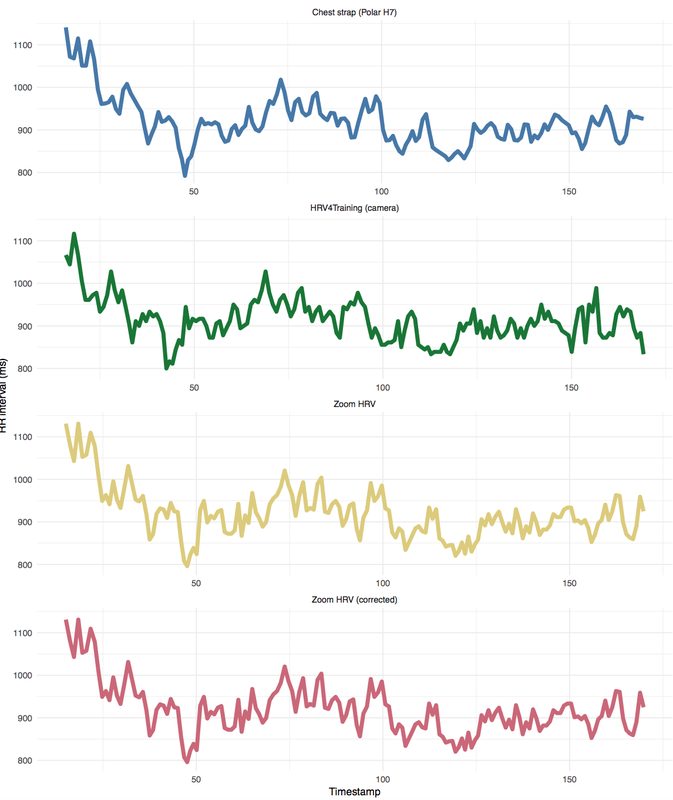 and here is a deep breathing example, where you can see clearly the swings in instantaneous heart rate due to breathing in and out: 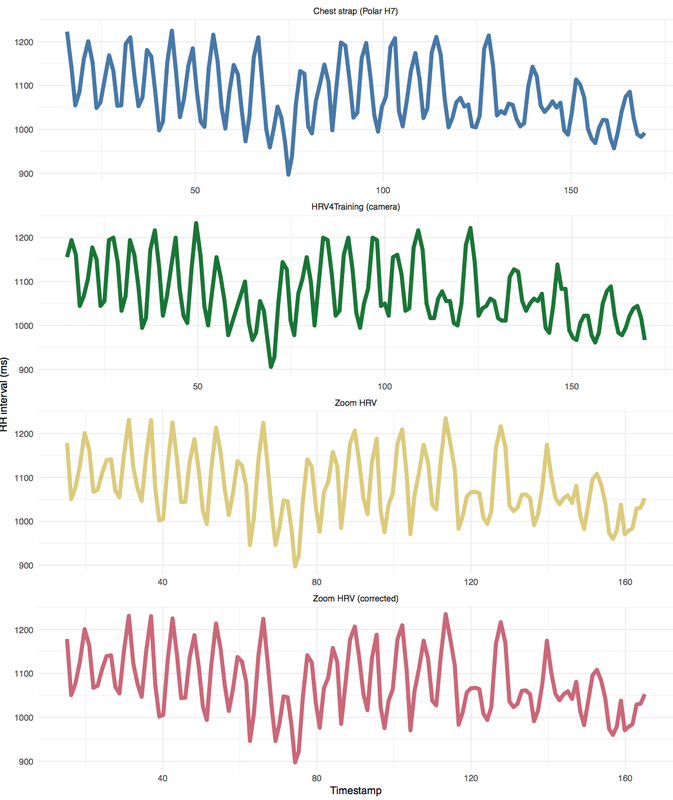 As you can see I've added an additional data stream which I called Zoom HRV corrected. This is a data stream in which I applied a simple RR intervals correction as I've seen a bit too often the device detects some beats out of place, probably just artifacts, as shown below: 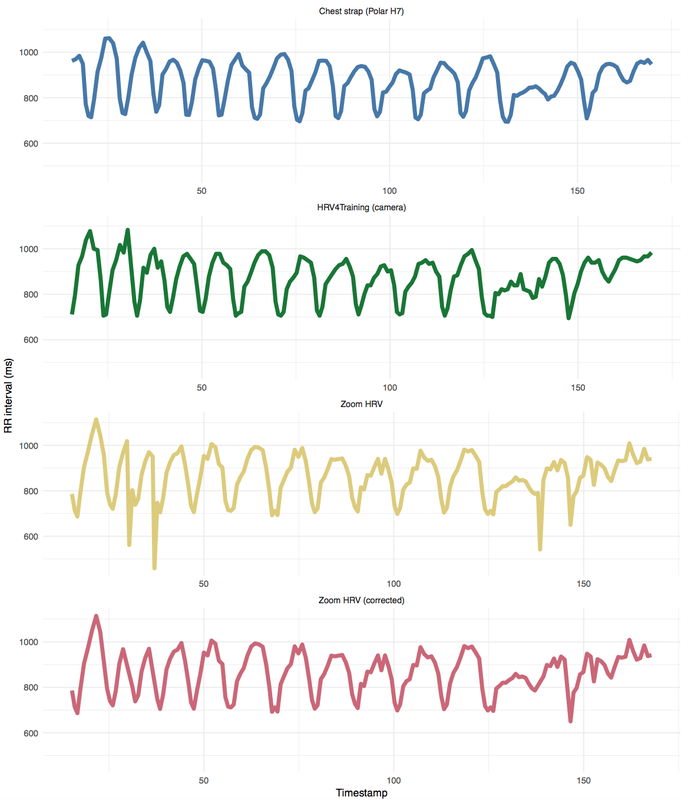 Apart from the easily fixable artifacts, these data looks really good. Check out this blog post for an example of very poor agreement between reference RR intervals and PPG derived RR intervals using other sensors, you'll see easily how the issues that were present in other devices, for example reduced variability due to heavy filtering, are not present in the segments above. Heart rate and HRV features (rMSSD)As features, we will look only at heart rate and rMSSD. rMSSD is a clear marker of parasympathetic activity and the main feature we use for our analysis in HRV4Training, similarly to what other apps do as well. Additionally, the sports science community seems to have settled on this feature for several reasons (practical as well as it is easy to acquire, compute and reliable over short time windows and less controlled conditions), and therefore we'll stick to it. Let's look at heart rate first: 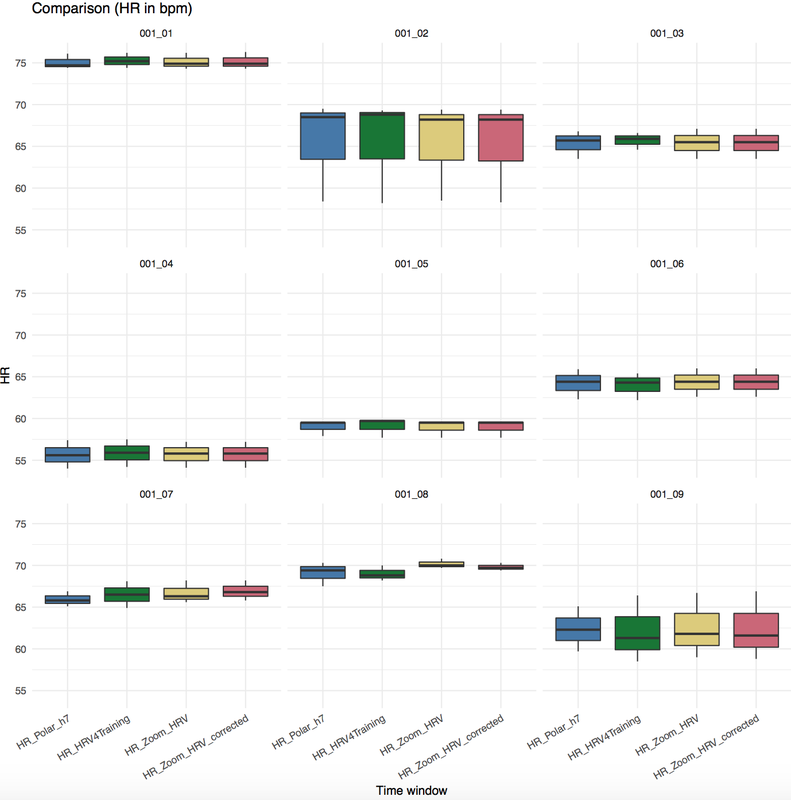 Above we can see one subplot per measurement, each measurement being three minutes of data, with features computed every minute, hence the boxplots since we have 3 data points for each sensor for each measurement. This is a limitation of the Zoom HRV sensor which transmits data in 'RR intervals mode' only for up to 3 minutes. Personally I think this is a good idea as movement would make PPG data completely useless, so at least you are forced to rest, stop for 3 minutes and take your measurement. Below we can see each individual 1 minute measurement, the agreement between the different sensors is extremely high, we do not expect anything different as heart rate is pretty easy to measure, and even all the sensors that we tested in the past and were unable to measure HRV correctly, were still very good at measuring heart rate at rest: 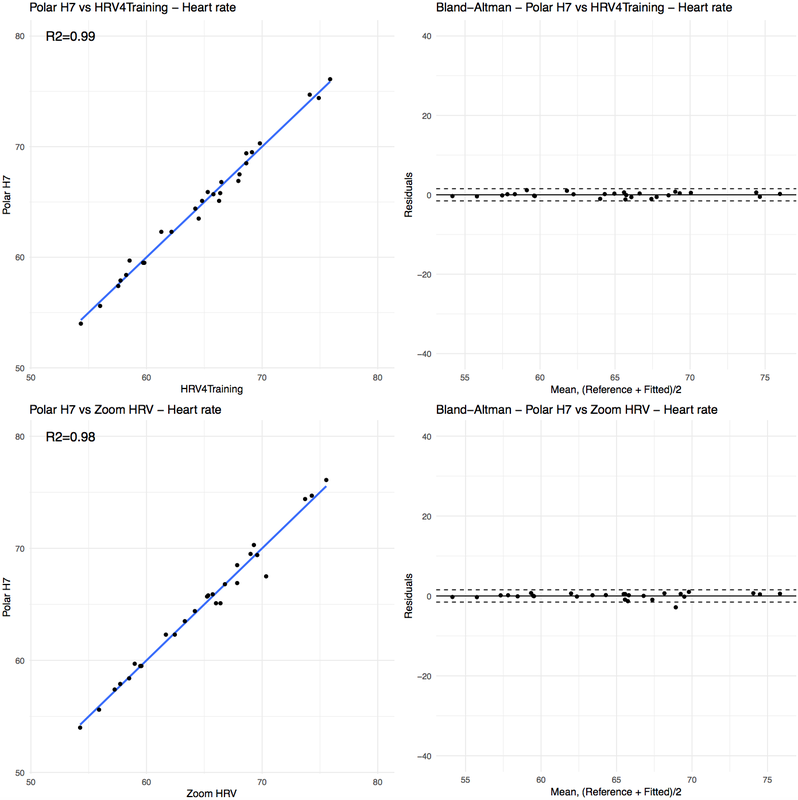 Below we can see results for HRV, so the rMSSD feature in milliseconds: 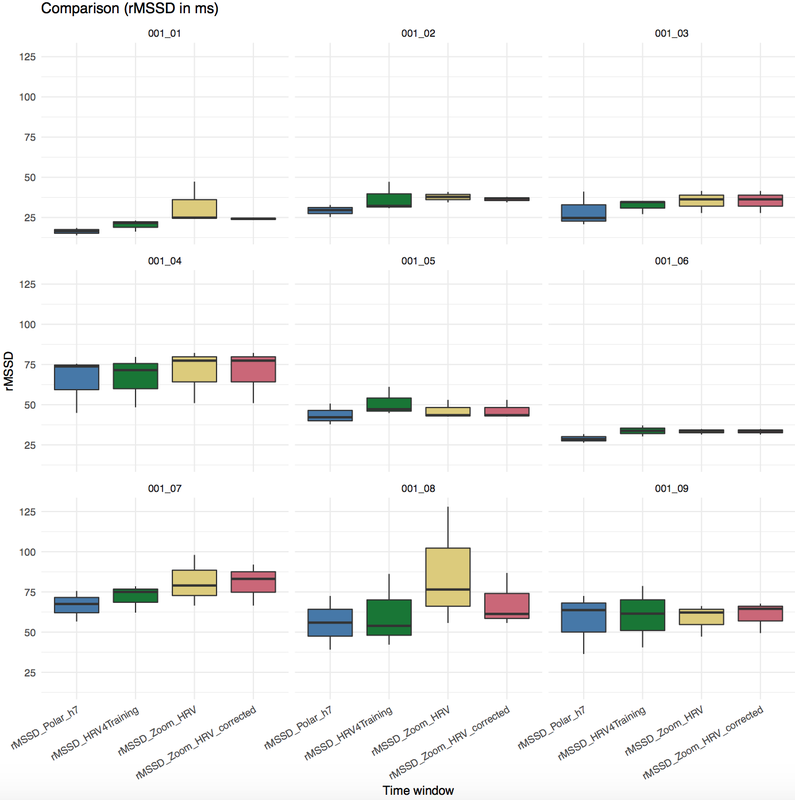 This time we see how the additional artifact correction is really key to get good data out of the Zoom HRV sensor, as the R2 goes from 0.67 to 0.90. 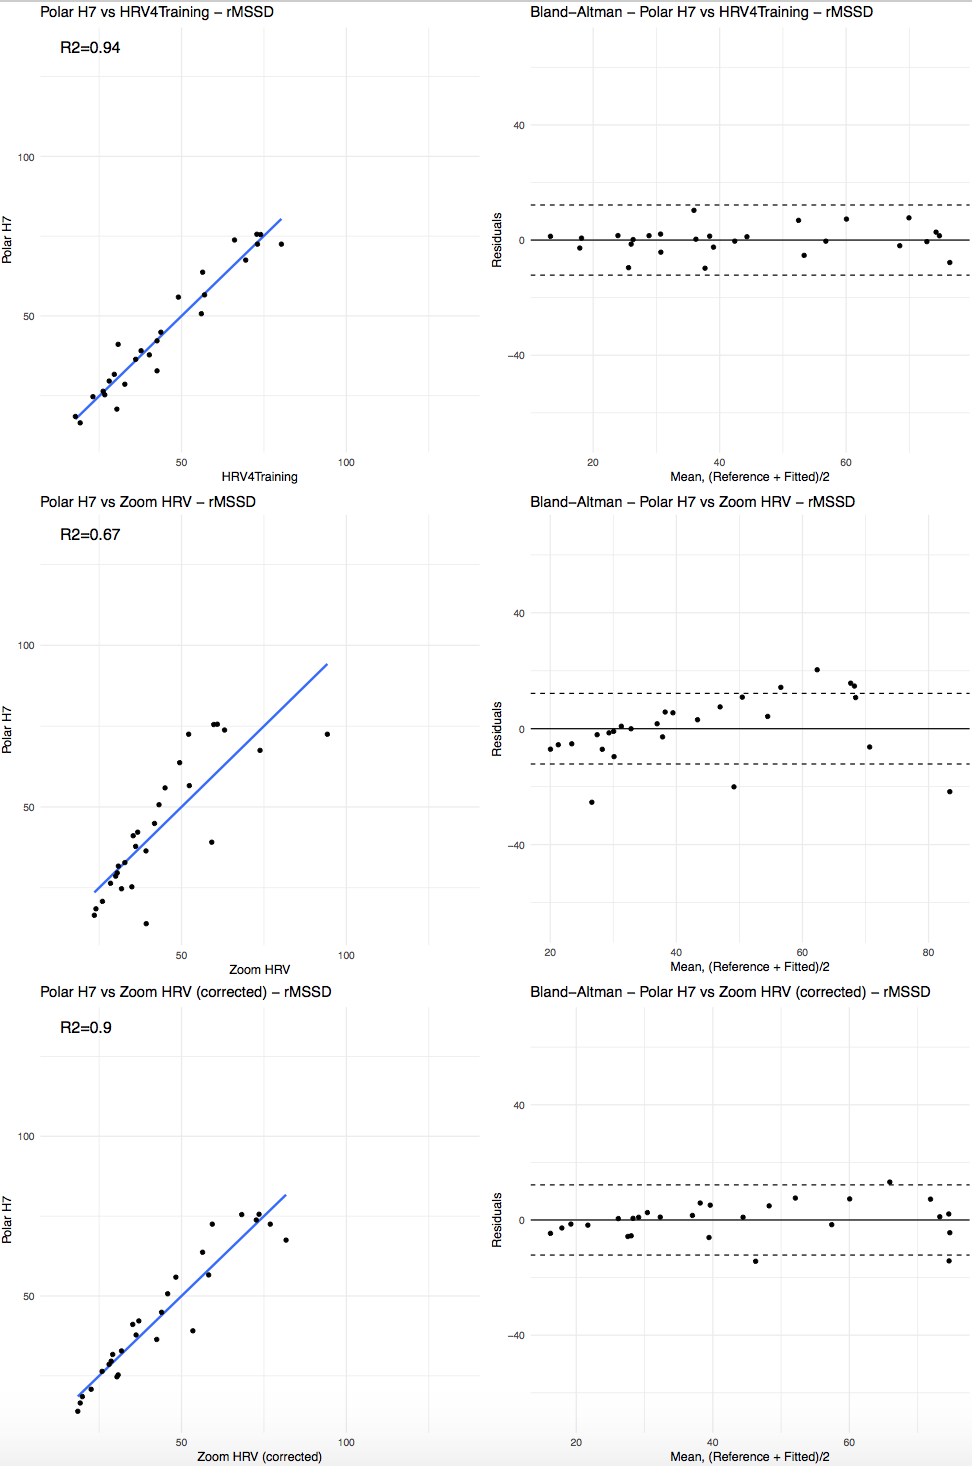 Just an additional note here, as data is in a rather small range, we don't do any favor to these systems, the narrower the range, the harder it is to get very high R2, especially considering data streams are not perfectly synchronized, normal repeated measures variability is between 5 and 20 ms, and so on. Hence, I believe once we take care of the artifacts, results above are extremely good. Limitations in using the Zoom HRV for HRV measurementSomething that is important to mention at this stage is that measurements taken with the Zoom HRV sensor are limited to 3 minutes. Basically you have to tap the device twice, and it will go into 'RR interval transmission' mode, so to speak, which is the modality in which you can connect it to any app and get the data. Normally I believe the sensor sends only heart rate data. In my opinion, this is a smart choice. I'll talk more in the next section about HRV in free living, but the point here is just on signal quality. We've most likely experienced bad signal quality and random output from wrist based heart rate sensors from time to time, when looking at HRV, these issues are extremely amplified. Any tiny movement will basically cause a dramatic loss of signal quality and introduce artifacts that are most likely not recoverable for HRV analysis. You can see this very easily just by slightly moving your finger when measuring with HRV4Training, the PPG signal will be a complete mess. Hence, constraining the HRV measurement to a few minutes in which you are supposed not to move is a good idea, more than pretending this is not a problem and letting you measure in free living, most likely generating garbage features. Additional considerations and latest research on our less is more approach to HRV measurement and analysisThis being said, even when beat to beat data can be acquired with high accuracy in free living, and the only way to do so is to use a chest strap or ECG patch, I believe for our application, which is about measuring underlying physiological stress, less is more and one single measurement in a well known context (first thing in the morning) is more valuable than recording more data at random times during the day or continuously. Why is that? Consider that what we try to measure is parasympathetic activity, so the branch of the autonomic nervous system (ANS) in charge of rest, recovery and relaxation. The ANS is affected by pretty much anything (food, alcohol, coffee, stress - just think about reading something online and getting some emotional reaction in no time), hence measuring throughout the day, while potentially useful if properly contextualized (e.g. if you can link the physiological responses to what is happening, as similar responses are triggered by both physical - training or just walking around - and psychological - emotional or other - stressors, so physiology alone, without context, is really not useful), is typically simply a reflection of all the acute stressors we encounter during the day. if your interest is to measure your response to food intake or a session of meditation, this makes a lot of sense. However, if you are interested in measuring underlying / baseline physiological stress to potentially make adjustments to your training plan or day, then you would end up missing that information or confounding it with whatever is happening in your day (even just light physical activity performed before a measurement). On the other hand, measuring first thing in the morning, before we are affected by such stressors (don't even read your email before measuring), allows us (and in general researchers working on this topic) to assess baseline physiological stress, so the stress resulting from whatever is going on in our life (for an athlete, recreational or not, the main stressor might be training), and then make meaningful changes. HRV is highly influenced by acute stressors (even just breathing differently, or getting stressed, or having coffee) hence the importance of the 'morning routine', measuring as soon as you wake up while trying to stay relaxed. The inability of daily measurements to reflect underlying physiological stress was also shown recently in a paper authored by Ricardo Mesquita, where the authors concluded that 'Analyzing RMSSD from daily routine activities was not reliable, and therefore validity cannot be assumed. RMSSD should therefore be calculated from RR intervals recorded in standardized conditions, such as during the OT upon awakening.' - this is even assuming that rMSSD can be captured correctly during daily activities, which is not to take for granted when using PPG based devices (anything that is not a chest strap). Paper here. SummaryThe Zoom HRV wristband is a viable alternative to chest straps in case you are interested in relying on a sensor for HRV measurement, and can be connected to your favorite HRV app, such as HRV4Training or Elite HRV, since the device complies to the standard bluetooth 4.0 heart rate profile. Good job LifeTrak 👏
It is important however to make sure the app you use employs some sort of artifact correction as from time to time artifacts get in the way, as we've seen above. The technique I used here is simply to remove consecutive beats that differ more than 20%, a commonly used method. A similar method is used in HRV4Training by default, so you don't have to worry about this, however if you use another app, make sure there is something in place. On a personal note, it's very good to see another PPG-based device that is accurate, as usual it's not about the type of sensor (chest strap, wristband or simply your phone camera) or about the type of technology (biopotential, optical, etc.), but it's simply about how the system was designed and validated. Comments are closed.
|


Register to the mailing list
and try the HRV4Training app! 
|