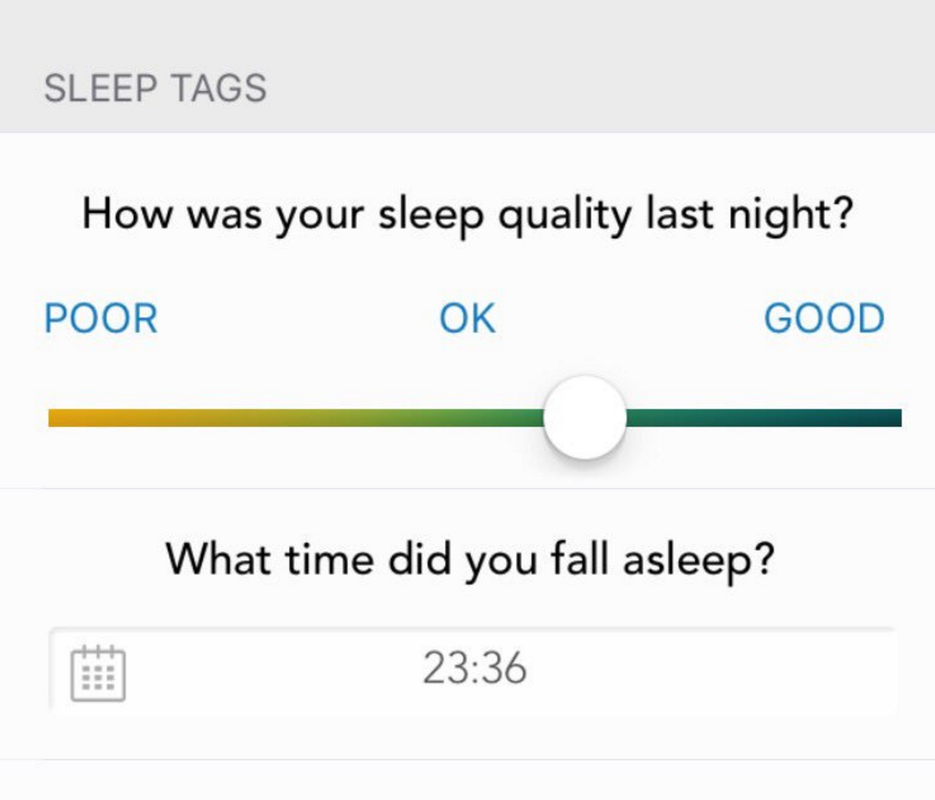
What time did you go to bed? A simple Bayesian model to improve user experience in HRV4Training3/26/2016
Blog post by Marco Altini
In this post I'll cover the data science and modeling behind the next version of the bedtime detection algorithms in HRV4Training. As current users know already, we hadn't put much effort in detecting bedtime until now. In this post I'll cover a few methods I've been working on in he past few days and highlight how combining noisy data sources using a simple Bayesian model can provide good results in detecting bedtime. The new model will be part of HRV4Training approximately around mid April. How can we detect bedtime?
Last week I started looking at this problem more closely and developed a series of algorithms that I will now describe with the aim of understanding limitations and possible improvements that led to the current implementation based on a simple Bayesian model. Here are the models we will be comparing:
Pedometer output
A few years back, for another app, I wrote an algorithm that was trying to detect bedtime based on Pedometer output. All iPhones starting with the 5 include a dedicated processor to count steps (that's why, for example, you can see your daily steps in the Health app without bothering about battery drain). My thought was, since the pedometer can detect movement, it can also detect lack of movement, and therefore we might be able to detect when people are sleeping. Once we go that way, we also make some assumptions, e.g. users pick up the phone first thing in the morning, and most importantly users bring the phone to their bedroom before going to bed. The drawing below shows the rationale behind this approach:
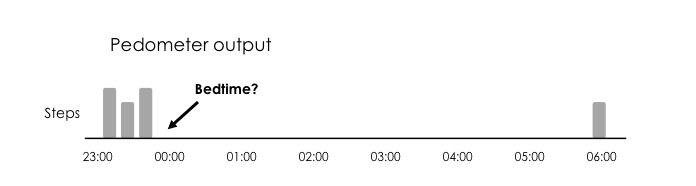
However, I was never happy about the output of this algorithm, as it could fail often. The pedometer is not perfect and sometimes it doesn't detect steps. Some other times I would simply leave the phone next to my bed hours before actually going to sleep. Especially when you live in a small place (see for example our current living situation), and don't walk that much to get to your bedroom, the algorithm can easily fail as no steps are detected.
As a result, it was accurate only sometimes and I decided not to deploy these algorithms in HRV4Training. However, as I've beed automating more and more of the daily tags in HRV4Training, for example your workouts data using Strava's APIs, I went back to the bedtime problem and looked at a few alternatives. Moving average of your historical data
A simple alternative is to use historical data. For example, a moving average of your last week. As you annotate your bedtime for a few days, the app could learn from your input and start providing your recent average bedtime as the default one to edit. We are creatures of habit, and as such, our bedtime might be similar across days.
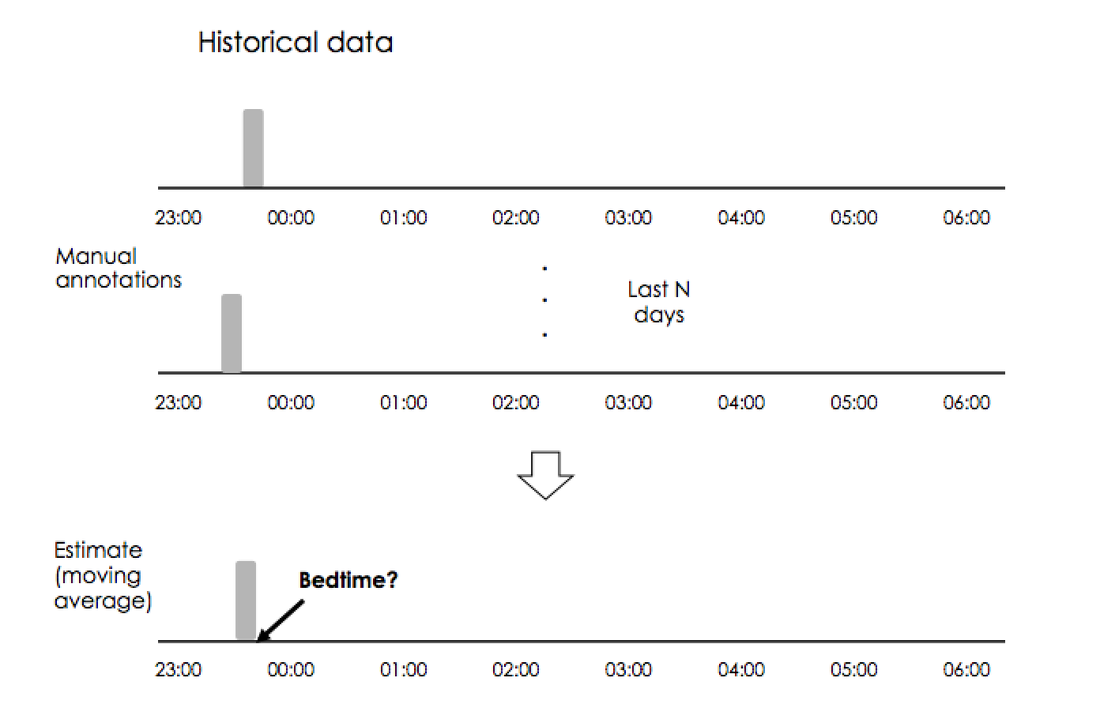
This approach is simple, makes sense, and will most likely get close to your actual bedtime. If the goal is to "limit the amount of manual editing", it might be good enough. However, unless we always go to bed at the exact same time, we will never get the estimate exactly right.
Bayesian model combining Pedometer output and historical data
Both our previous models suffer from limitations:
Bayes to the rescue
The current problem suits well a Bayesian framework. We have noisy data, historical annotations, and new evidence we gather daily based on Pedometer output. We can define a simple Bayesian model with normal conjugate priors to determine bedtime. In a Bayesian framework, we have three entities of interest; the prior, the likelihood, and the posterior:
Personal data
Let's try to make this a bit more practical by looking at my recent data. We will assume we have one week of historical data with manual bedtime annotations. Using this historical data we can determine the prior parameters. The parameters of a normal distribution are the mean and variance, that we can simply derive from our initial week of recordings.
Another parameter we need in order to proceed, is the variance of our likelihood. The variance of our likelihood basically represents how much we trust our Pedometer output. I will postpone the discussion on the choice of this parameter to later, as I think looking at some data first can help in better understanding what we are doing here: 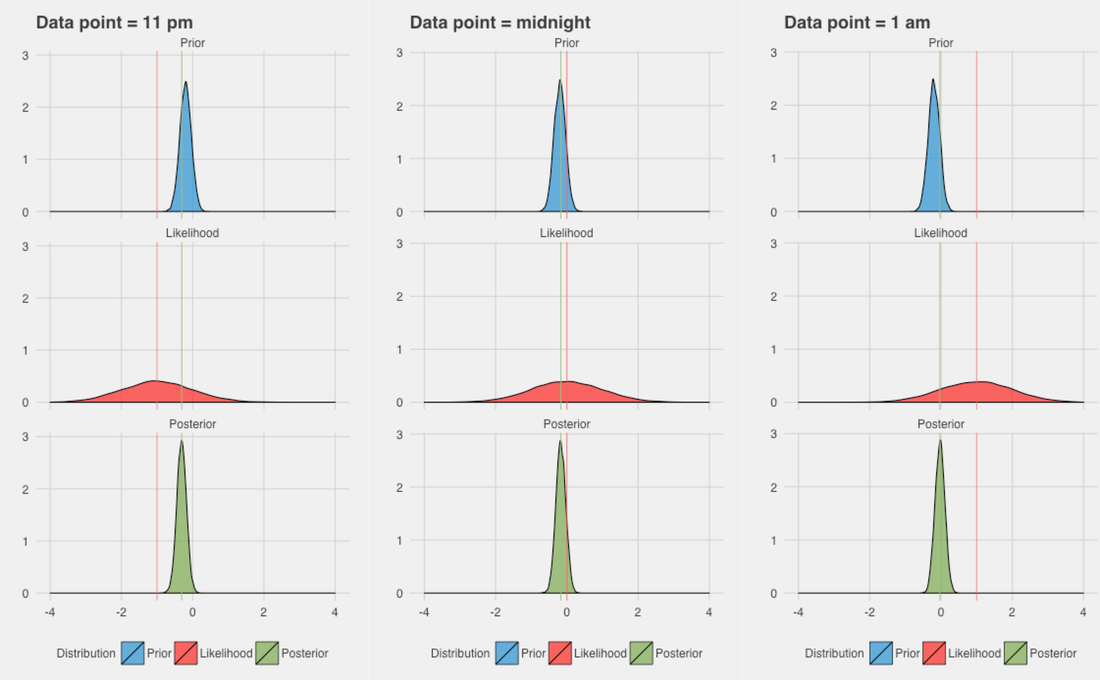
In the figure above, we can see the posterior, and therefore our model estimate, for three different hypothesis. We are answering the question: what would this model predict if the Pedometer output showed that we went to bed at 11pm? Similarly, what would this model predict if the Pedometer output showed that we went to bed at midnight or 1 am?
The x axis shows time of the day (hour) with respect to midnight, so -1 is 11 pm. On the y axis we have the density of the distributions. My data shows a prior quite peaked just before midnight, meaning that I typically go to bed around that time, as our prior comes from my historical data. The likelihood (second row), is centered around our data point, so 11pm, midnight or 1am, and shows high variance. The distribution is quite spread out because we don't trust much our Pedometer output. Coming back to the variance of the likelihood, this parameter was estimated as the variance of the difference between the actual bedtime (manually annotated) and the Pedometer output estimated bedtime. If the accelerometer Pedometer was always correct (or almost always correct), we would have a much lower variance and trust more our likelihood, as I will show in another example later. As a result, the posterior is always very close to the prior. The distribution on the third row changes only slightly, moving to the right, as we see evidence of going to bed later (11 pm to 1am). This is exactly what we want, as we trust more historical data than Pedometer output, given my particular case (see later to understand how this naturally generalizes to each individual). Simulated data: sticking to our habits
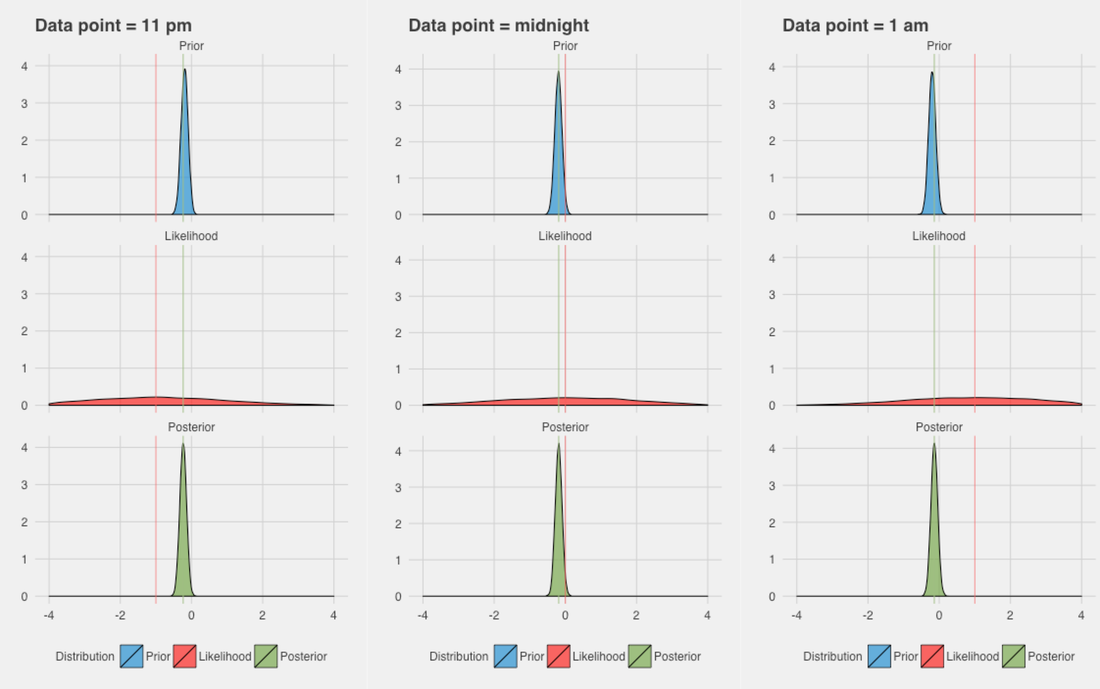
As a second example, I want to show what would happen if we were really good at having a consistent lifestyle and going to bed every day pretty much at the same time. In this case, the Pedometer output would basically be completely ignored because we know we can rely much more on historical data. The likelihood is even more spread out, and the prior even more peaked than before:
Simulated data: trusting the Pedometer
Finally, as a third case, let's hypothesize we can actually trust our Pedometer. There might be individual cases in which you always carry your phone to bed, and maybe have to climb a flight of stairs on your way to the bedroom. This seems a case in which your phone might be good at determining bedtime, or at least better than your historical data. Since we trust the Pedometer more, the variance on the likelihood is much reduced, and our posterior follows the likelihood more than the prior, showing that the estimate will be much closer to the Pedometer output than the historical data:
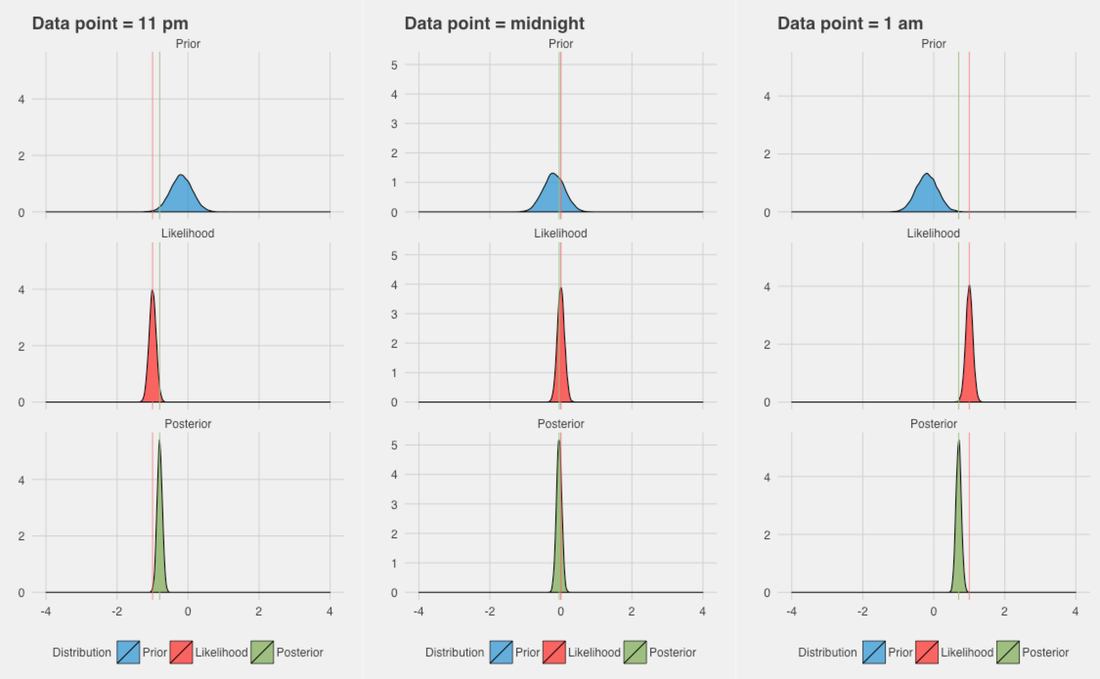
We can see from the posterior plots above how for the first time we definitely move farther away from midnight as the data also moves away (11pm or 1am cases).
How good is this Bayesian model?
Now that I have explained the different models, and how the Bayesian model relies on both historical data and new evidence gathered from the phone Pedometer, we need to look at what all of this means for a user that simply wants to track sleep time without having to spend too much time annotating or editing tags in the morning.
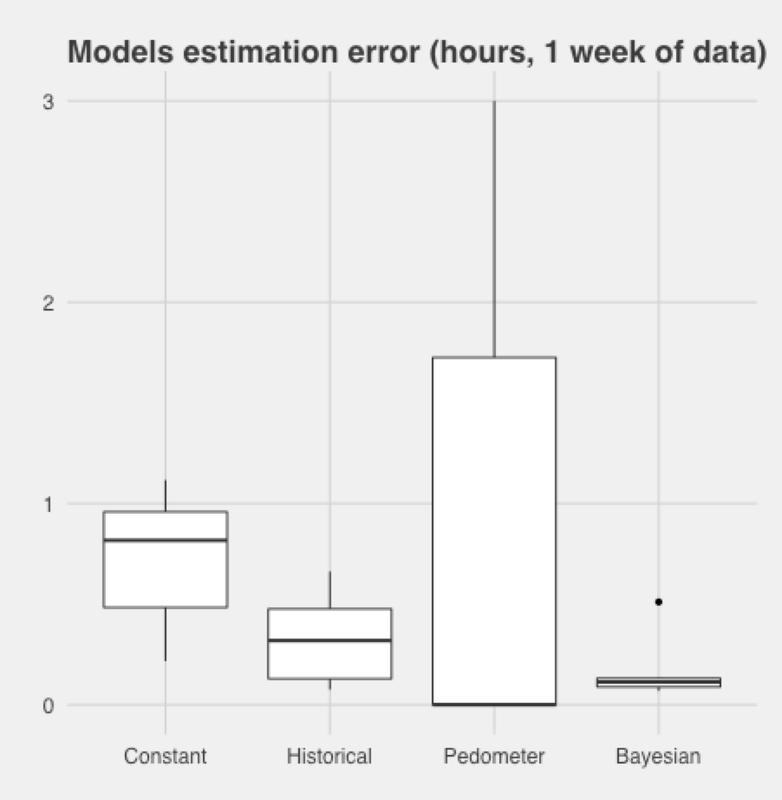
Using my last week of data, I computed absolute errors for the following models:
The Historical data approach provides also decent results, showing that I tend to go to bed around the same time every day.
Finally, the Bayesian model further reduces error and provides the best estimates, just 10 minutes off the actual bedtime on average. Summary
In this post I covered a few different methods to detect bedtime, proposing a Bayesian model able to combine noisy data sources for optimal results.
One of the best aspects of this model, is that it adapts to your own case. As I've shown above, confidence in historical or Pedometer data will change based on your own annotations and data. Thus, the algorithm will tune based on your behavior. We'll be rolling out this feature soon, and hopefully make your life easier for the ones interested in tracking sleep time and bedtime. If you are an iPad user or have an iphone 4S, as these devices do not have Pedometers, we will be implementing our second best model, i.e. the one using historical data.
3 Comments
Geoff Hutchison
4/8/2016 07:29:10 pm
Great, great idea! I just started HRV4Training and really want to see the correlation with amount of sleep and HRV data. Anecdotally on the first ~12 days, there's a strong correlation.
Jason
4/10/2016 09:20:30 pm
Thanks so much for continuing to develop with the 4S in mind!! Your apps are the only reason I still have an apple device, as I switched to Android some time ago...
Marco Altini
4/10/2016 09:37:37 pm
Thank you Jason! Your comment will be posted after it is approved.
Leave a Reply. |


Register to the mailing list
and try the HRV4Training app! 
|