Heart rate, heart rate variability (HRV), VO2max, training intensity & running performance in HRV4Training runners & triathletesBlog post by Marco Altini This post is the summary of our main findings following from analyzing user generated data in the past few weeks. In particular, as we started providing the possibility to link actual workout data to the app, we could finally explore the relation between physiological parameters measured or estimated by HRV4Training (heart rate (HR), heart rate variability (HRV) and VO2max) and running performance as captured by 10km, half marathon and full marathon times. We wrote three blog posts:
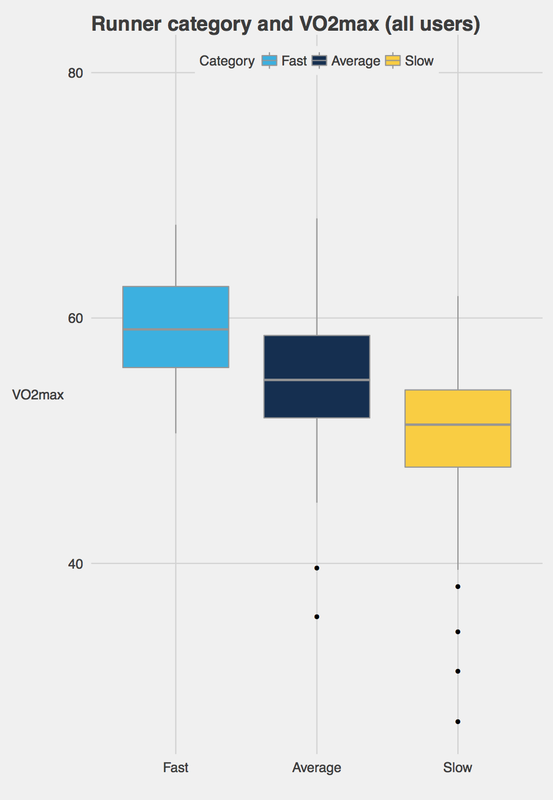
What did we find while analyzing the relation between physiological data and performance? DatasetThe dataset used for these analysis are very similar, even though we had slightly different inclusion criteria, overall we analyzed samples of 4-500 users, with up to 6 months of daily measurements per person. For each user we grouped trainings around 10Km, 21Km and 42Km, determined the fastest times per person (removing outliers) and therefore obtained our user performance data. We also split runners in three categories depending on their best times, for example, fast runners were defined as runners that can run a 10Km below 40 minutes or a half marathon below 1 hour and 30 minutes or a full marathon below 3 hours. Average runners got to 47 minute and 30 seconds for a 10Km and 1 hour and 45 for a half marathon and sub 4 hours for a marathon, while slow runners were the remaining ones. More details in the blog posts linked above. 1. Running performance and VO2max
We tried to be aggressive on filtering out users with odd data (included only users with at least 2 to 4 weeks of measurements, removed outliers, etc.) as we anyway had plenty of data (we started with a thousand users with actual workouts data and 30 000 trainings), and indeed the greater sample size with respect to standard studies did the rest, allowing us to highlight clear differences in estimated VO2max between running performance categories. This was an expected outcome as the whole point of estimating VO2max using workouts data and sub-maximal heart rate is that a person that can keep heart rate lower (with respect to her/his maximal) during a certain effort, can perform better (faster pace) than a person that is already maxing out at the same running pace. This principle is very intuitive and is the main principle behind our VO2max estimate. This being said, these are data acquired in unsupervised conditions in real life, and therefore nothing should be taken for granted. 2. Resting heart rate, HRV and running performanceIn this second post, we looked at the relation between physiological data at rest (morning heart rate and heart rate variability data acquired using HRV4Training) and running performance. We saw that we have a weak but consistent relation between physiological data at rest and running performance, for both heart rate and HRV data. HR seems to decrease quite consistently with improved performance / fitness, while the relation is less linear for HRV, and while there is much overlap between the different categories, it seems that faster runners do have a slightly higher baseline rMSSD on average. In this analysis, it was particularly important to break down the HRV analysis by age, as age is the main factor behind differences in HRV at the population level, and not considering it could lead to deriving the wrong conclusions (big confounding factor): 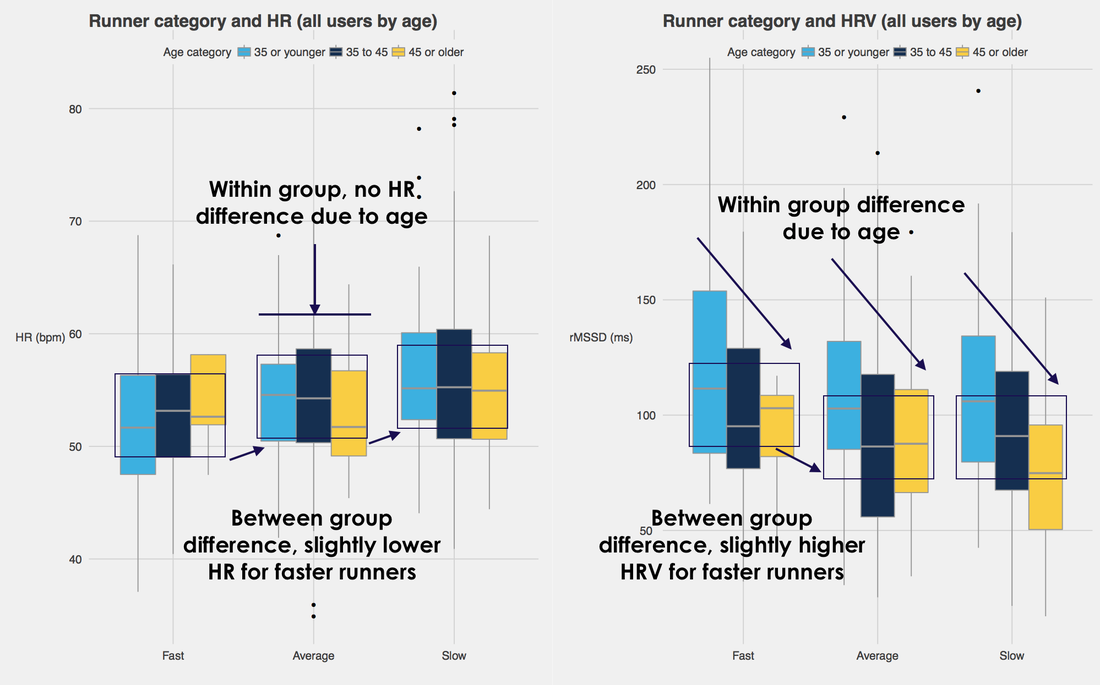 As we see much variability in physiological data at rest between different categories of runners, it is unlikely that running performance can be predicted accurately based on these data. On the other hand, our VO2max estimate was a much better predictor of running performance. Morning recordings of HR and HRV data remain invaluable metrics to assess day to day load and analyze recent trends that provide unique insights on your physiological stress level, recovery, adaptation to your training plan and risk of overtraining. However, these metrics are not ideal in the context of estimating running performance. 3. How hard do you train?In this post we investigated the relation between training intensity and running performance in HRV4Training users. Quite some research in the past 15 years showed how elite runners (and not only runners) spend much of their time training at low intensities (see Seiler et al.). Many runners, coaches and authors have been preaching low intensity training for many years, under slightly different guidelines, but all following the same core principles (see for example heart monitor training by John Parker Jr, most of Phil Maffetone's work - the 180 formula, MAF test, etc. - and more recently 80/20 running by Matt Fitzgerald, who also wrote this nice piece on the topic on RunnersWorld). Many of the studies mentioned by Matt (see Seiler's work) start by observing what elite athletes were doing to try to capture underlying patterns (e.g. what's the optimal ratio of low and high intensity training). Following the same principle, we thought it would be interesting to look at similar relationships on our data as well. This analysis was a bit more challenging and in the blog post we spend a bit more time highlighting the techniques we used to clean the data, make sure outliers are removed, compute a user relative training intensity from heart rate and pace data, and so on. Eventually, we highlighted the same relations reported in literature on our userbase, for both runners and triathletes (about 400 users in total). Faster runners consistently trained at lower relative heart rate and pace with respect to slower runners, according to the data analyzed in this post. In particular, combining estimated training intensity from pace and heart rate data, we could show the relation between running performance and training intensity visually. To do so, we plotted the data using two-dimensional density plots, shown below. What we expected to see is the center of the distribution (the place where most of the data are for a given category) to be closer to the bottom left corner for faster users, as the bottom left corner is the low intensity spot: 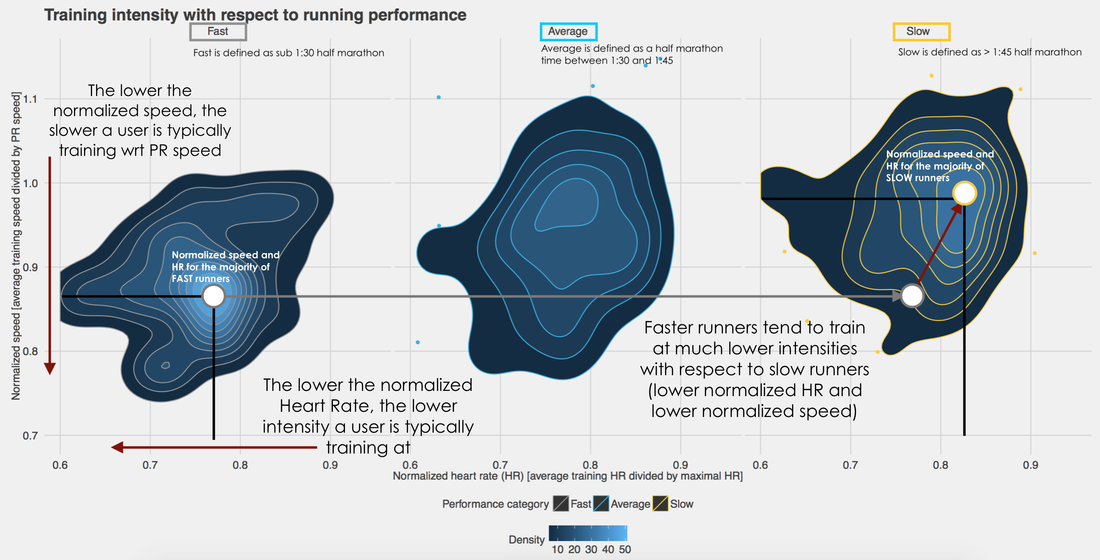 What's next?In these three blog posts we used users generated data, in particular self-reported annotations, actual training data as acquired through the Strava integration and physiological data, with the aim of trying to better understands relationships between physiology and running performance.
These studies were observational, which means they do not allow us to derive causal links between training patterns and performance - for example even if faster runners train slower most of the time, without a proper intervention we cannot claim that training at lower intensities is what makes them faster - however as this is real life data acquired in unsupervised conditions, we hope it can provide additional insights on the relation between physiological data, training intensity and performance. Something interesting for the future, would be to move these studies to longitudinal ones. For example to determine if the estimated VO2max tracks well within an individual with respect to performance, meaning: if you run multiple races over a year (or years) is VO2max estimated in the app correlated with your running performance? Basically moving this analysis from the group to the individual level. Similarly, as we gather more data, we will be looking at capturing changes in training intensity patterns and performance for different individuals over time (longitudinally), and trying to determine if changes in training patterns, such as more low intensity training, can get you faster. I hope these posts were useful in showing how user generated data are messy but insightful, as long as we design a tool with research in mind, and we are aware of the limitations of each step involved from sensing to transmitting data to trying to derive conclusions. As our long term goal is to push further our knowledge on complex relations between these parameters using a simple but scientifically validated tool such as HRV4Training, and outsourcing data collection to thousand of us, we will keep documenting our progress on user generated data science on this blog.
0 Comments
Your comment will be posted after it is approved.
Leave a Reply. |


Register to the mailing list
and try the HRV4Training app! 
|