|
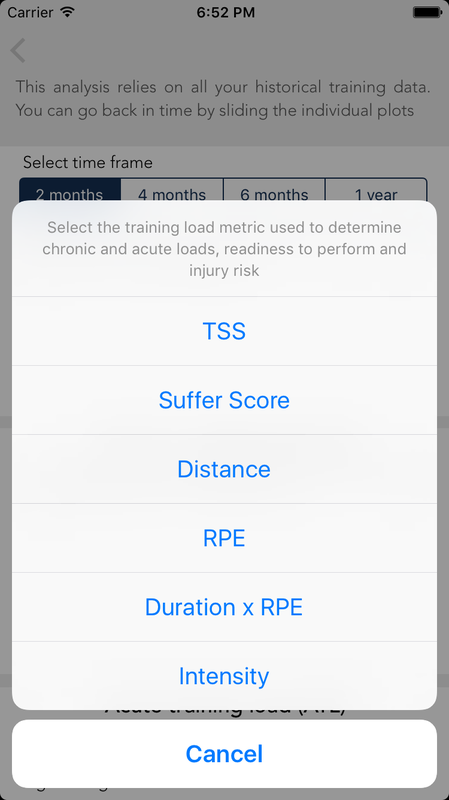
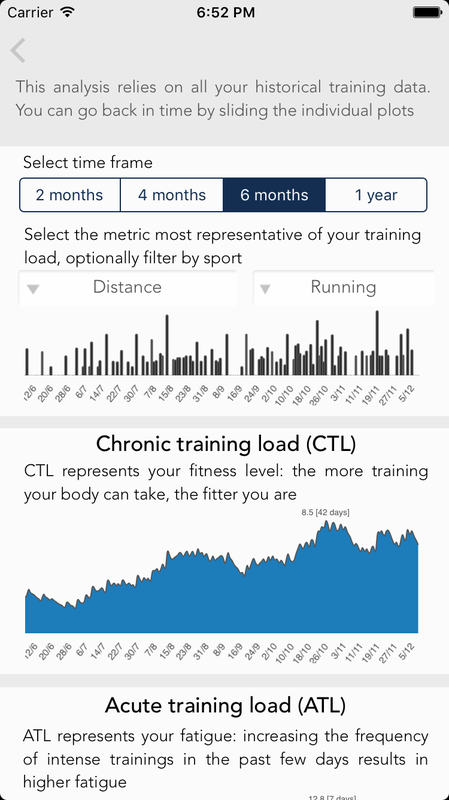
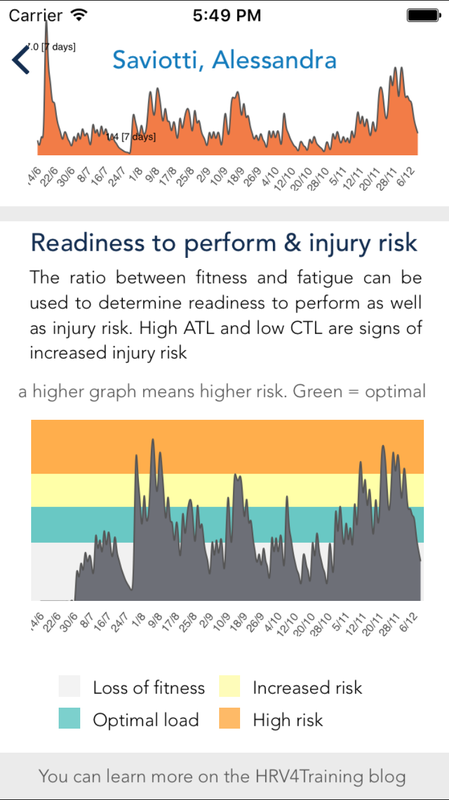
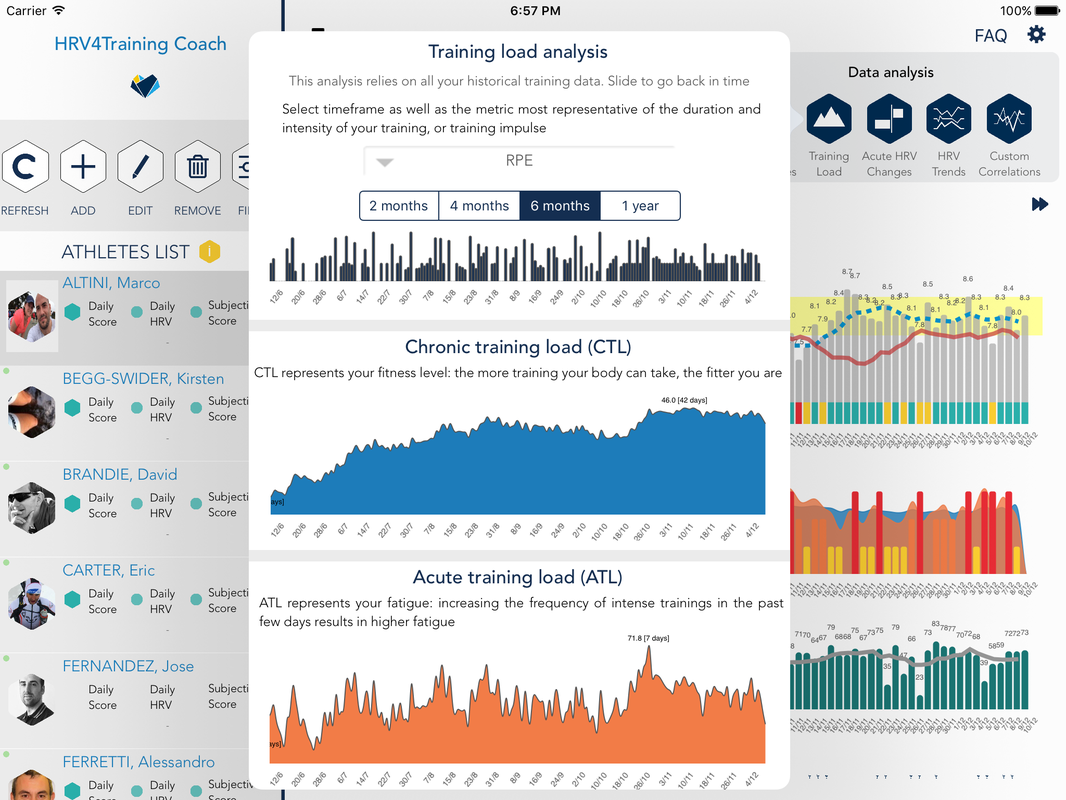
Blog post by Marco Altini This is a short post to highlight some changes to the training load analysis that you can find under Insights in HRV4Training. In particular, we re-worked the last plot of the page, the one showing injury risk, to better reflect current state of the art models used to determine injury risk for endurance athletes as well as teams. We now report the acute to chronic ratio and a few thresholds (color-coded) that highlight which ratios are optimal and which ratios should trigger more caution. For more details on the training load features, please refer to our previous post where we explain the Banister model and reference to a few other articles that explain very well the theory behind computing chronic and acute training loads as markers of fitness and fatigue. Initially, we used the difference between chronic and acute training loads to compute injury risk, however the model based on the difference suffers from a few shortcomings: units are arbitrary and change based on the training impulse units, making it difficult to compare or standardize risks (e.g. using thresholds that we can all share and learn from), and is also less readable than the ratio. The acute to chronic training load ratio has been used a lot recently to estimate injury risk, especially by Tim Gabbett (please check out this article for a comprehensive analysis by Tim). Similarly to any other aspect of training load monitoring and performance optimization, there is no one size fits all and many parameters need to be considered. However, the acute to chronic ratio can be a valuable tool to keep things under control and make sure we do not introduce too much acute load based on our recent chronic load. The new analysis is available in both HRV4Training and HRV4Training Coach, see two screenshots below:
 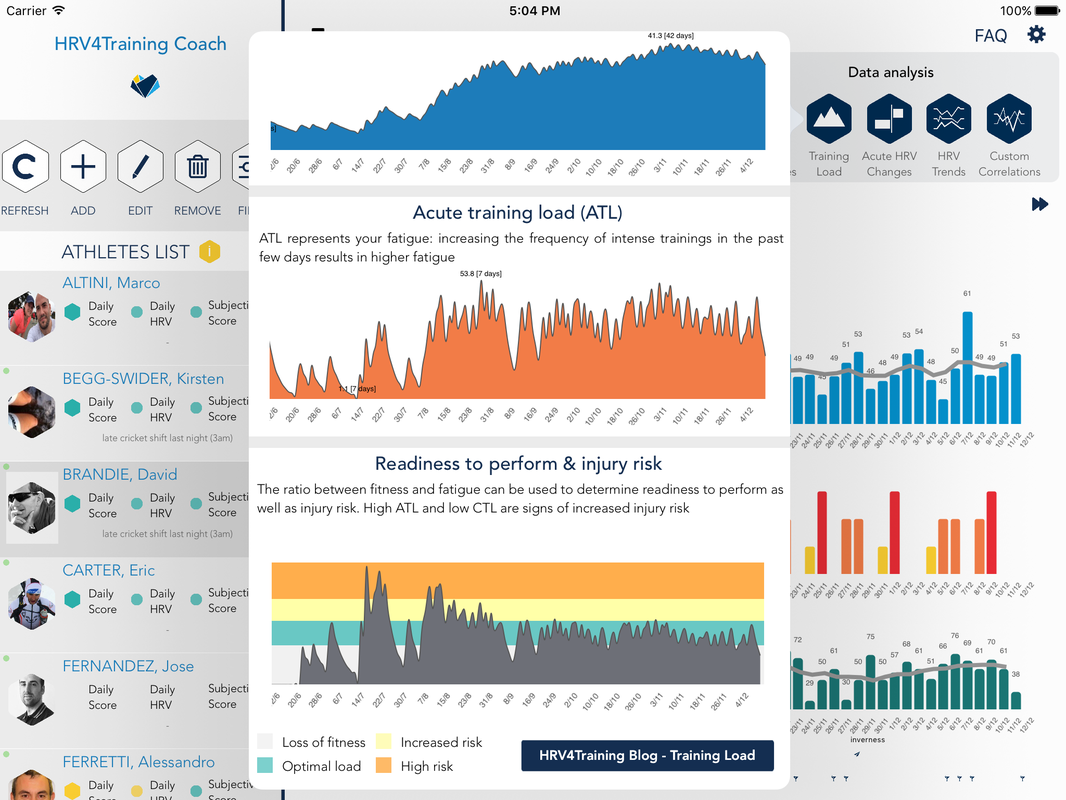 What you can see above is an optimal area in which training load should be, in order to trigger positive adaptations (this is a ratio of approximately 0.8 to 1.3). A lower ratio, white area, would cause loss of fitness, as basically there is not enough training. An higher ratio, would instead increase injury risk, as it means we are training too much with respect to what we are used to take. We show two "higher risk areas", one between 1.3 and 1.75 in yellow and one above 1.75 in orange.
The new feature will be available by mid December, 2016. We hope you'll find it useful in better managing your training load.
0 Comments
Your comment will be posted after it is approved.
Leave a Reply. |


Register to the mailing list
and try the HRV4Training app! 
|