|
Blog post by Marco Altini.
As we strive to make HRV4Training a more complete platform that goes far beyond the conveniency of your daily camera-based HRV measurement, we've been extending our training load analysis.
We went back and forth in the past, initially providing information on readiness and then shifting to injury risk. We believe both analysis are informative and therefore the updated training load analysis will provide better feedback on your current fitness, fatigue, readiness to perform, and injury risk. Our training load analysis is similar to what is already performed by many other tools out there, and based on the work of Calvert, Banister, Savage and Back (full paper here). Our goal is to provide a more comprehensive view, including not only training load (acute and chronic) but also physiological adaptations to your training plan, as already included in the app. Here, I we cover the main points and give some tips on how to make the most out of this feature in HRV4Training and HRV4Training Coach. In particular, I'll cover the following:
1. Workout load
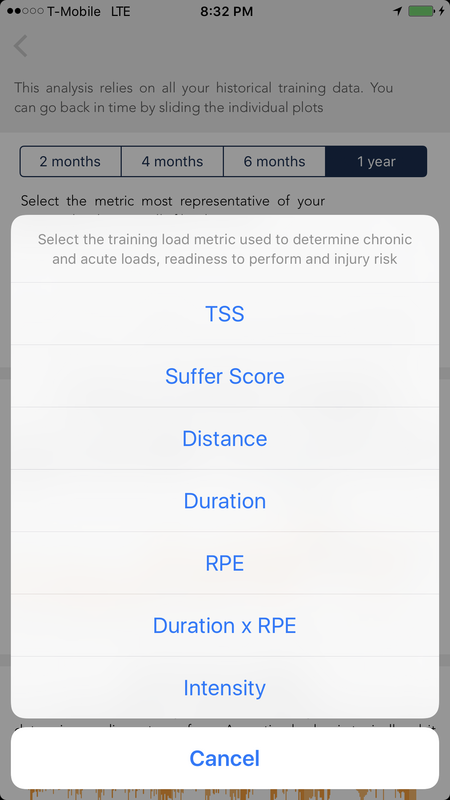
To analyze your training load, you first need to quantify each individual workout load. As we are not in the business of determining your training effort for a given workout, the training load analysis in HRV4Training will let you pick the one that you prefer and is most representative of your training effort for the sport that you do (for example RPE, Suffer Score, TSS, training distance, etc.).
Personally, as I am currently only running, I use either distance or Strava's Suffer Score as it is a metric that works fairly well for runners, where workout load can be quantified using heart rate zones. 2. Fitness & Fatigue
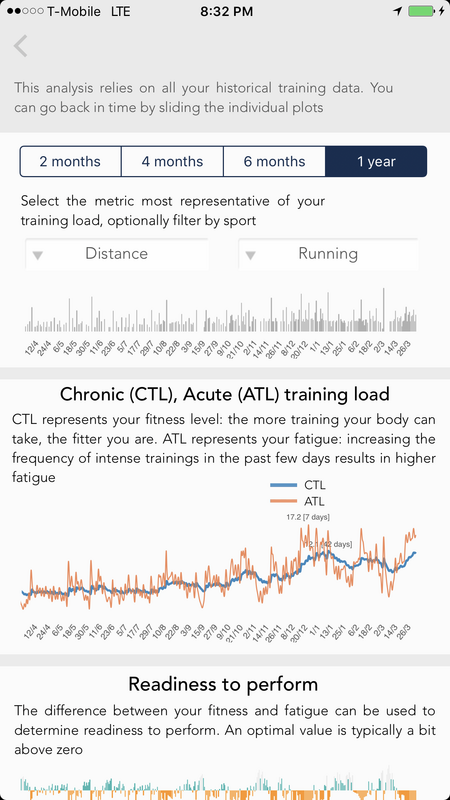
Once we quantified each individual workout, what do we do? According to the paper cited above, and a few variations implemented over the years, we can use training load data to determine fitness & fatigue.
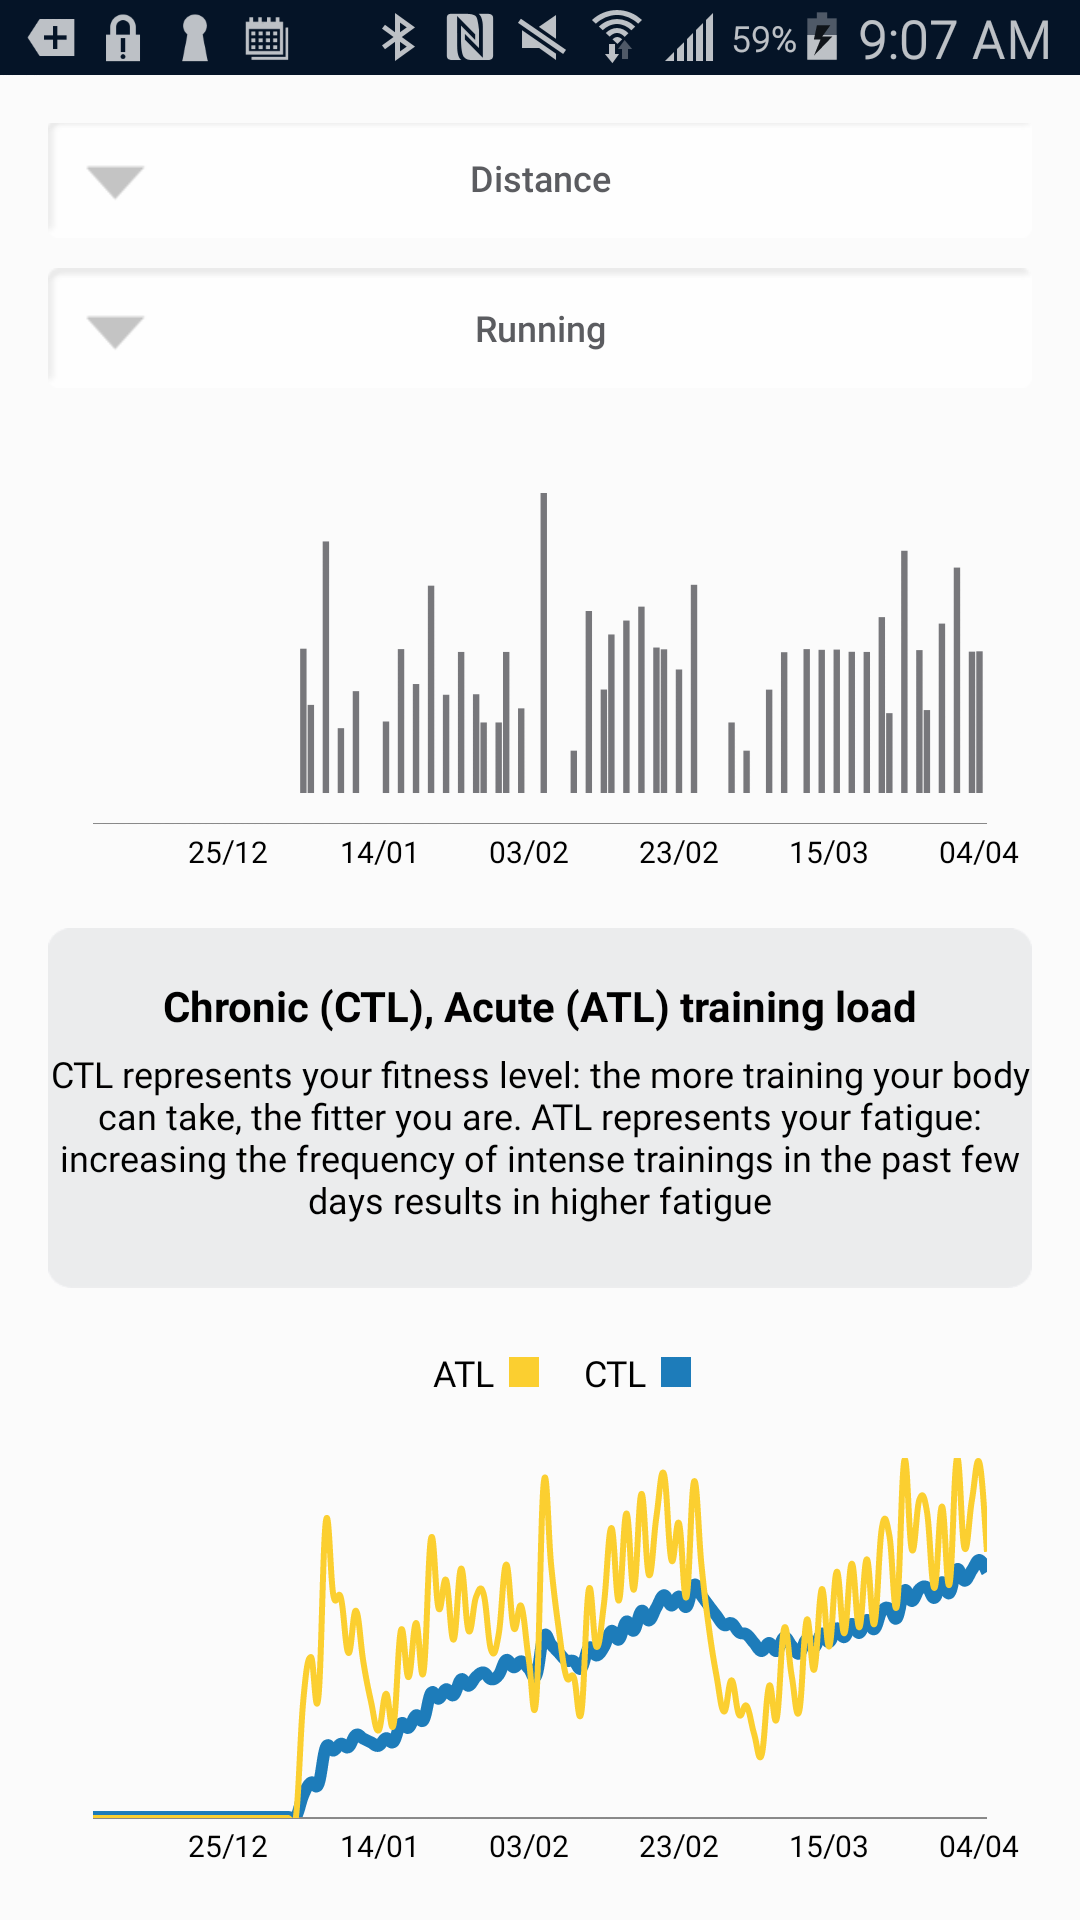
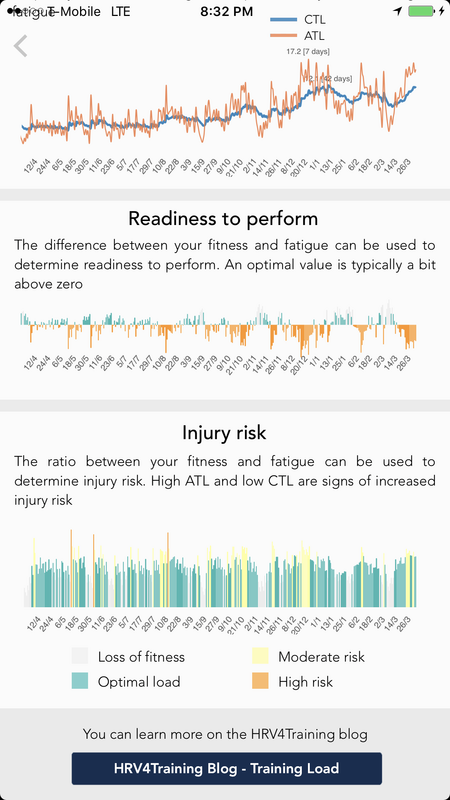
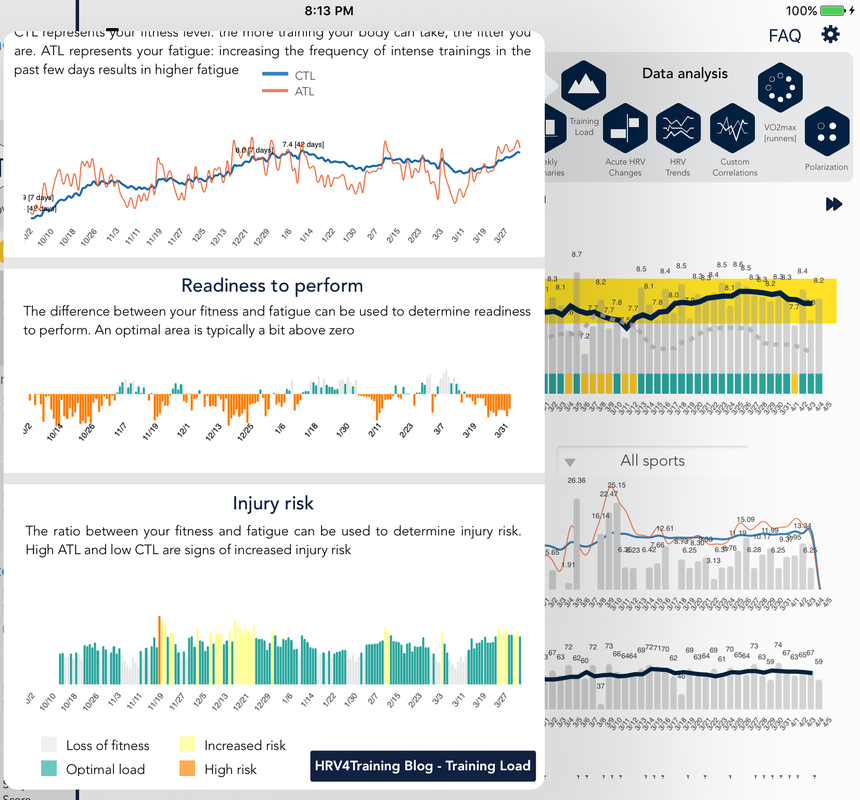
Fitness (or Chronic Training Load, CTL), represent the amount of training you could take in the past e.g. 4-8 weeks. Intuitively, the more trainings you can handle, the fitter you are. However, frequent intense trainings will also get you tired. Acute Training Load (ATL) captures your recent workouts, over e.g. the past 1-2 weeks and represents the fatigue you are accumulating. By looking at your CTL and ATL plots over long periods of time, you can easily see periods of higher fitness, as you were able to accumulate more intense trainings, as well as fatigue "peaks" in correspondence of the hardest workouts, that probably got you tired in the following few days. Units are arbitrary but you can easily go through your historical data and spot periods of higher physical fitness. These plots can also help you better time your tapering, as you can see the effect of reduced training load on the readiness to perform & injury risk plot, discussed below. We modified this screen to show ATL and CTL on the same plot, as we believe it easier to understand them this way. Here are some screenshots on iPhone and Android:
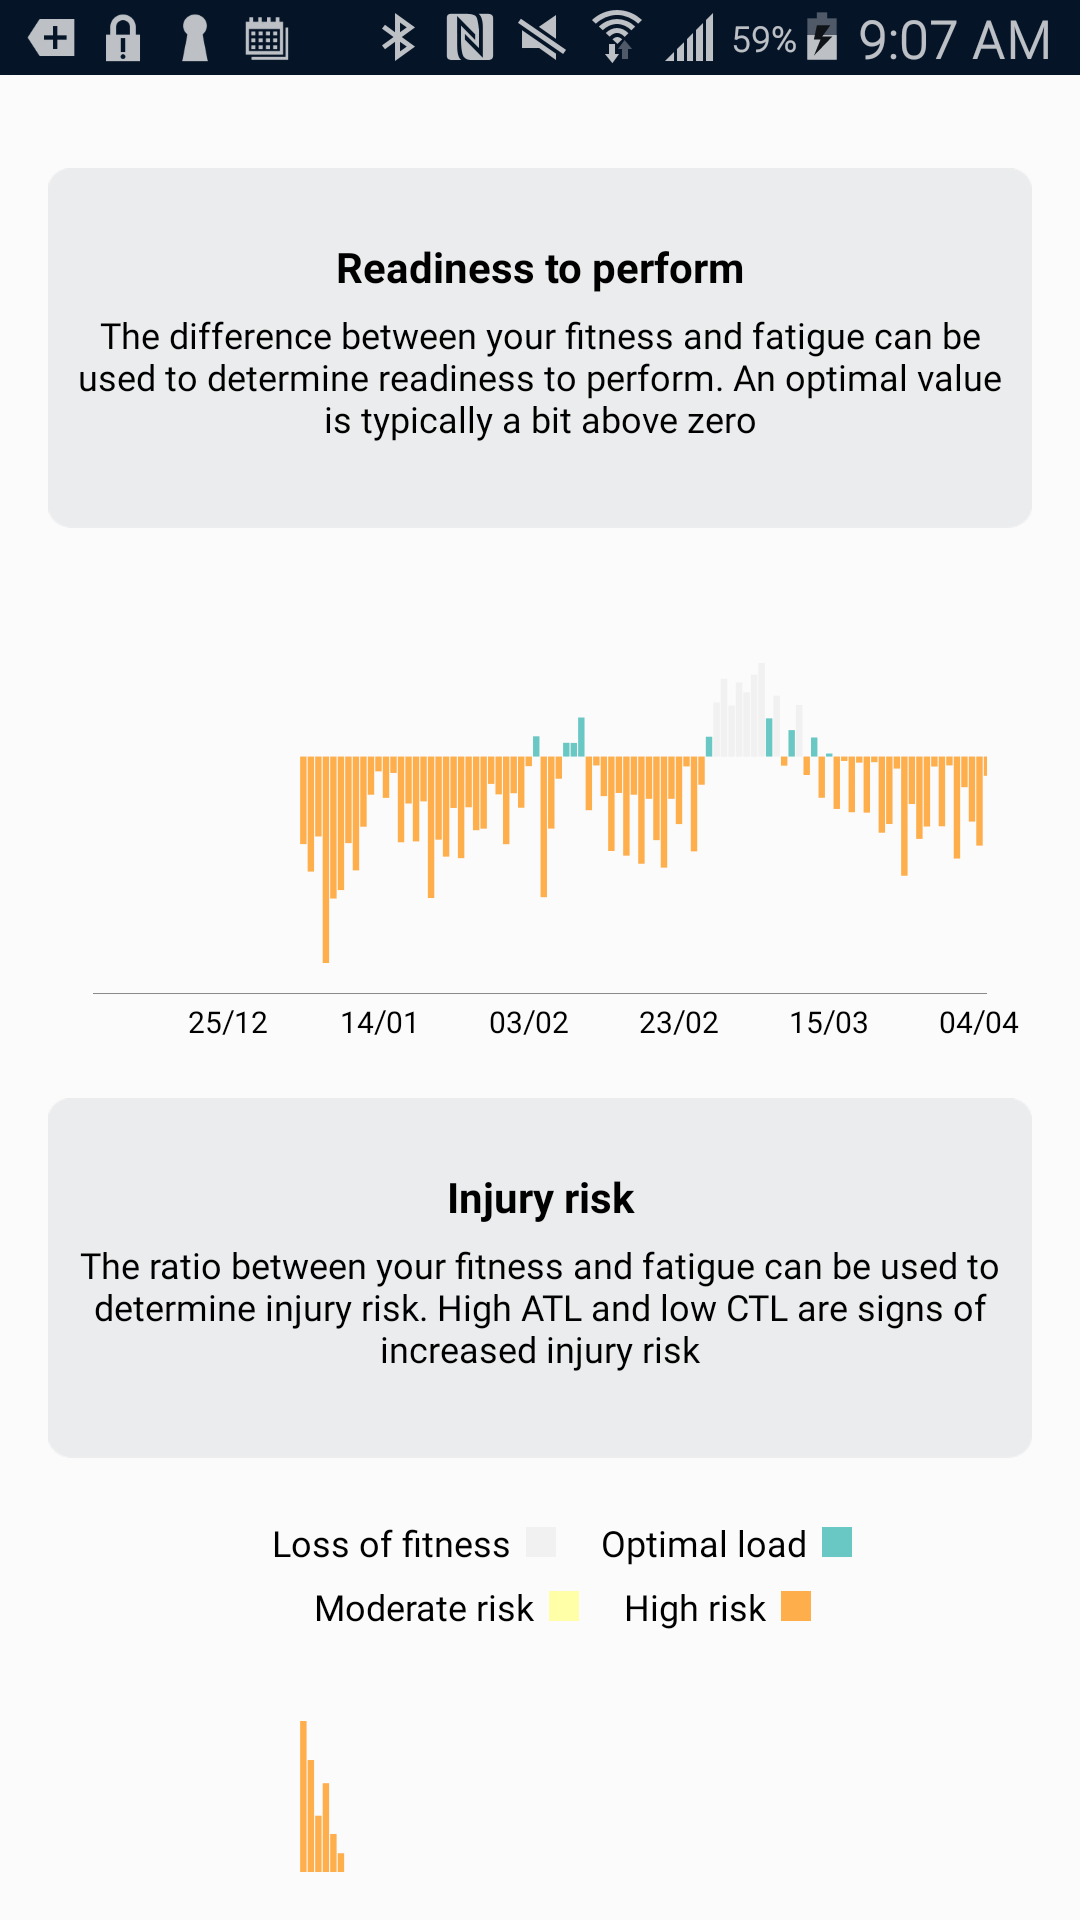
3. Readiness to perform
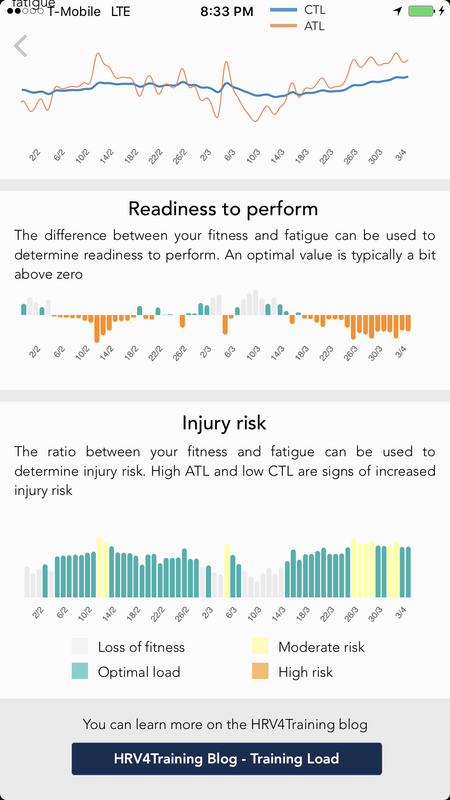
Once we have determined fitness and fatigue, we can simply subtract them to determine our readiness to perform. We expect to be below zero in this plot every time we increase significantly our training load, which results in increased fatigue (ATL).
On the other hand, we expect to be above zero every time we reduce training and therefore ATL. This is similar to what others call training stress balance. The sweet spot is somewhere in between, as reducing training too much will eventually lead to "much readiness" but with decreased fitness level. Thus, these plots should be looked at together as no single plot provides the full picture. In the plots below for example (first and second) you can see my recent data as I am about to finish three weeks of high load. Acute load is increasing, chronic load is following, readiness to perform is negative (shown in orange) highlighting that under such high load my body is on the tired side.
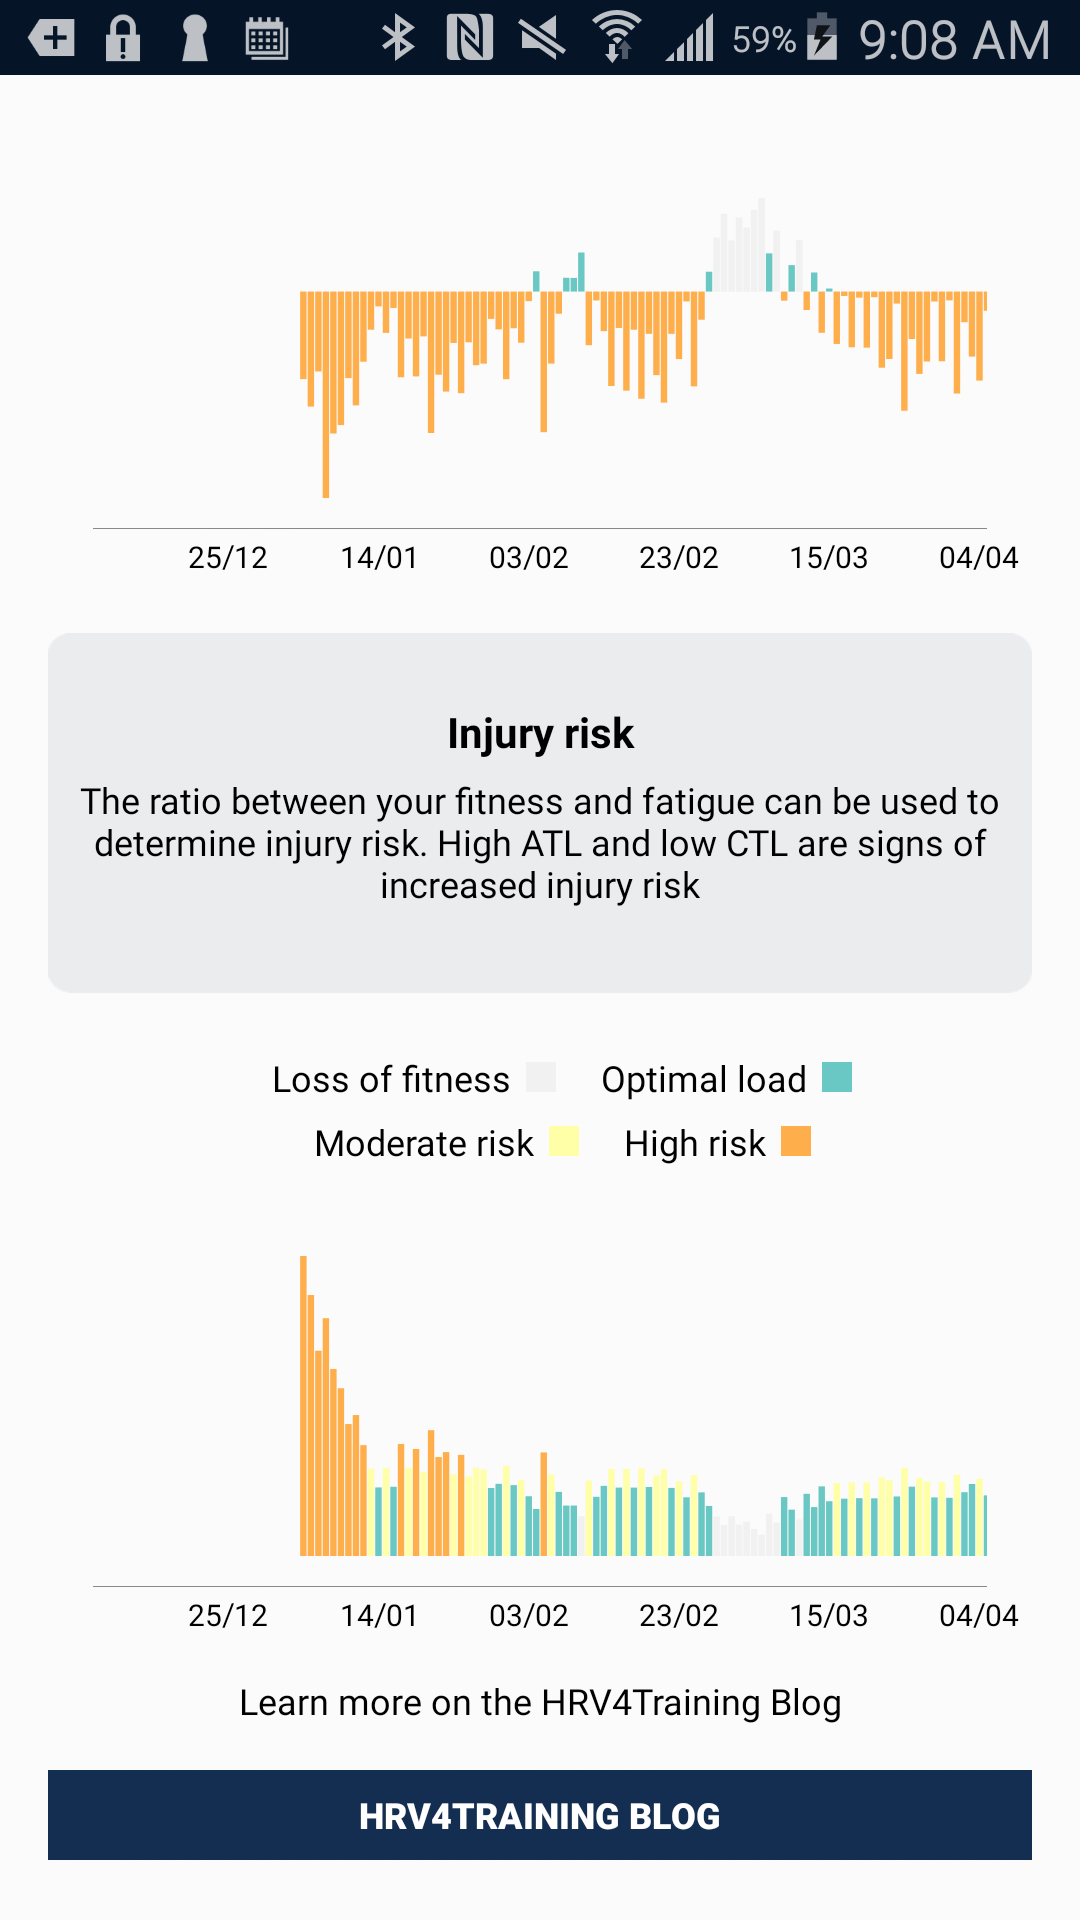
Injury risk
What about injury risk? Recent work (Gabbett et al., check out this article for a comprehensive analysis by Tim) found that the ratio between chronic and acute training load is one of the best predictors of injury. Intuitively, this means that you should not load too much if you are not used to certain training loads.
Similarly to any other aspect of training load monitoring and performance optimization, there is no one size fits all and many parameters need to be considered. However, the acute to chronic ratio can be a valuable tool to keep things under control and make sure we do not introduce too much acute load based on our recent chronic load What you can see below is an optimal area in which training load should be, in order to trigger positive adaptations (this is a ratio of approximately 0.8 to 1.3). A lower ratio, white area, would cause loss of fitness, as basically there is not enough training. An higher ratio, would instead increase injury risk, as it means we are training too much with respect to what we are used to take. We show two "higher risk areas", one between 1.3 and 1.75 in yellow and one above 1.75 in orange. As you can see readiness to perform and injury risk provide different information. My readiness to perform in the past few weeks is always down as I keep loading (orange bars), obviously before a race you'd taper and get readiness to perform higher up. However, injury risk after a few initial higher risk days due to the higher load, goes back to green showing that according to this model I am now loading an amount of training my body can take, given the increased chronic load:
What about HRV?
As we provide more information, sometime it can be challenging to put all the pieces together and decide what to do. Where does the readiness to perform plot stand with respect to our daily advice and HRV trends?
We believe that a combined approach is best. Making daily adjustments following the daily advice, as well as bigger changes based on long term trends (e.g. postponing an intense training block when your HRV trend is going down in a non-trivial way) should help optimizing your workouts and keeping your readiness to perform & injury risk in the sweet spot. Adding to the usual tools the ability to look at fitness and fatigue, as well as readiness to perform and injury risk, can help you making some additional adjustments in terms of the training load you can handle at a given time, and provide valuable data to better understand the big picture. For example, while your body might have recovered, physiologically speaking, from a previous intense workout, other factors also play a role. Muscle fatigue is one of the factors that cannot be captured using only HRV, and looking at both your HR/HRV data and your training load data and readiness to perform can provide a more comprehensive view of the current situation. Similarly, looking only at your training load data (fitness, fatigue & readiness) fails to take into account your physiological responses to such training load. The next step, will be finding the optimal way to combine physiological responses to training, as quantified by means of HR and HRV, and your actual training load and readiness to perform, to further optimize training plans and performance and provide better guidance.
Click to set custom HTML
Useful resources
For a deeper dive into Banister's training load modeling, see Jonathan Savage going through the math, Andy R. Coggan (TrainingPeaks) covering all the details as well as limitations and similar techniques implemented in SportTracks.
1 Comment
Jason Horton
7/1/2017 02:03:31 pm
Appreciate the work and the info Marco Your comment will be posted after it is approved.
Leave a Reply. |


Register to the mailing list
and try the HRV4Training app! 
|