|
Blog post by Marco Altini I often talk about your "normal values" as the only meaningful way to make use of Heart Rate Variability (HRV) data. But what are these normal values? Why are they important? Simply put, your normal values are a representation of your historical data. They allow you to understand if acute (daily) and chronic (weekly) HRV responses are showing meaningful changes or just small variations that you should not worry about. Normal values make the data actionable. Why do we need normal values? This has to do with the high day to day variability in HRV data. It might be easier to show this with an example. Let's look at the data below. This is typical HRV data, there is much variability between consecutive days. Should the highlighted reduction trigger concerns and adjustments in our plans or not? 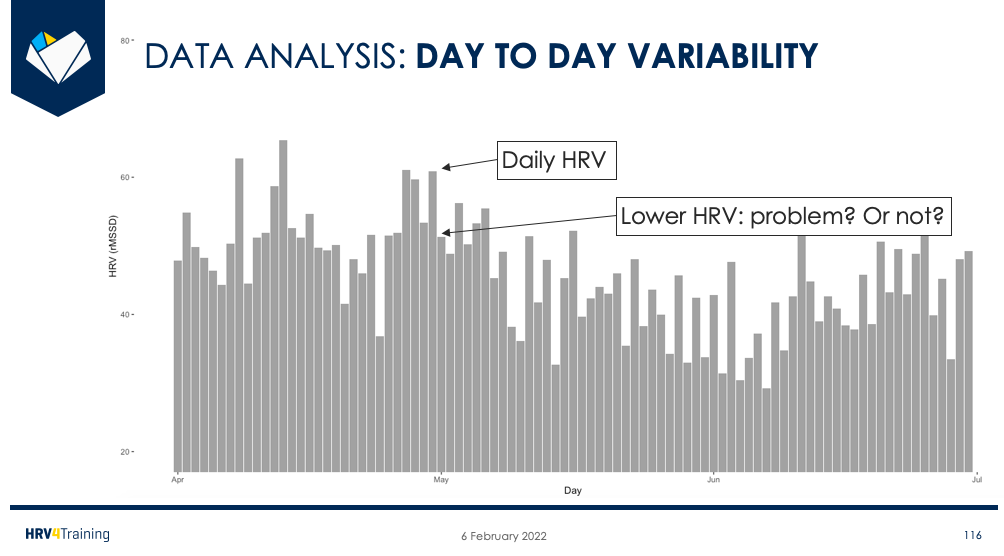 Many tools will allow you to at least look at your baseline, computed as a weekly average, or smoother version of your daily HRV. Does this solve the problem? Not really, we get a better understanding of the recent value, but still, are these reductions meaningful? 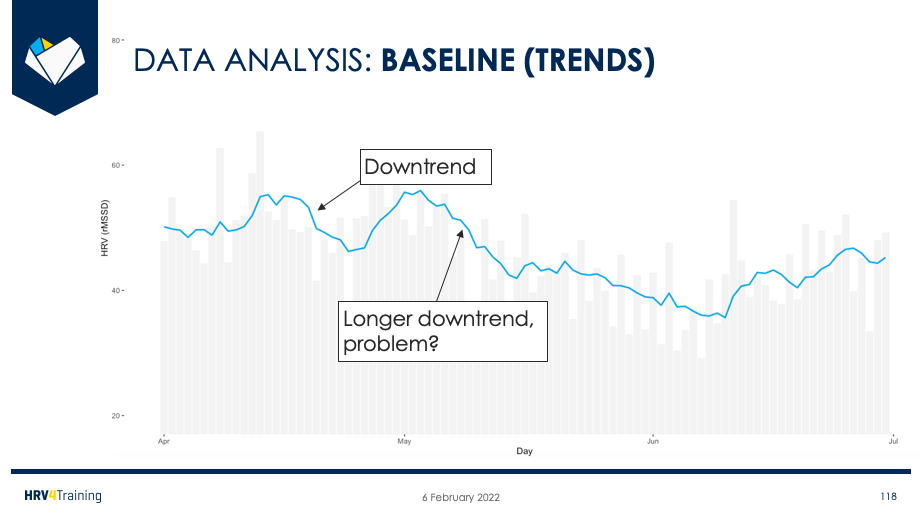 The solution to these issues, is to establish your normal range, or normal values. In HRV4Training we build your normal values based on your past 60 days of data (more info, here). There are no population values for these, you need to collect data for a while in order to be able to determine your own range. Your normal values make it easy to capture meaningful acute drops as well as longer-term, chronic reductions below what is considered normal variability for you. This is based on what we call the Smallest Worthwhile Change in the scientific literature. 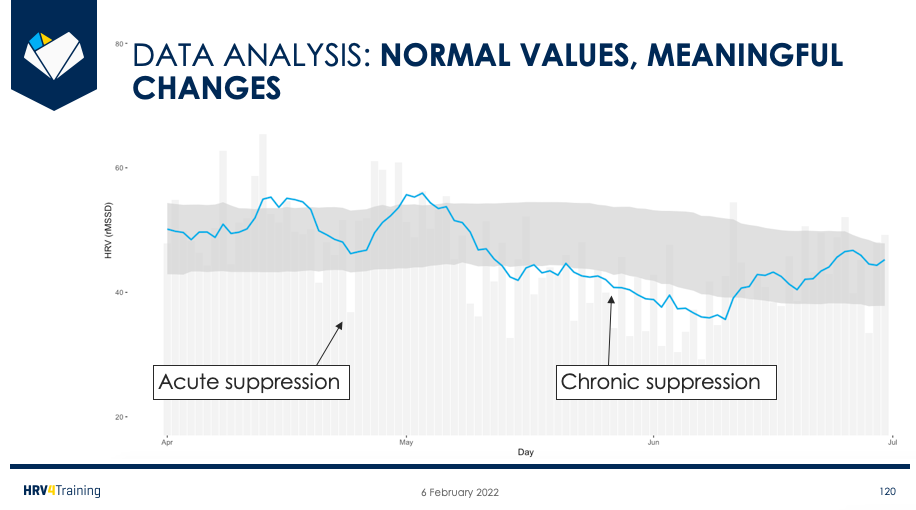 In HRV4Training, you can see your normal values for both heart rate and HRV, on the homepage. This way, you can quickly check if there were any abnormal physiological responses on a given day (acute change), or with respect to your baseline (chronic change). 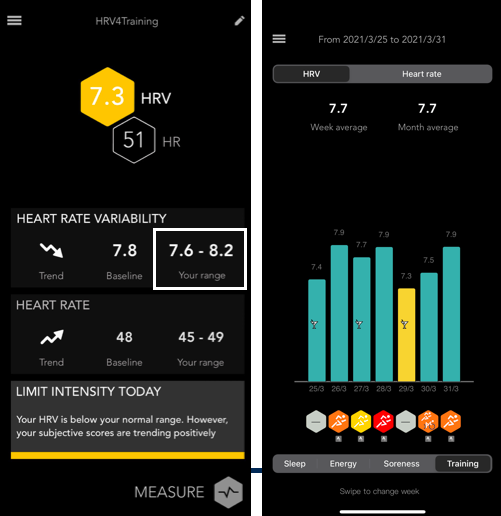 This is the approach currently used by state of the art research on HRV-guided training, which I discuss in this blog. Remember that using HRV requires a mindset shift: from higher is better, to normal is better. Outside of training, the same applies. While many tools out there started converting your physiological and behavioral data in 0 to 100 scores, physiology does not work that way, and it makes little sense to do so. Use a tool that clearly shows you when day to day and weekly changes are outside of your normal range, to make the most of the data. A boring, within-normal HRV is ideal. I discuss these aspects in this blog as well, in point 3, together with other considerations covering:
If you are using HRV4Training Pro, you can see your normal range visually in the baseline page as well. Enjoy! 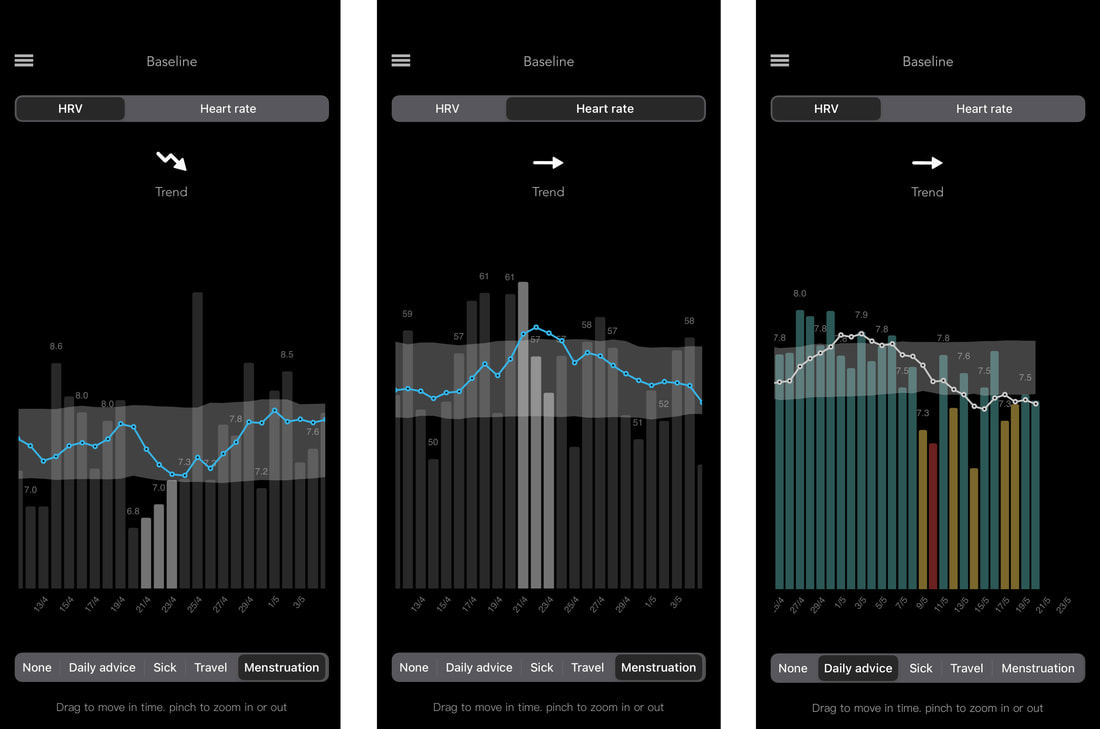 Comments are closed.
|


Register to the mailing list
and try the HRV4Training app! 
|