|
Blog post by Marco Altini
Scosche recently announced their latest sensor, the Rhythm24. The new sensor builds on the previous Rhythm+, and adds a lot of new functionalities, including an heart rate variability (HRV) mode. For a detailed overview of the many functionalities of the sensor, check out DC rainmaker's review here. In this post, we will focus on only one of the many new features this sensor brings, which is the ability to send accurate RR intervals, which can be used for heart rate variability analysis once connected to an app such as HRV4Training. We've been very happy with a few preliminary tests, and would recommend using this sensor to everyone that had trouble with the camera based measurement (for example on some of the non-compatible Android phones) or simply prefers to rely on an external sensor. You can get the sensor at this link or clicking below: If you've been following some of our previous validations, you know that most wristbands, while accurate for heart rate analysis, cannot be used for HRV, as they heavily filter the signal (a procedure typically needed to acquire a more stable signal, less affected by motion artifacts, and therefore able to guarantee a more reliable heart rate during exercise, which is the main target application of such sensors). Let's look at some data.
Data collection
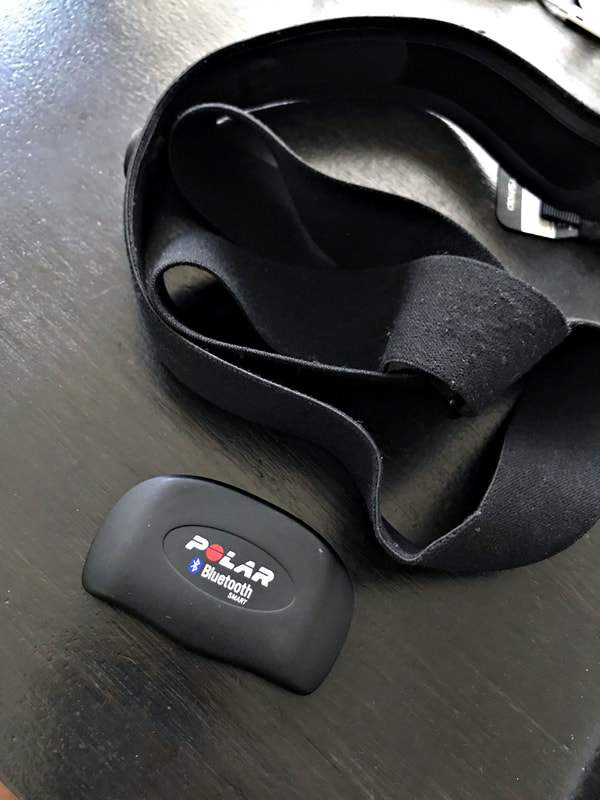
Data was acquired using the rhythm24 sensor and a Polar H7 (previously validated with respect to ECG here), both connected to a different device running the HRV Logger app, which is an app that simply records everything coming from the sensor plus additional features.
During data acquisition, we collected data a few minutes while breathing freely, and a few minutes while deep breathing, to elicitate higher HRV due to RSA. You will see in the plots below visually the effect of deep breathing as we get greater swings in RR intervals. A final note on data synchronization: data cannot be perfectly synchronized because it is not timestamped by the sensors. What we can do is either to log real time and then to split data in windows based on when data was collected, then compute HRV features on these windows or to sum up RR intervals over time. For this analysis we went with the second option and also tried to visually align the data streams.
RR intervals
We will start by looking at RR intervals, the basic unit we need to compute HRV features. RR intervals (peak to peak differences in consecutive heart beats) are provided by the two sensors directly, so we don't really need to do much to collect them, apart from linking the sensor to the HRV Logger app and export the csv files.
As a third comparison, we will add also an RR intervals time series in which we removed artifacts automatically using the algorithms implemented in HRV4Training. While these recordings were taken at rest, we can see one clear artifact in the second subject's data (minute 2), and its effect on HRV features in the next section. Using this simple artifact removal, we can get easily the proper HRV values. 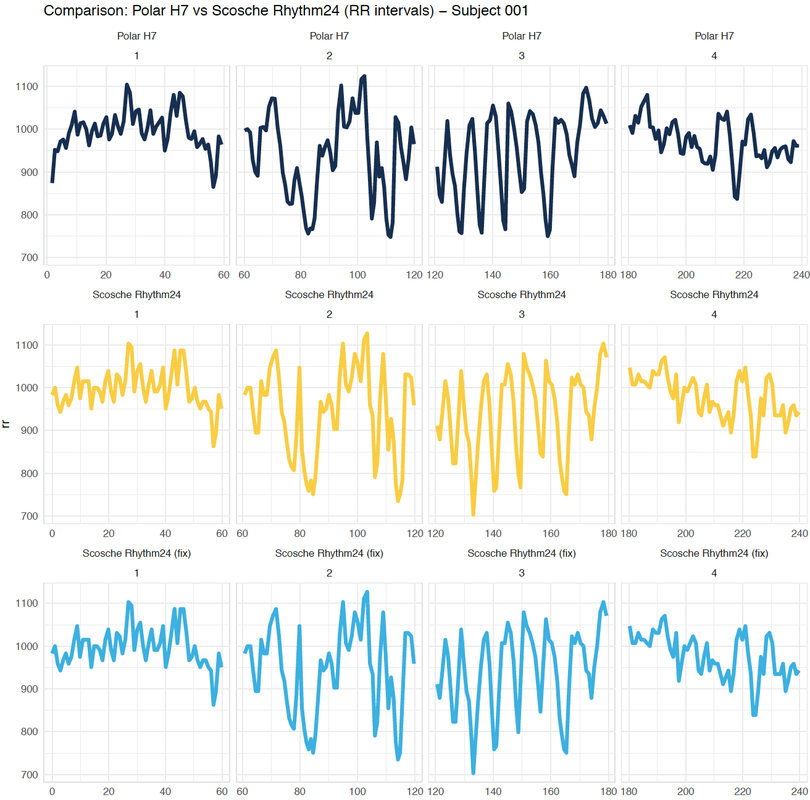
Let's look at data from another person. Here in the second row, second column, we can see an artifact, which does not appear in the first row (Polar data). However, we can also see how applying the artifact removal filter, the artifact disappears (third row, filtered Rhythm24 data).
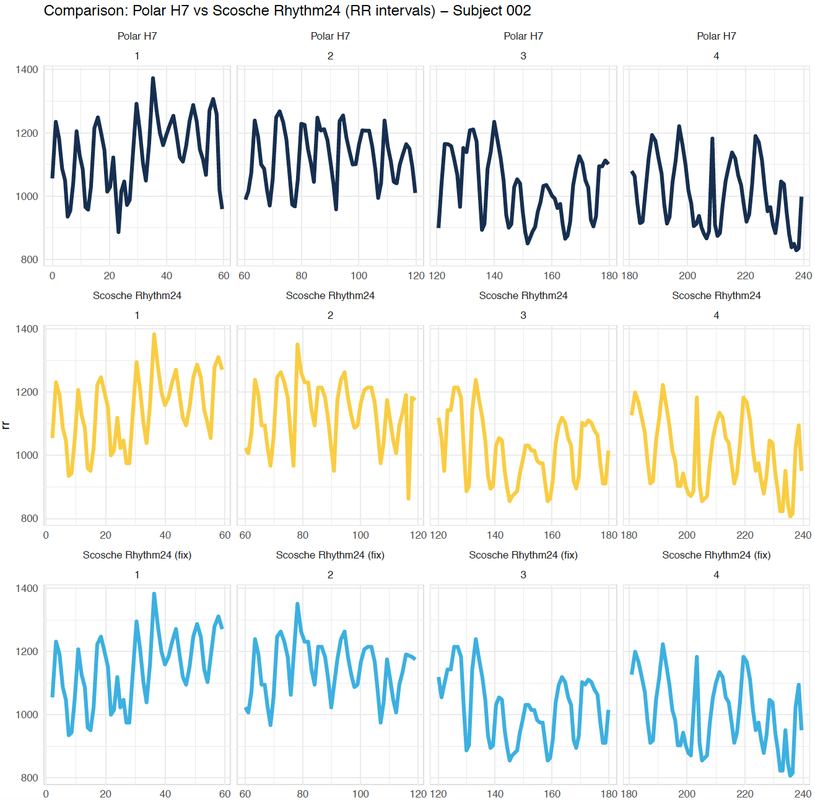
What can we derive from these data? You can see clearly almost perfect correlation between Polar H7 and Rhythm24 for all conditions (relaxed vs paced breathing as highlighted by bigger oscillations in RR intervals or instantaneous heart rate), meaning that the sensor works really well in this modality. Heart rate variability: rMSSD
As features, we will look only at rMSSD, the only feature we really care about. rMSSD is a clear marker of parasympathetic activity and the main feature we use for our analysis in HRV4Training, similarly to what other apps do as well. Additionally, the sports science community seems to have settled on this feature for several reasons (practical as well as it is easy to acquire, compute and reliable over short time windows and less controlled conditions), and therefore we'll stick to it.
What we expect given the data above is to see extremely close values between the Polar H7 chest strap and Rhythm24 data. For the plot below, I computed rMSSD for each time window and subject: 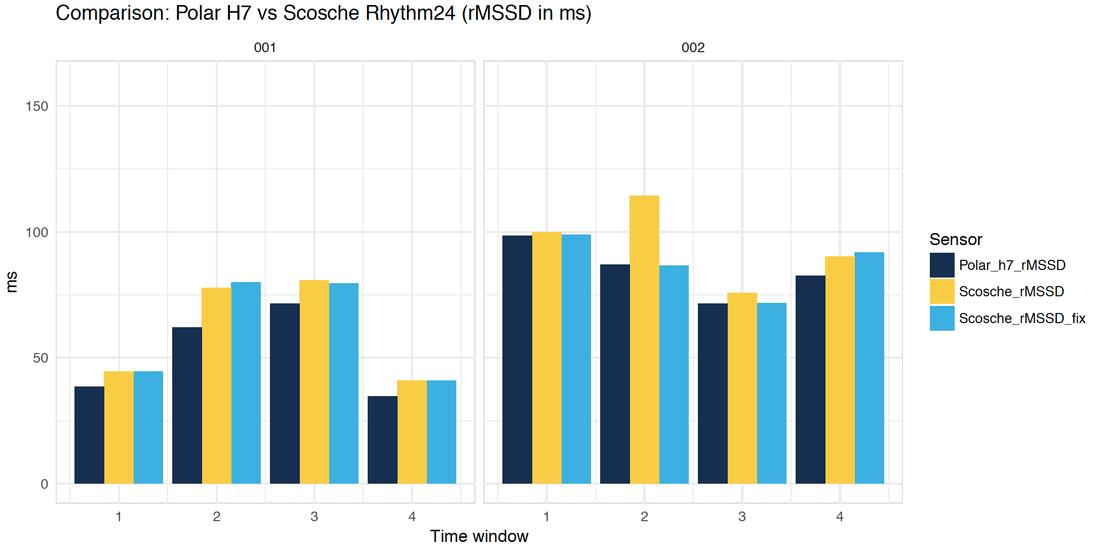
Results are very good considering normal variation in physiology and limitations in data synchronization. However, it is certainly paramount to take care of artifacts, as we can see again in subject 002, second minute of data.
Movement and artifacts
As a final experiment, we tried to add a little movement to the measurement. Nothing crazy, just computer work, a little muscle contraction, etc. If you've been using HRV4Training, you have certainly noticed how it is key not to move while using the camera based measurement, as movement introduces a lot of artifacts. The same applies to the Rhythm24, as it is simply not possible to use optical technologies during movement, when looking at HRV analysis.
Below is an example of two minutes of RR intervals while performing some of the movements mentioned above, and also the resulting very high HRV, which is simply due to artifacts: 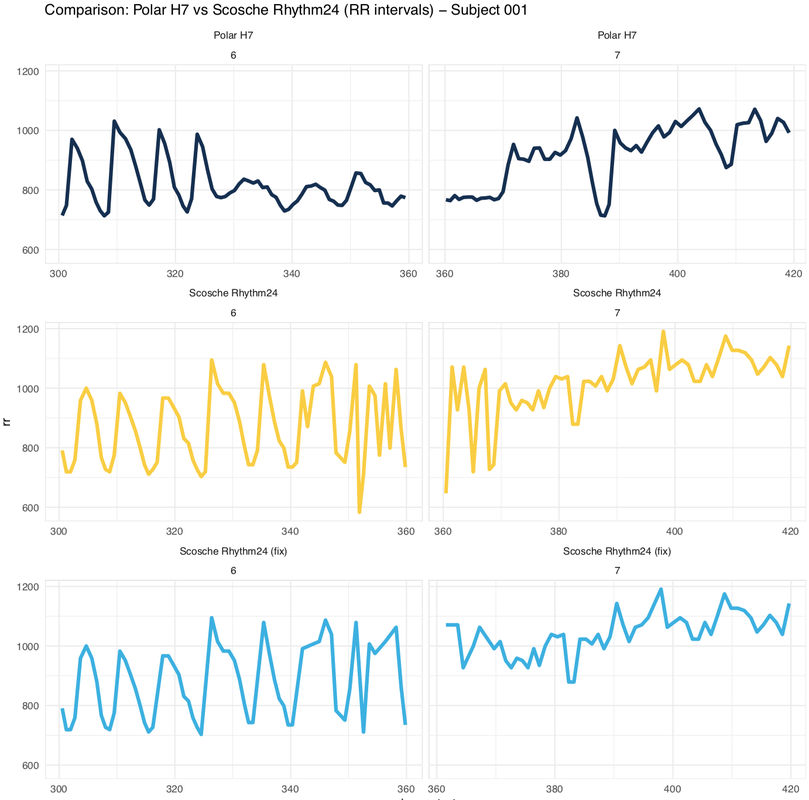
Below we can see the effect of the artifacts on rMSSD:
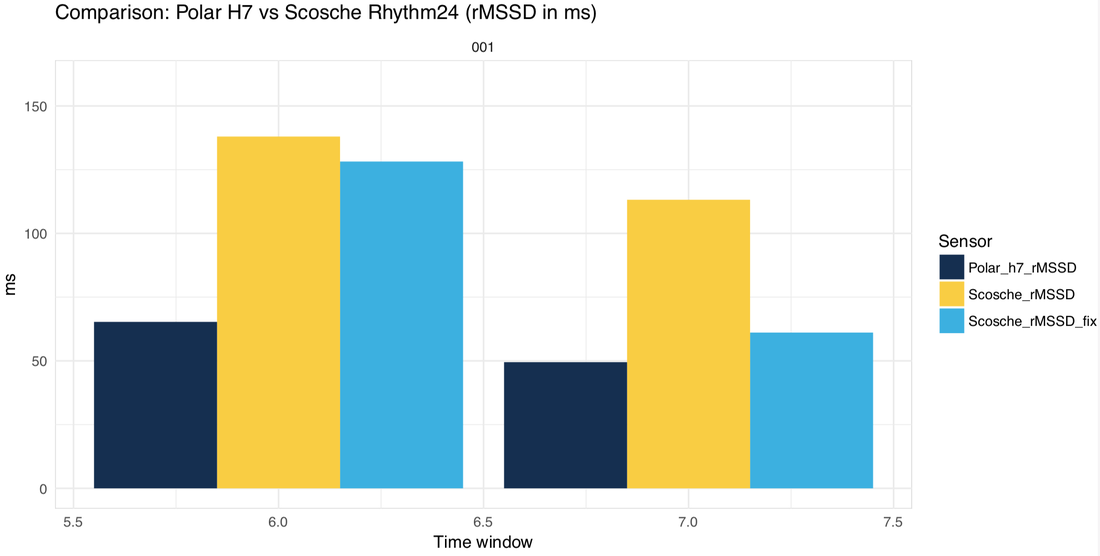
While the artifact correction can recover decently the second minute of data, there were too many artifacts in the first minute. In general, we would recommend staying completely still while measuring, which should be no problem for your morning measurement of chronic stress.
Make sure also to use an app that reports signal quality, so that you will know if something went wrong, and can measure again in that case. HRV4Training will report back to you signal quality after each measurement, based on how many artifacts were found during the recording. We recommend keeping always only measurements labeled as Optimal by the app. Note that it is impossible for a user to understand if artifacts were present when using an app that computes HRV without reporting signal quality, hence the need to avoid using such apps, as artifacts sometimes are simply not avoidable. Real life is messy, we should design for it. Summary and other useful resources
That's all for this post. We are very pleased to see more and more sensors manufacturers spending time to work on 'HRV modalities' in which accurate RR intervals are sent via standard protocols, and hope that more will come in the future, making it easier for users to gather reliable data. Scosche did great work on the Rhythm24, as shown in the plots reported in this blog post. However, always pay attention to data quality and artifacts, as movement highly affects optical measurements. Some additional resources:
Comments are closed.
|


Register to the mailing list
and try the HRV4Training app! 
|