|
Blog post by Marco Altini This is the continuation of a series of posts in which we started analyzing HRV4Training users generated data to highlight interesting relationships between self-reported annotations, actual training data as acquired through the Strava integration & physiological data. As our long term goal is to push further our knowledge on complex relations between physiological data, lifestyle and performance by providing users with a clinical grade tool, and outsourcing data collection to thousand of us, we keep documenting our progress on user generated data science on this blog. In particular, in the last post we investigated the relation between running performance over different distances (10Km to full marathon) and estimated VO2max in HRV4Training, highlighting a strong link between the two, meaning that our VO2max estimate is representative of a user performance, with higher values being associated to running at a faster pace. This is an expected outcome as the whole point of estimating VO2max using workouts data and sub-maximal heart rate is that a person that can keep heart rate lower (with respect to her/his maximal) during a certain effort, can perform better (faster pace) than a person that is already maxing out at the same running pace. This principle is very intuitive and is the main principle behind our estimate. In this post, we will perform a similar analysis but look instead at the relation between physiological data at rest (morning heart rate and heart rate variability data acquired using HRV4Training) and running performance. Do faster runner have lower resting heart rates? What about heart rate variability? Expectations this time are different as we showed already in the past that resting data alone is not a very good predictor of fitness (e.g. VO2max) and therefore we expect this relation to be weaker and less indicative of running performance. Let's look at some data. DatasetData are always messy when acquired in unconstrained free living settings. Here we did some basic cleaning to get to a trustworthy sample of users data. First, I included only entries related to running trainings acquired via Strava (this is not necessarily data acquired via the app, as most users use Garmin watches that automatically upload data to Strava - me included). Then I excluded all non-human speeds or anything above 6.5 m/s. Then I removed all heart rates above 220 bpm. This procedure left us with about 1100 users and 30 000 trainings. At this point I used the remaining of the data to compute user-specific summaries, such as average heart rate during all trainings, maximal heart rate based on recorded data, etc - for this procedure, I included only users with at least 12 trainings collected from Strava, which typically means a period between 2 and 4 weeks of minimum app usage. Anything less was discarded. Based on this data we also computed HR and HRV (rMSSD) per user (average scores), training load (km/week) and estimated VO2max as you can read it in the app. Finally, for each user we grouped trainings around 10Km, 21Km and 42Km, determined the fastest times per person (removing again crazy outliers) and therefore obtained our user performance data. After this procedure, we ended up with more than 500 users. Below you can see age, BMI & gender for the users included in this analysis, as well as physiological data averages (heart rate and HRV - rMSSD): 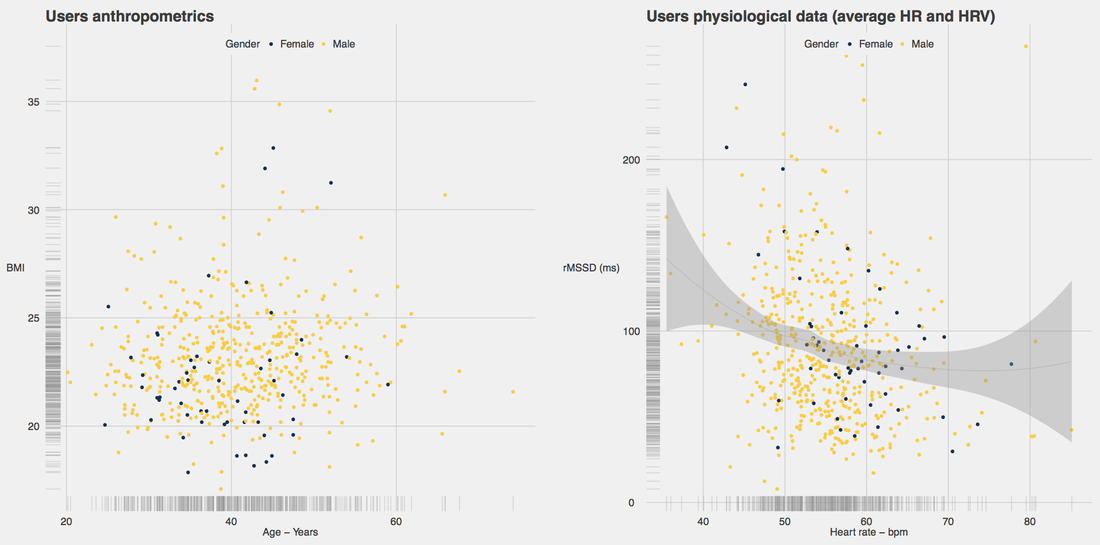 Running performanceRunning performance for each user was determined as explained in our previous post. Basically for each user we grouped trainings around 10Km, 21Km and 42Km, determined the fastest times per person (removing again crazy outliers) and therefore obtained our user performance data. We also split runners in three categories depending on their best times, for example, fast runners are defined as runners that can run a 10Km below 40 minutes or a half marathon below 1 hour and 30 minutes or a full marathon below 3 hours. Average runners get to 47 minute and 30 seconds for a 10Km and 1 hour and 45 for a half marathon and sub 4 hours for a marathon, while slow runners are the remaining ones. Longer distances were given priority, so if your 10 km run is above 40 minutes but your half marathon time is below 1 hour and 30 minutes, you are still considered a fast runner, mainly because you simply might not have raced a shorter distance over this period of time. Below is the same graph we showed in the previous post, with running times over 10km, half marathons and full marathons for our ~500 users involved in this analysis: 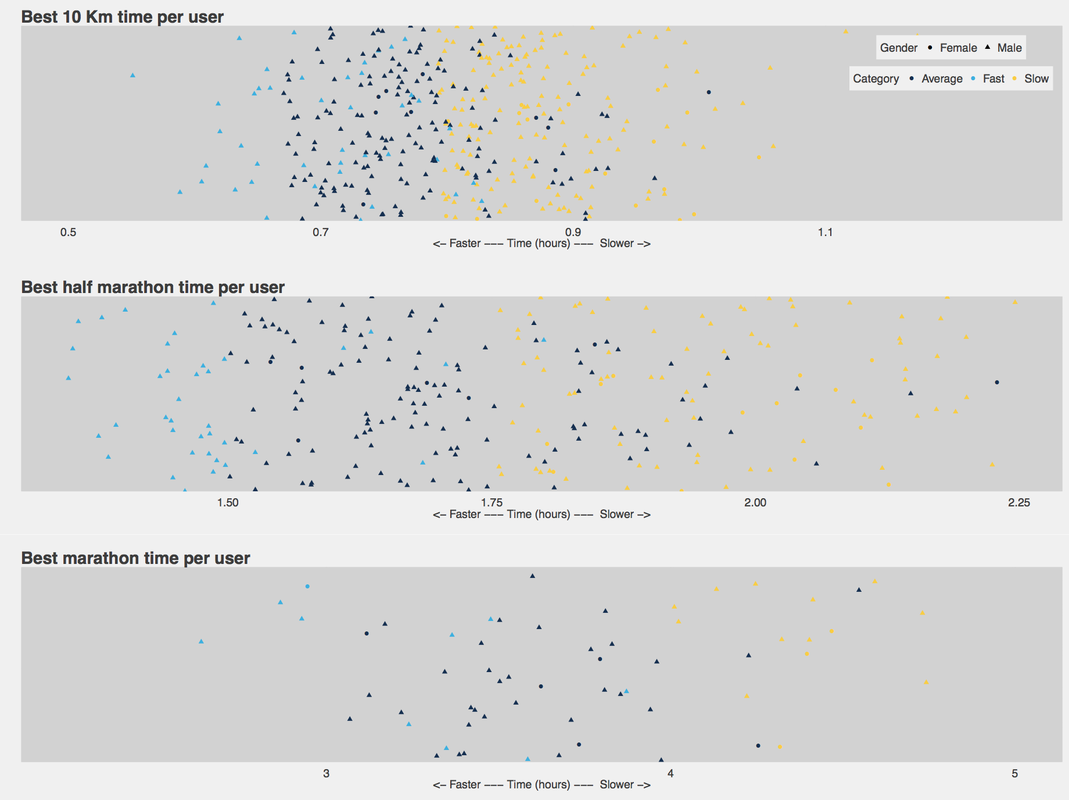 Let's have a look at the relation between running performance and resting heart rate & HRV acquired in the morning using HRV4Training. Physiological data at rest & running performanceWe'll start with resting heart rate. Below we can see the relation between resting heart rate and running performance for 10km, half and full marathons times:  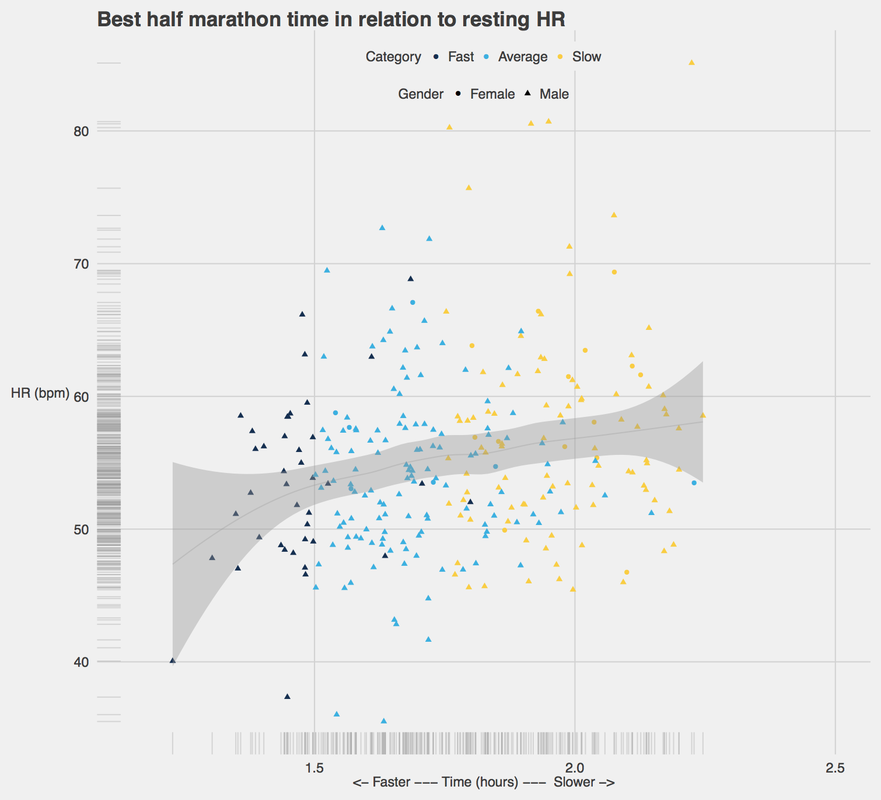 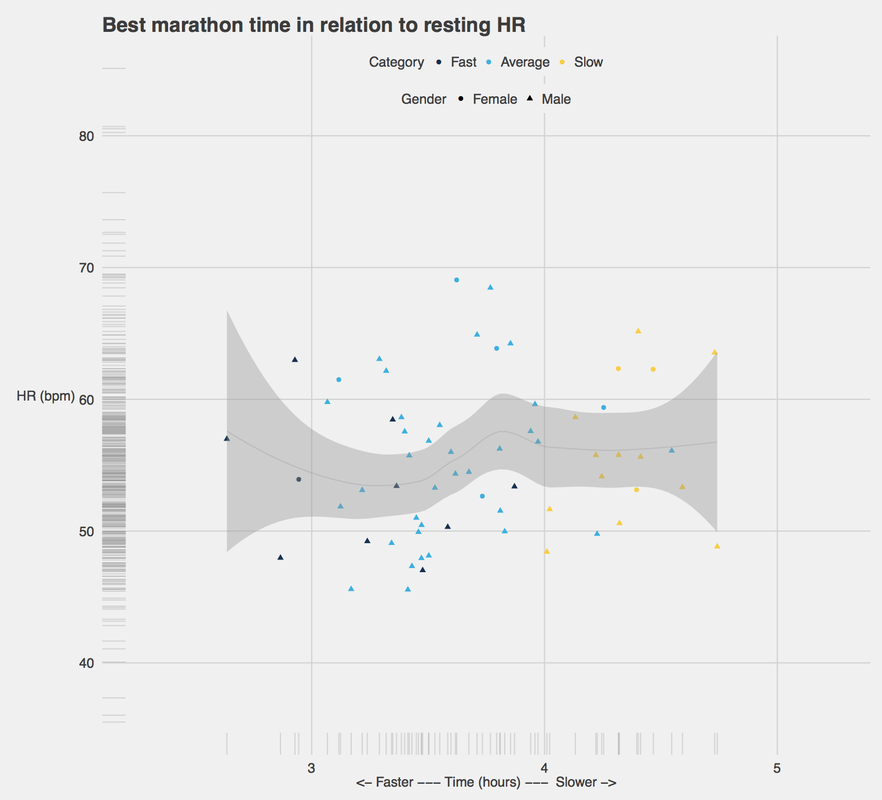 What we see in the first two plots above is the expected relation, with lower heart rates for faster runners, as lower heart rates are typical signs of better fitness level, due to the training effect on the heart muscle. For the marathon data we probably don't have enough to see much of a relation, and in general, while we do see heart rate increasing with slower times in the first two plots, we also see much variability, with fast runners (blue symbols in the first plot for example) ranging from below 40 to almost 70 bpm. This variability highlights difficulties in predicting performance and fitness using only rest data, as clearly the relation between these variables is rather weak. Let's look at HRV (rMSSD) data for the same people: 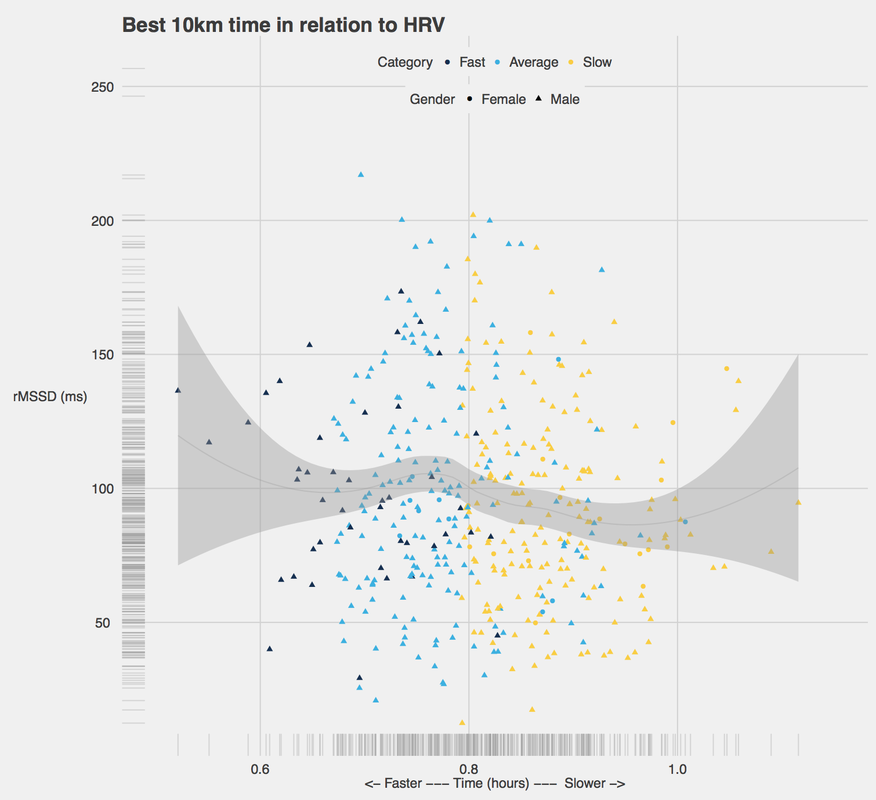 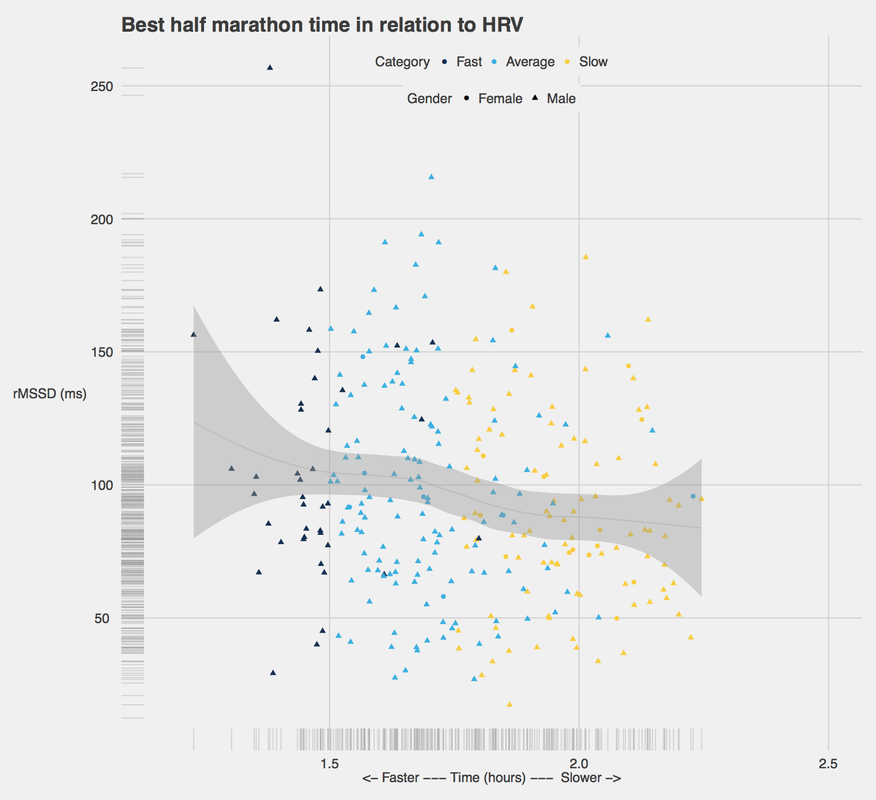 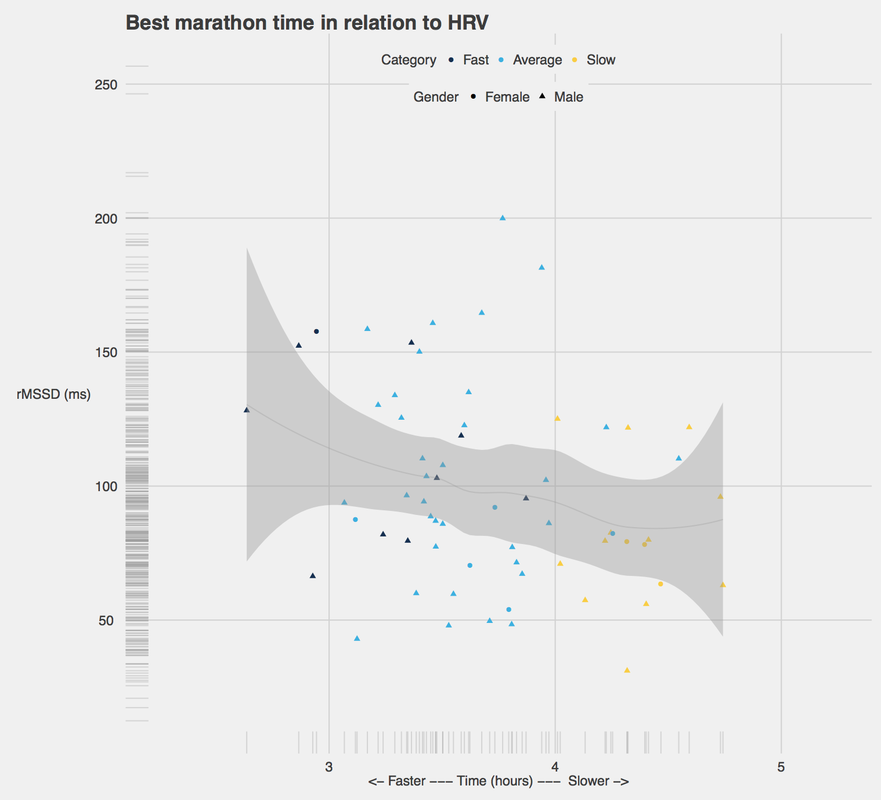 In the three plots above, we can see the inverted relation between HRV and racing time, with higher HRV being associated with faster times. I find these data more interestingly than the previous one on HR, as there is more controversy on HRV being representative of fitness & performance or not. However, similarly to what we said for HR, we also see much variability, with fast runners covering a very broad range of rMSSD values, similarly to slow runners. This means that even though the tendency is that rMSSD is slightly higher for faster runners in this dataset, this variability highlights difficulties in predicting performance and fitness using only rest data, as clearly the relation between these variables is rather weak. An rMSSD of 100 can easily belong to a 1:20 half marathon runner, as well as to a 2 hours half marathon runner. And finally, a bit of a clearer picture grouping all runners together based on their "pace category", for both heart rate and HRV: 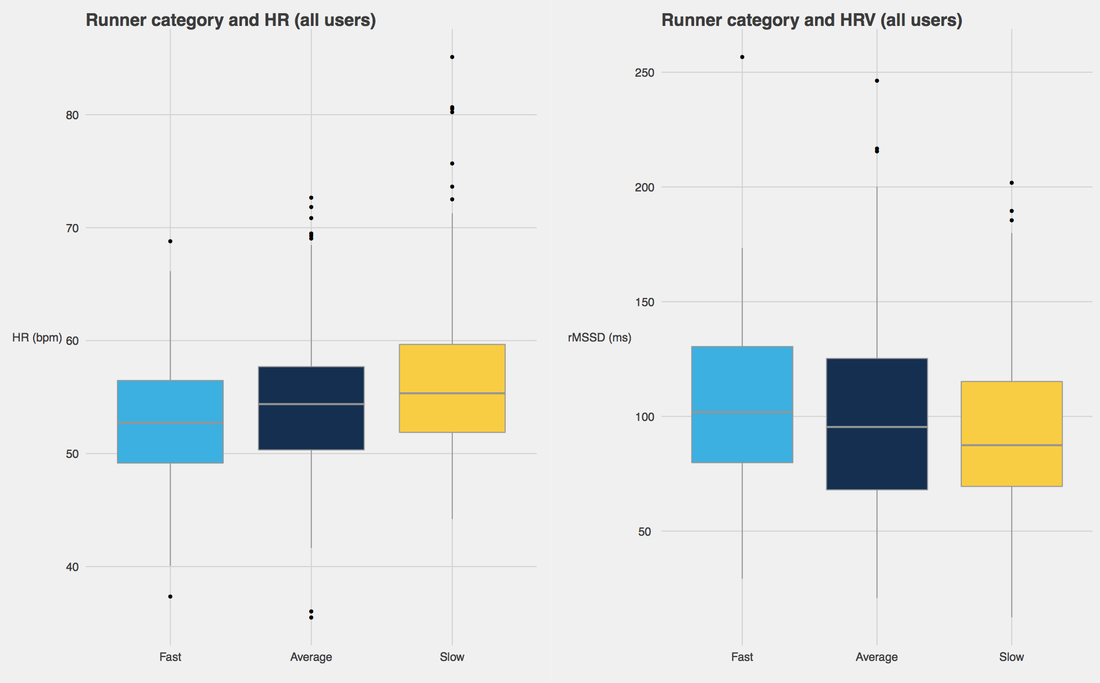 Grouping data makes it a bit easier to see the trend with HR slightly increasing as runners get slower, and HRV decreasing as runners get slower, however there is much overlap between the three categories, while we had a much better separation when looking at estimated VO2max and running category, meaning that estimated VO2max was a much better predictor of running performance, with respect to rest heart rata only. What about age?An important parameter not to be overlooked when analyzing HRV data is age. We know the strongest link between any anthropometrics or training variable and HRV is the inverse relationship between HRV and age, so HRV lowering with age. As we collect real life data on a very broad range of users (aged 20-80 years old), instead of the typical ten 20 years old male runners found in studies, we need to analyze the role that age plays in the relation between running performance and HRV. Below you can see the same plot as the one above, but breaking down the analysis by age group as well, for each performance category. We can see that as expected there is no difference in resting heart rate between age groups, and the main difference seems due to running performance, with faster runners, who potentially train much more, displaying lower heart rate. On the other hand, in the HRV plot we can see huge differences due to age, as each performance category shows that no matter how fast the runner, HRV will be much lower for older individuals. We still see there is a small trend with HRV being a bit higher for the fastest group, however once again there is much overlap (and a not so big sample, especially for fast runners): 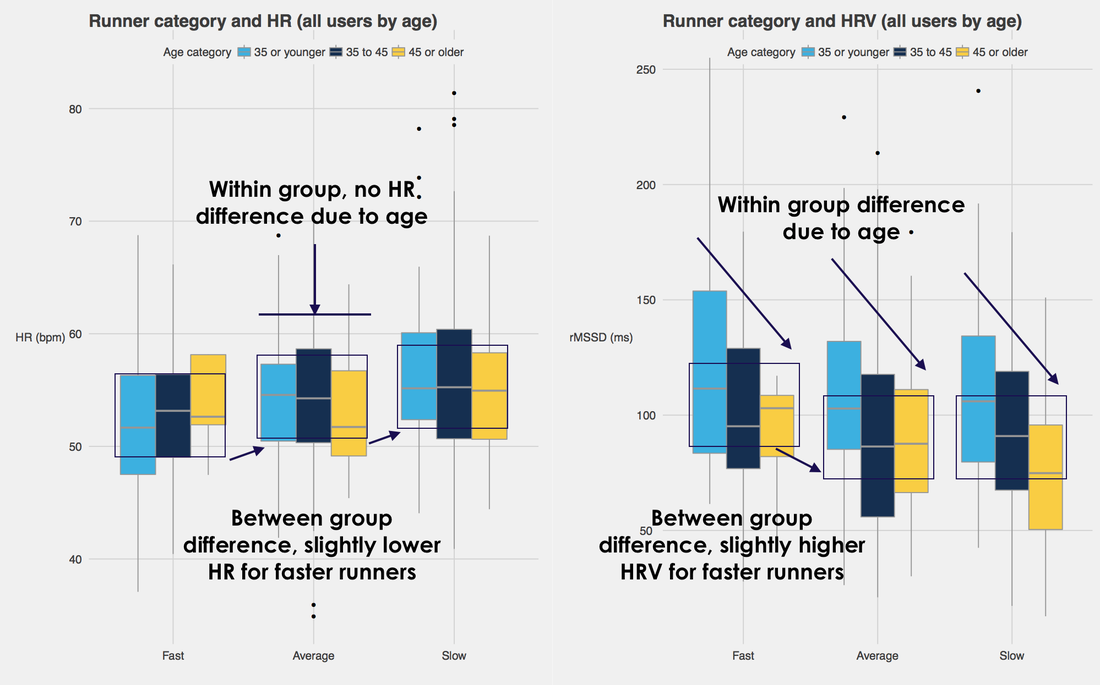 SummaryIn this post, we looked at the relation between physiological data at rest (morning heart rate and heart rate variability data acquired using HRV4Training) and running performance. We saw that we have a but consistent relation between physiological data at rest and running performances, for both heart rate and HRV data. HR seems to decrease quite consistently with improved performance / fitness, while the relation is less linear for HRV, and while there is much overlap between the different categories, it seems that faster runners do have a slightly higher baseline rMSSD on average.
As we see much variability in physiological data at rest between different categories of runners, it is unlikely that running performance can be predicted accurately based on these data. On the other hand, our VO2max estimate was a much better predictor of running performance, as shown in our previous post. Morning recordings of HR and HRV data remain invaluable metrics to assess day to day load and analyze recent trends that provide unique insights on your physiological stress level, recovery, adaptation to your training plan and risk of overtraining. However, these metrics are not ideal in the context of estimating running performance.
2 Comments
Andrew Jaymes
10/11/2016 07:22:43 pm
Marco,
Marco Altini
10/11/2016 11:45:42 pm
thank you Andy! Your comment will be posted after it is approved.
Leave a Reply. |


Register to the mailing list
and try the HRV4Training app! 
|