|
Blog post by Marco Altini.
What didn't work
I believe we've made great progress in addressing some of the major limitations of the previous daily advice, that we also discussed a few weeks ago in another blog post. In particular, we previously highlighted how the daily advice completely relied on acute HRV changes to provide guidance, as introduced in one of the early HRV papers by Kiviniemi et al., and how this approach mainly fails because of two limitations (as acute HRV changes we mean changes in HRV with respect to yesterday or your recent baseline, typically a 7 days moving average of you scores).
The first limitation being that small HRV changes are often sufficient to swing your daily value above or below the baseline, and therefore create confusion in terms of interpreting what we should be doing on a given day. This problem also often caused doubts as to the app's usefulness as repeated measures are often slightly different, simply because our physiology is never in exactly the same state, and again sometimes these small differences were large enough to cause the daily message to be the exact opposite. The second major limitation of the daily advice was the failure of it to look beyond the current week, as only the past week of data was used to construct the baseline. Therefore, it failed to capture the big picture. If you are above your baseline but your baseline is much lower than your normal, is it still a good day? Probably not. We built several advanced features to cope with these limitations, such as the HRV trends analysis (see how you can use it here). However, we believe that we have now found a better way to provide a more meaningful daily advice and provide better guidance on a daily basis without being affected by the limitations above. Dealing with small variations; measures repeatability and your normal values
The first step we took was to start looking at the data differently. Your baseline is simply a more stable version of your daily score. It shows how your recent data is looking, but it doesn't say much about what your normal values are, and if your daily score is within your normal values or not. Your baseline could be completely below your normal values on a bad week, and the app would fail to see it. Not anymore.
We now use part of your historical data (details later) to determine what your normal values are. Your normal values, sometimes called "being within your SWC or smallest worthwhile change", are typically quite a broad range as HRV data changes quite a bit on a daily basis. We then look at your daily score with respect to your normal values, and no longer with respect to your baseline, so that we can both analyze acute changes as variations with respect to yesterday and your recent baseline, as well as not loose sight of the big picture, which is defined as your normal values over your past 2 months. This way your normal values are continuously updated and you don't need to worry about setting a specific time frame. Here is some data that Dan sent me which shows the points explained above: 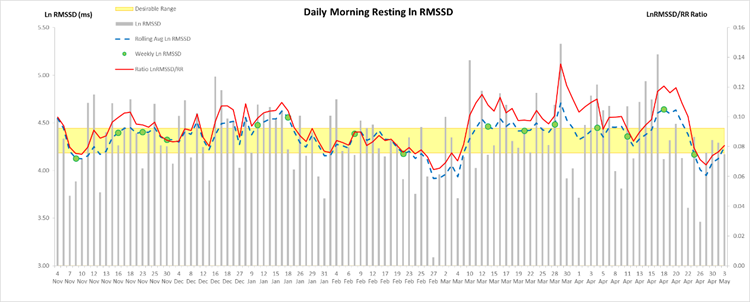
For now let's focus only on some of the parameters above. We have the daily rMSSD value, which is similar to your recovery points in the app. We have the rolling average, which is the baseline in the app. And we have the desirable range shown in yellow, which is our new "area including normal values". Basically, as long as you are within this area, nothing really has changed in your physiology, from a cardiac autonomic nervous system perspective.
You can see in the image below, which shows how we brought these parameters to the latest HRV4Training: 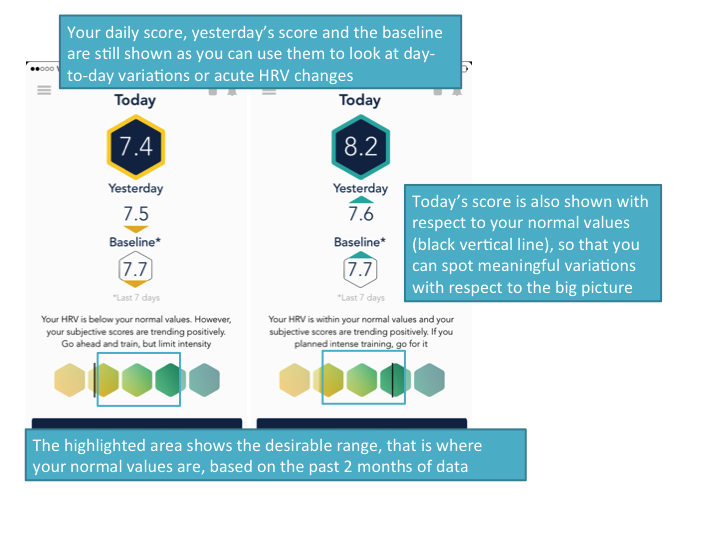
How do you feel?
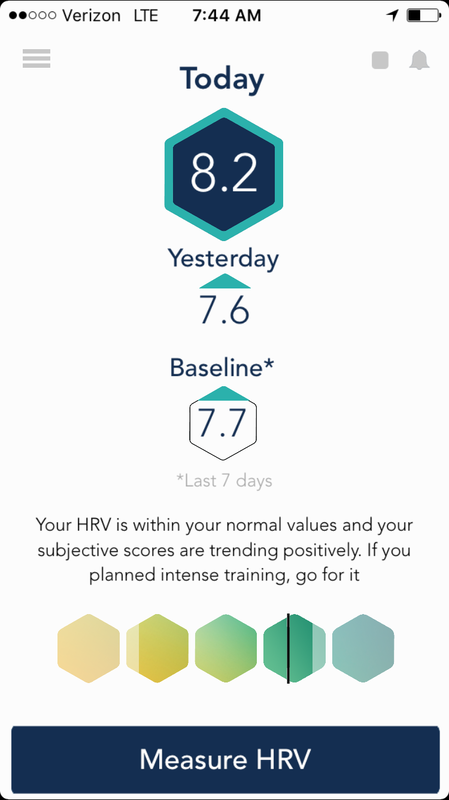
While we addressed the previous limitations already, we decided to enhance the daily advice with subjective reports. Obviously, while HRV is great marker of recovery, it's not all about HRV. Additionally, there are more complex situations where the typical "higher is better" do not apply, and we need to be able to discriminate those as well.
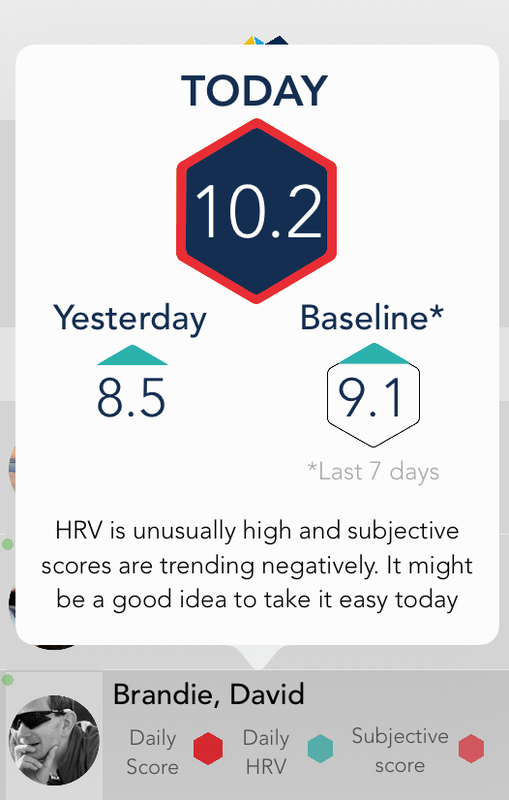
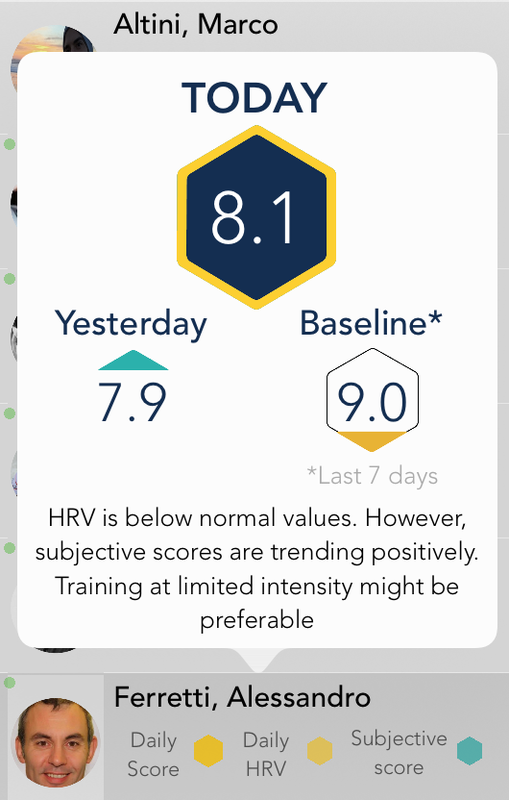
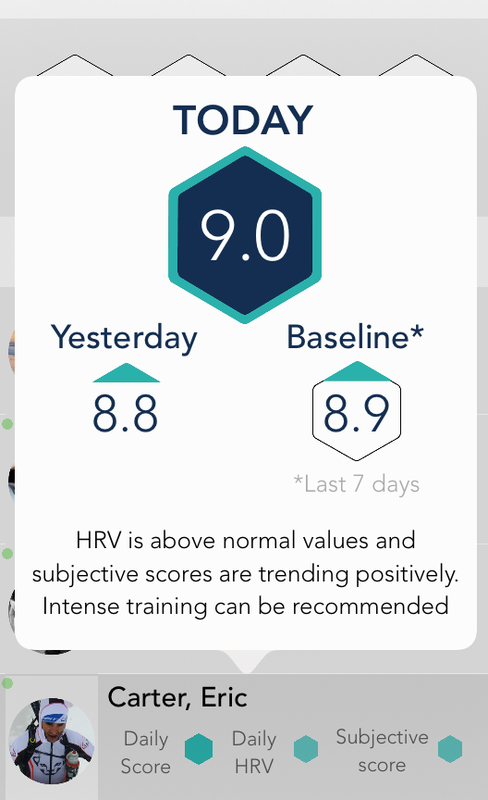
For these reasons, we now combine HRV data with respect to your normal values and subjective scores to provide you with a new daily score, green, yellow or red and associated message. You can see some examples of this approach in the screenshots above as well as later on when we show these improvements in the Coach app. As subjective scores, we are currently including your sleep quality in the past few nights, motivation to train and your perceived performance in your past few training days. If you don't use all of these tags, we will take the subset you use to compute your subjective score. We chose these metrics specifically as they are typical the ones that predict “readiness to train” the best we find. Finally, for users that collect enough data, we also include your normalized HRV trend to spot particular cases not addressed otherwise. As the desirable range and trends are also included in the daily advice, with time, the app will get better at providing you with daily guidance around your training. We believe that the current score should be a substantial improvement on the previous one, but will keep iterating on a series of parameters, for example the duration of the period used to determine your normal values, the standard deviations to consider as we define what is normal (currently 1.5), the parameters to include as subjective metrics, etc. Taking it to the next level in HRV4Training Coach
We will also be releasing a new version of HRV4Training Coach, that will provide the exact same visualization shown above in Dan's notes, plus a few additional features that should help Coaches to get additional insights to their athletes and players from the data we provide. Here is an example:
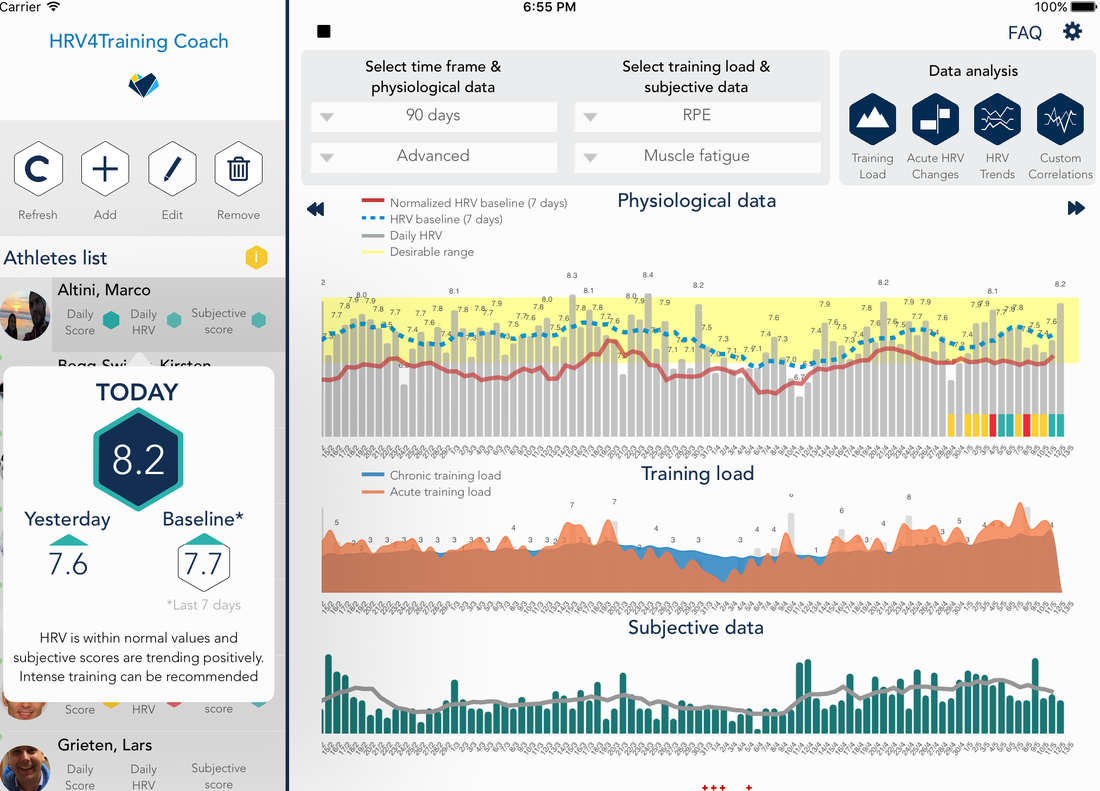
As you can see the Coach app shows daily measurements, desirable range, baseline as well as the daily advice as provided in the regular HRV4Training app, also shown at the bottom of the daily HRV scores in the top plot (small green yellow and red bars). This way you can also look back and see what the app reported each day.
We also included acute and chronic training load plots on the same view so that HRV and training load data can be analyzed together. The same features are obviously present for users using HRV4Training Coach for themselves, without necessarily monitoring others. Simply select "Advanced" as "Physiological data". Here are some additional examples from users that were kind enough to share data with us during development of these new features:
That's all for now. As usual, we will keep iterating and improving these features based on everyone's feedback. We hope you'll enjoy the new daily advice!
Like the app and the blog?
If you like the app and or the blog, take a minute to review HRV4Training on the Apple store. Thank you!
HRV4Training on Facebook
HRV4Training is on Facebook. We use this page as a centralized place for feedback, discussions, feature requests, bug reports and to introduce new features and changes in the app.
Especially for the ones that are not much into Twitter, feel free to use the Facebook HRV4Training page as a place to open discussions around HRV, training, performance and more.
0 Comments
Your comment will be posted after it is approved.
Leave a Reply. |


Register to the mailing list
and try the HRV4Training app! 
|