HRV4Training
|
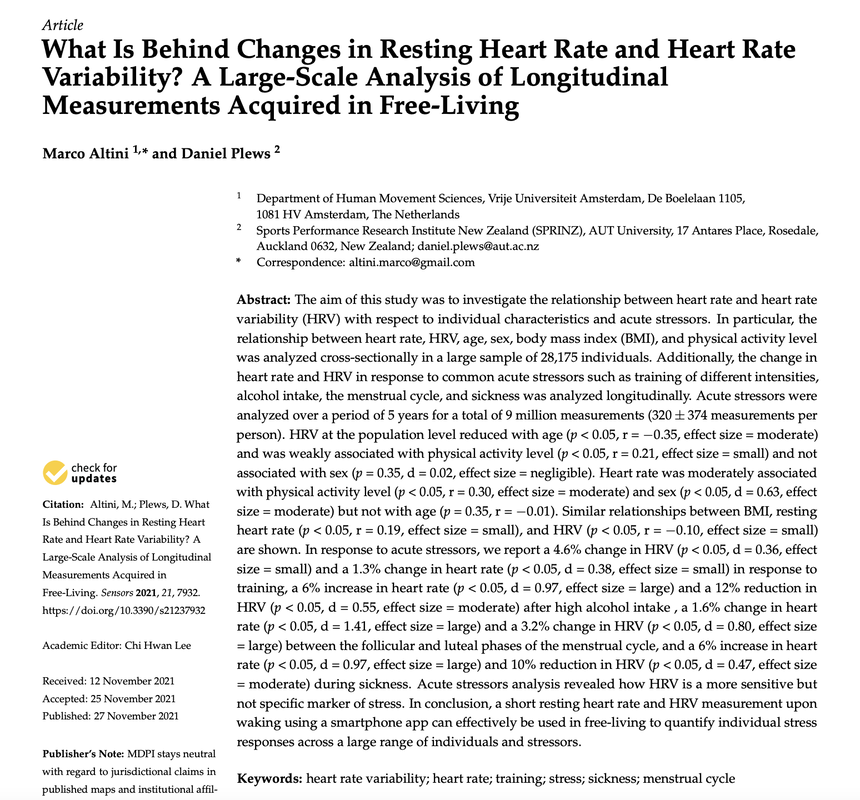
Blog post by Marco Altini In the second part of our latest paper, we analyzed individual stress responses to:
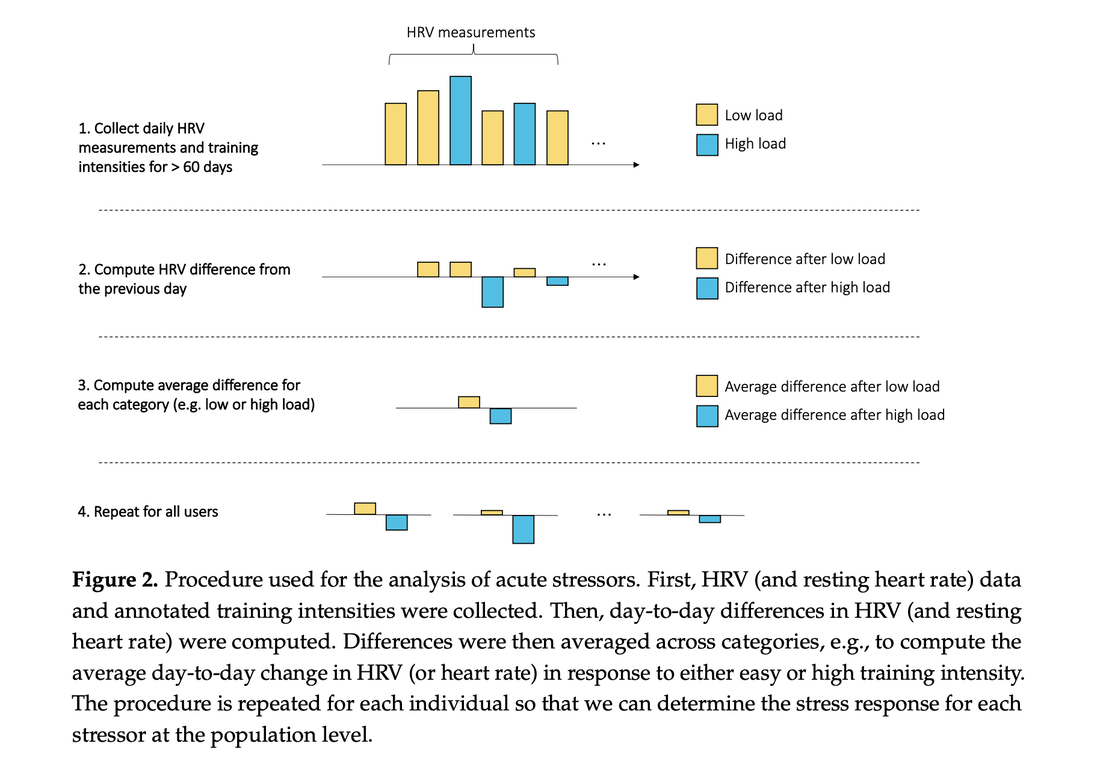
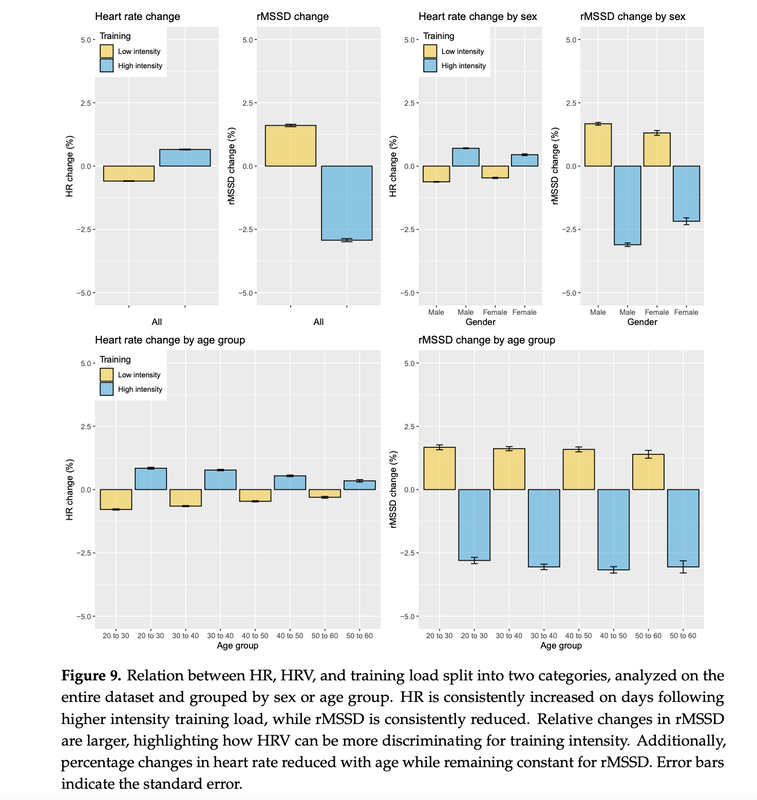
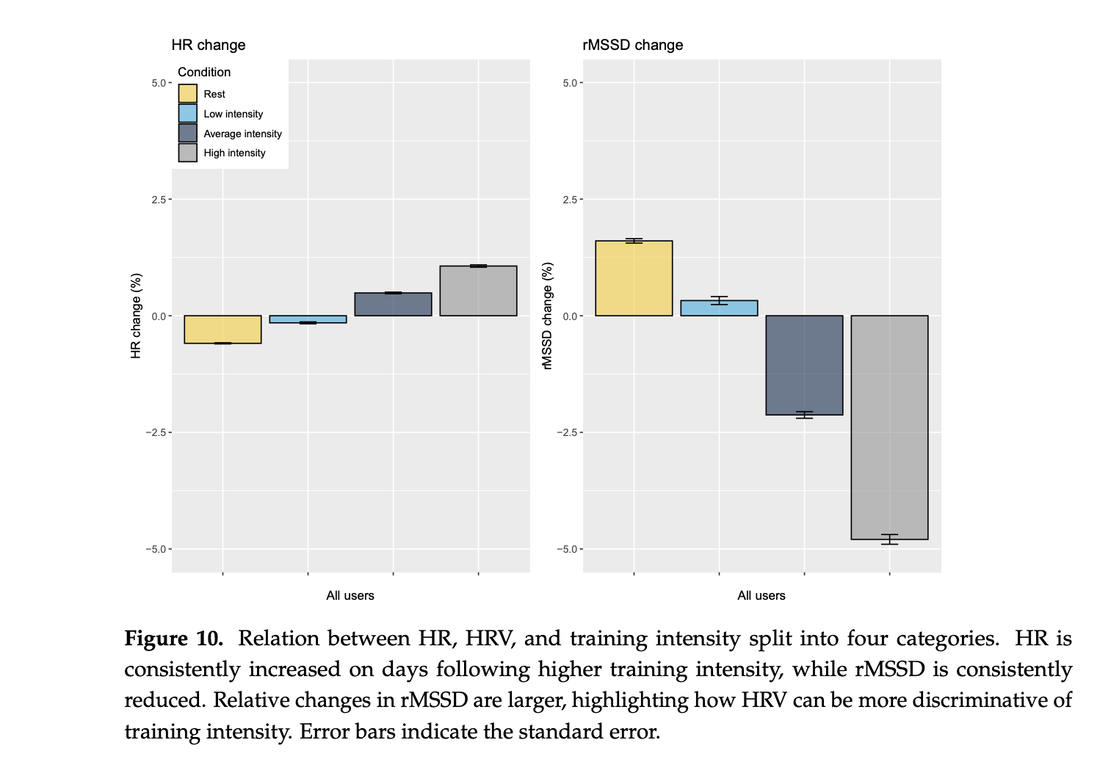
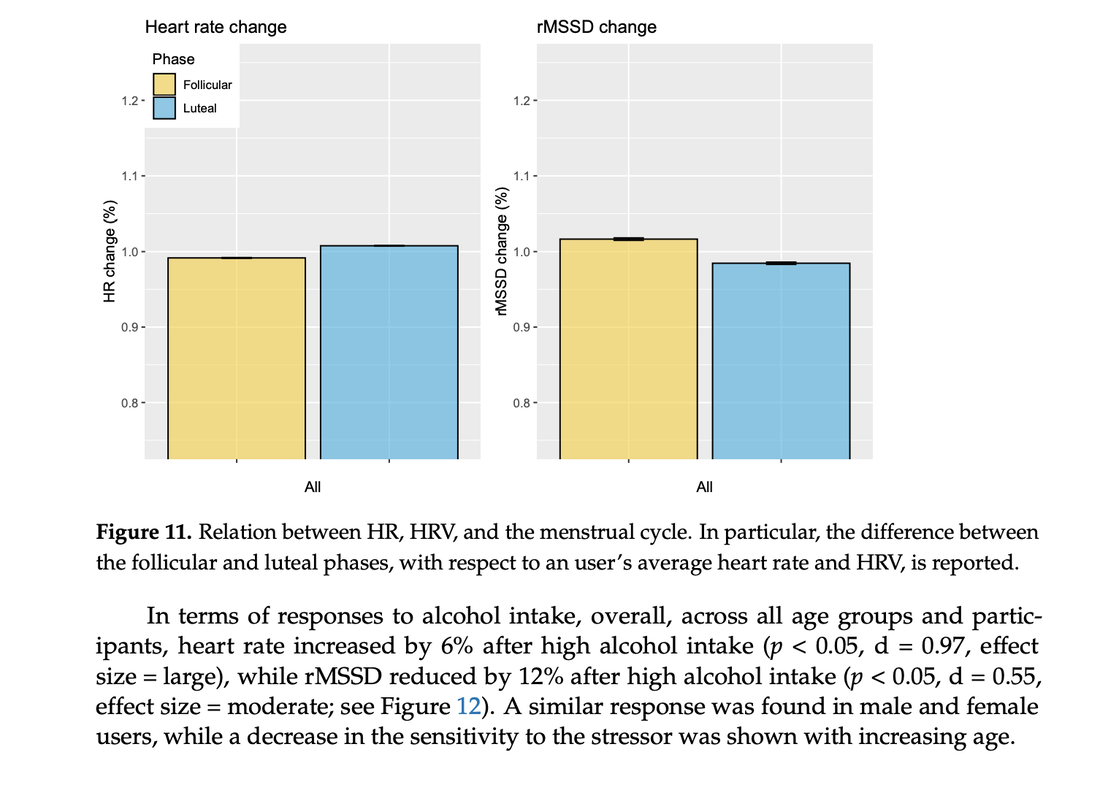
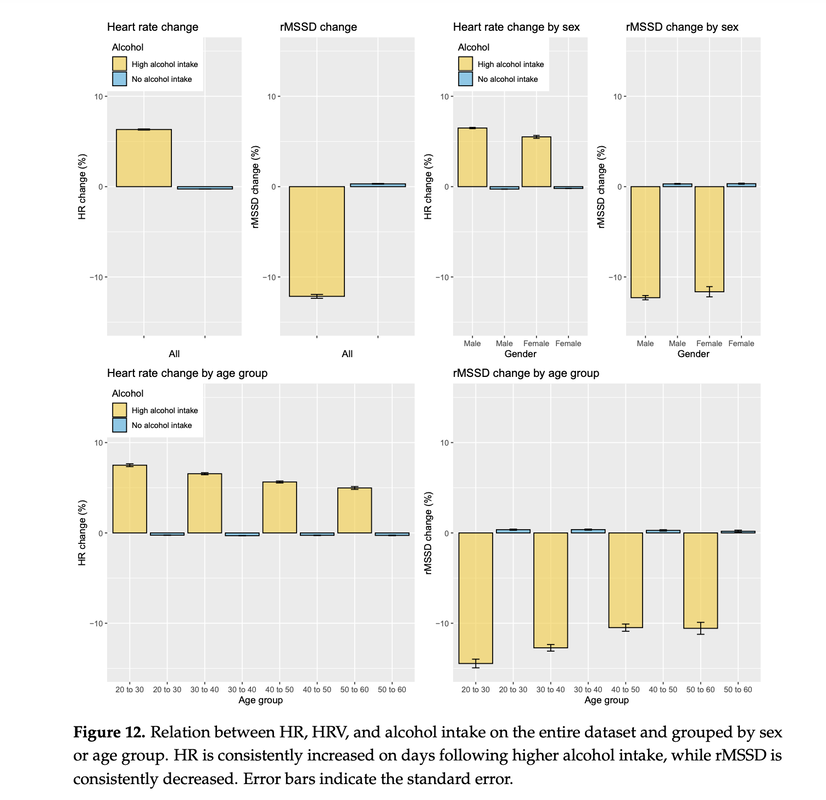
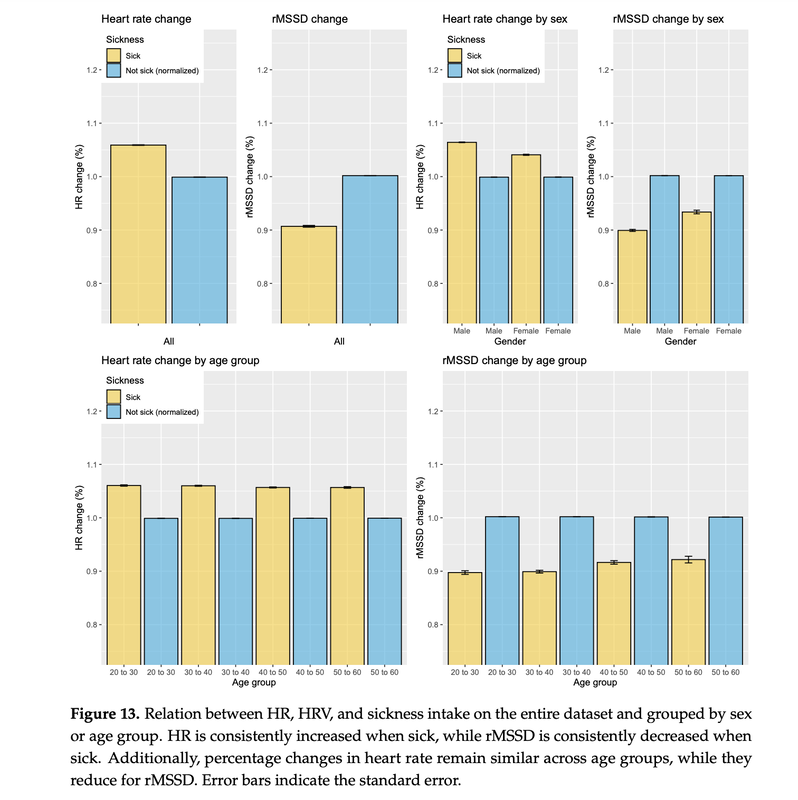
Using 1 year of data per person, for 28 000 people. This is in my view the most interesting part of the paper Why? This type of analysis allows us to answer important questions: Can a morning measurement capture individual stress responses effectively? Is it worth the trouble to look at HRV, or is HR enough? What is the difference between the two, when it comes to stress responses? Data collectionMeasurements and annotations (training intensities, sickness, etc.) were collected using HRV4Training, first thing in the morning Most measurements were taken with the phone camera (validation here). Let's quickly look at our analysis framework first. How do we analyze individual stress responses? For each person, any given day there will be many stressors. However, if we take hundreds of days of data per person, and look at one stressor at a time, we can isolate the stressor and better understand its impact on resting physiology. What did we learn?Training intensityBelow are the results for training intensity (low vs high-intensity days). The change in HRV is 4.6% while for heart rate is 1.3% (with respect to a person's average). HRV is therefore more sensitive to this stressor. The change in HRV does not reduce across age groups, indicating how HRV captures training stress equally well for older individuals, while the change in HR reduces. Additionally, women tend to have a less marked response (more about this later) We also split the annotated intensity into four categories, as shown below. Once again we can see how HRV is more sensitive to changes in training intensity, but also how these measurements capture very well self-reported training intensities: Menstrual cycleThe change in heart rate was 1.6% between the follicular and the luteal phases, while the change in HRV was 3.2%. Once again, HRV is more sensitive. These differences might also be the reason why other stressors show somewhat less marked responses in women. Alcohol intakeChanges in alcohol intake are 3-4 times larger than changes due to training or the menstrual cycle (6% change in heart rate and 12% change in HRV). SicknessNot surprisingly, sickness is also a very strong stressor, similarly to alcohol intake (6% change in heart rate and 10% change in HRV). What are the implications?When using HRV for training guidance, lifestyle is key, and poor lifestyle or health issues will take over. A holistic approach to health and performance is needed. Strength of the stressorTo recap, changes due to training intensity and the menstrual cycle are typically 3-4 times smaller than changes due to sickness or alcohol intake. Changes in HRV are 2-4 times larger than changes in heart rate in response to the same stressors. InterpretabilityWhen we contextualize the percentage changes reported in this paper with what we know from literature, e.g. that the smallest practical or meaningful change in heart rate is 2% and in HRV is 3%, we can see how changes in heart rate are below this threshold, and therefore smaller than normal day to day variability.
This means that heart rate is not sensitive enough unless we have very strong stressors (e.g. alcohol intake or sickness). This also means that while HRV is more sensitive, it is also less specific, as shown by the typically smaller effect sizes. In other words: changes in heart rate are often of no practical utility (smaller than daily variability). On the other hand, higher stress will be reflected on HRV data no matter where it comes from and it might be difficult to get to the source (context is key). We speculate that these findings might lead to new forms of HRV-guided training, where rest days are prescribed based on large changes in HR (as these capture only very strong stressors), while training intensity is modulated based on more subtle HRV responses. You can find the full text of the paper, here. Thank you for reading Comments are closed.
|
Register to the mailing list
and try the HRV4Training app! |
