|
Blog post by Marco Altini.
Two studies were recently accepted for publication / published, looking at HRV & training in different populations. I had the chance to read both in the past few days, and in this post I will show you how you can explore the researchers' findings in your own data. The two studies I am referring to are the following:
While we still have a long way to go to make HRV tools easy to use to athletes and sport enthusiasts, we really made significant progress in the past few years. It is now widely accepted (as shown by the studies above), to collect data with home-based recordings, as short as 60 seconds. It is also clear that physiological changes (e.g. reductions in HRV or increases in HR) typically follow intense workout sessions. However, what researchers are trying to do right now, is to better understand how these changes fit in the big picture. If we guide training based on HRV measurements and reductions from a baseline, or long term baseline drops, can we improve performance? What other metrics can we look at which might be representative of better overall fitness and adaptation to training load? Vesterinen and Flatt answer to some of these questions. Since top scientists in the field are using easily accessible tools, as a user of these tools, you have the unique opportunity to try immediately if these findings are relevant to your case. What I want to do in this post is to briefly summarize their findings, and show you how you can look at very similar parameters as they are provided in the Insights section of HRV4Training, to adapt your training plans. Individual endurance training prescription with heart rate variability
I will start with the first article I've read, the one of Vesterinen et al. In this paper, the authors recorded data for 4 minutes in a home settings, and defined an HRV-guided training regime. This approach was used also by Kiviniemi et al. in the past. However, Vesterinen introduced an interesting change to the protocol. While in previous studies HRV-guided training meant looking at acute (day to day) changes in HRV, similarly to what most apps do, Vesterinen looked at longer term changes. Since most athletes would proceed with intense "training blocks", instead of just "training days", it makes sense to look at HRV baseline changes over time, and determine when is the right time to approach a new intense training block.
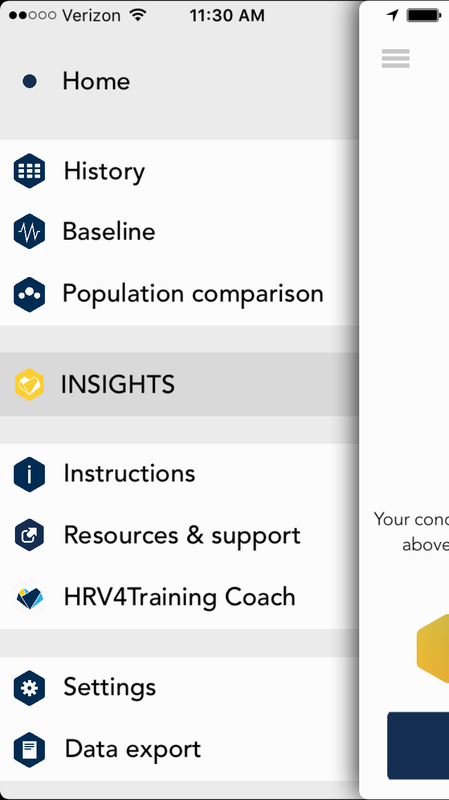
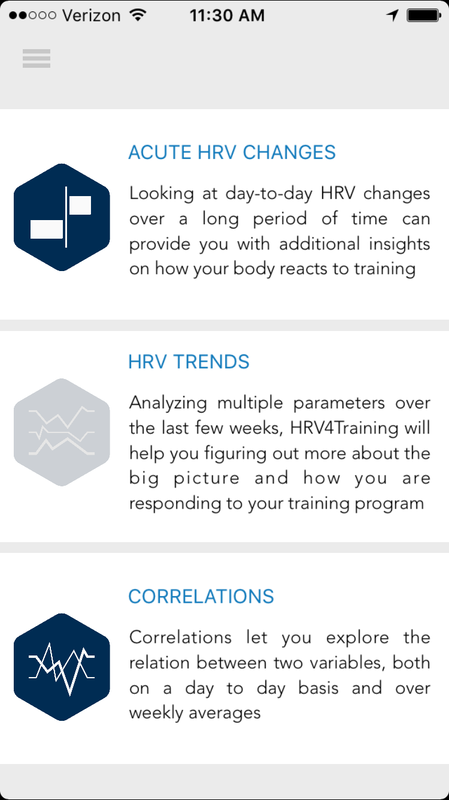
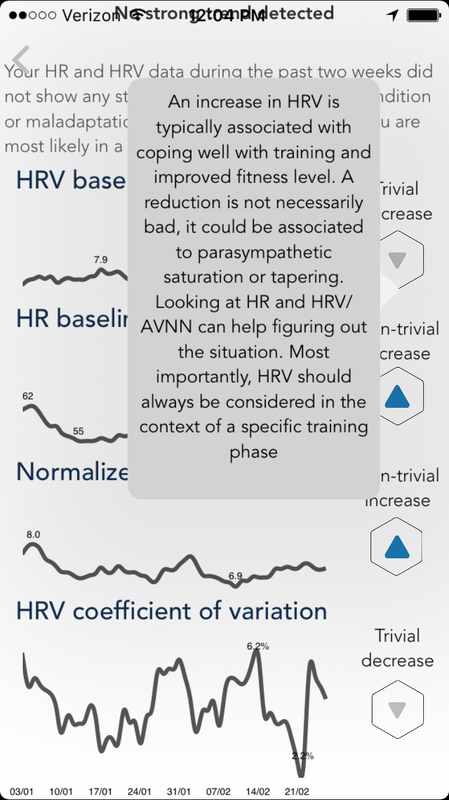
For example, if your baseline HRV is going down (significantly from what is normal for you, according to a pre-study 4 weeks long data collection), then you might be better off by introducing a moderate training block first, and start the intense block when your HRV baseline is back on track. In this study, the authors were able to show improved performance for the HRV-guided group. So how can you put this study into practice? HRV4Training provides a Trends analysis, in which your baseline HRV is computed, and non-trivial trends are determined in order to assess what baseline changes are something to consider, and what baseline changes are simply due to natural variations in physiological parameters:
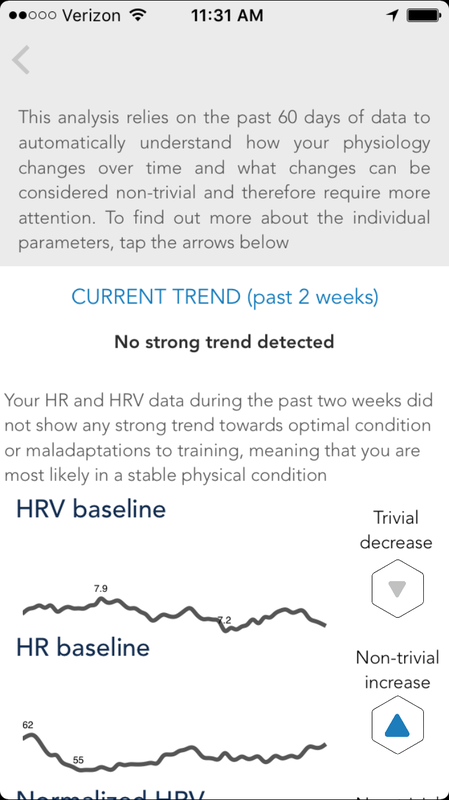
The idea behind the HRV Trends analysis in HRV4Training is to better capture the big picture, beyond day to day variations or acute HRV changes. The first parameter shown by the app (screenshot on the right end side above) is your HRV baseline, a 7 days moving average based on rMSSD, similarly to what was used in the study. The app is also able to understand what changes are trivial and non-trivial. For example, my recent HRV baseline is going down, however the change is trivial. The app needs quite some data (currently we use the past 2 months) to determine what is your normal variability and what is abnormal and should be investigated further. What should you do if you'd like to apply the same training regime that the study employed? When you decide to approach a new training block, check your HRV trends. If your HRV baseline is going down, proceed with an easy or moderate training block. If your HRV baseline change is non-trivial or going up, proceed with what was planned. By using this approach you will be able to postpone intense training blocks when conditions "are not ideal", i.e. when you are experiencing a non-trivial decrease in HRV. Interpreting daily heart rate variability changes in collegiate female soccer players
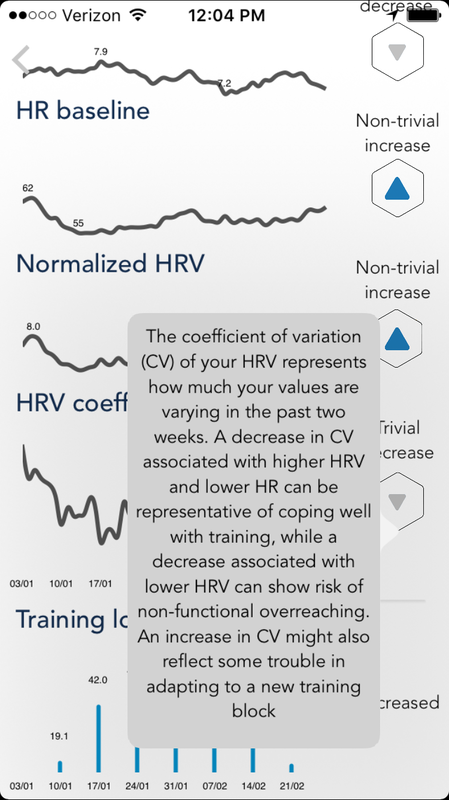
In this other study, Flatt et al. collected data using the ithlete app paired to a chest strap, for 60 seconds in home settings. Andrew has been looking at the coefficient of variation (CV) of the rMSSD value in some other studies (and blog posts at his personal blog) with promising results.
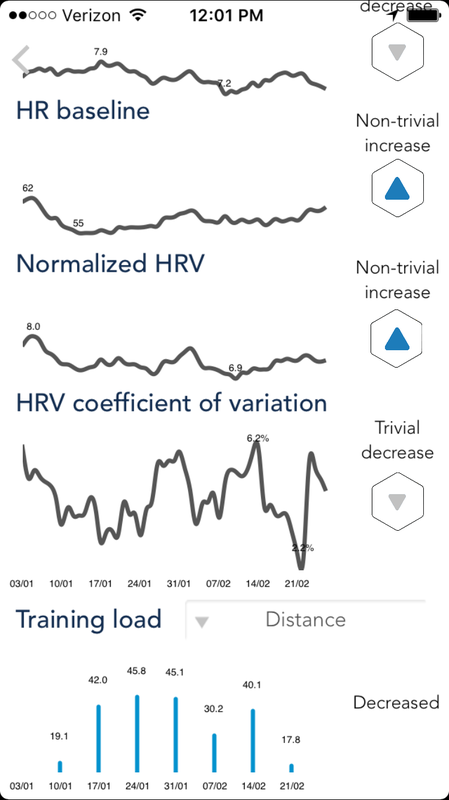
I've explained the rationale behind the CV in another very long post, but I'll summarize it here: "On the other hand, a reduction in CV rMSSD has been associated with increased risk of non-functional overreaching (Plews et al.). This makes sense since less variation might mean that there is more stress. However, there is some controversy on this point since other authors interpret a reduction in CV rMSSD as a measure of better adaptation (Flatt et al.). This also makes sense since we expect more day to day changes if we are not coping very well with the training and therefore rMSSD jumps around more (e.g. we start a new training phase with high intensity loads)." - on a side note it's really great to see that now Plews and Flatt worked together on this latest paper I'm commenting on. and a short summary here: "CV rMSSD: A decrease associated with higher rMSSD and lower HR can be representative of coping well with training, while a decrease associated with lower rMSSD is probably representative of risk of non-functional overreaching. An increase in CV might reflect some trouble in adapting to the a training block (higher intensity) and if associated with reduced rMSSD might be a warning sign of inappropriate training load." In his latest study, Andrew was able to show that an higher CV was associated with higher fatigue and lower fitness, during high training load. These results validate the previous assumption and also show that once again context is important and to interpret CV changes we need to look at 1) training load 2) possibly HRV and HR trends to make sure we are not in a overtraining/overreaching situations that is causing low CV. Once again, how can we put this study into practice? We go back to the HRV Trends analysis in HRV4Training, which provides more than what I've shown in the previous screenshots:
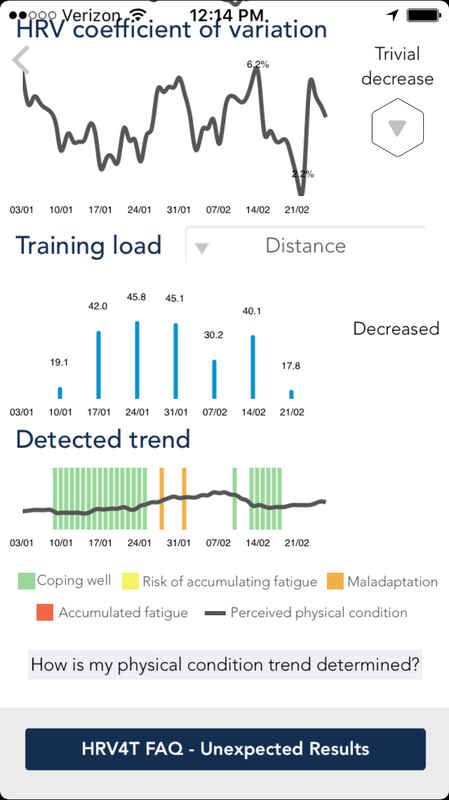
As you can see, the app already computes the CV of your HRV and determines if the change is trivial or non-trivial. Similarly, the app does the same for HRV baseline (explained above) and HR, while showing your recent training load, so that you can easily contextualize your data. What should you do if you'd like to apply the same training regime that the study employed? Go to the HRV Trends page, and check your HRV coefficient of variation. If it's rather flat or decreasing, while your training load is increasing and your HR and HRV look good (i.e. HRV is not going down significantly and HR is not going up significantly), then you are most likely adapting well to the current training block. On the other hand, if your CV is increasing, you might be experiencing some trouble in adapting to the new training block, and might be experiencing fatigue. The app provide some details on these parameters if you tap the buttons on the right end side (the trivial/non-trivial arrows, see above). But there's more
At this point it might start to get a bit complicated. We have multiple parameters and trends to look at at the same time in order to better understand the big picture.
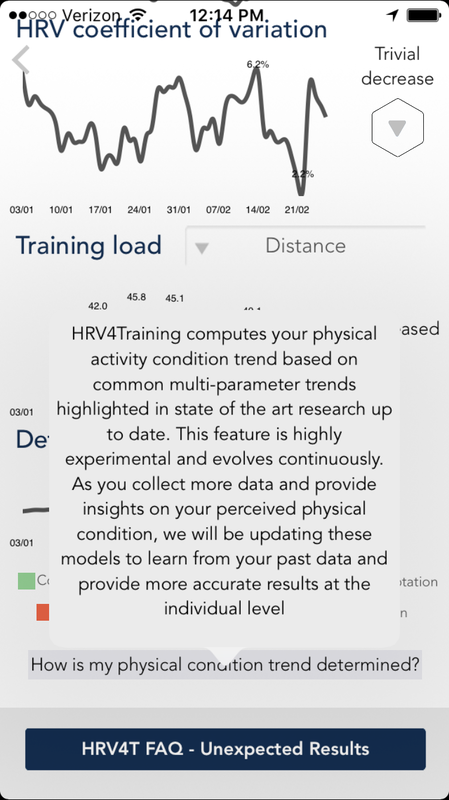
The HRV Trends analysis in HRV4Training is very experimental. While you can look at the parameters above and try to better guide your own trainings, based for example on the findings of the two studies covered in this post (e.g. reduction in baseline HRV to move an intense training block to a better moment, or CV as a proxy to fatigue and adaptation to an intense training block), we are also trying to do the math for you. Based on the different parameters shown in the HRV Trends, the significant changes in such parameters with respect to what is normal for you (historical data) and your training load, we are also providing an automatically detected Trend, which should indicate if you are coping well with your training block, accumulating fatigue and so on:
As explained above this feature is highly experimental and will most likely benefit from both additional research in the field as well as user generated data. As we gather more self-reported data on physical condition and perceived performance during training, together with physiological data, we might be able to provide better advice to each individual. We are also considering linking HRV4Training data to actual trainings (e.g. Strava workouts) so that we can collect reference points on performance, similarly to what can be done in well designed clinical studies, to assess the effectiveness of these interventions. These additional reference points will allow us to build additional models on the relation between physiological, lifestyle, training parameters and performance. Stay tuned! p.s. For the ones that want to dig a bit deeper in these aspects (long term HR/HRV trends), here is a list of my favorite papers:
Like the app and the blog?HRV4Training on Facebook
HRV4Training is on Facebook. We use this page as a centralized place for feedback, discussions, feature requests, bug reports and to introduce new features and changes in the app.
Especially for the ones that are not much into Twitter, feel free to use the Facebook HRV4Training page as a place to open discussions around HRV, training, performance and more.
0 Comments
Your comment will be posted after it is approved.
Leave a Reply. |


Register to the mailing list
and try the HRV4Training app! 
|