On HRV measurement repeatability: what is the effect of paced breathing and measurement duration?7/23/2016 Blog post by Marco Altini One of the most difficult aspects to understand when getting started with HRV is measurement repeatability, meaning that measuring your HRV twice in a row will most likely result in two slightly different values. This is why you should use a tool that is able to use your historical data to determine what is normal day to day variability for you, and highlight changes outside of these normal variations, as explained here. At the end of this post I will give some tips and explanations related to this variability and how HRV4Training interprets your data so that you can still make sense of it. However, for the main part of this post, I simply want to show some data and answer a few questions, hoping to provide some clarity around the topic:
DatasetThe data shown in this post were collected during a clinical validation study ran by Ben Scott, Daniel Plews and Paul Laursen, which you can find here. The main goal of the study was to compare sensor modalities, however, since we collected data under many different conditions, I will be using the same dataset to explore other relations, for example the one covered here between measurement duration, paced breathing and measurement repeatability. The subset of the dataset used for this analysis consists of recordings from 26 participants and three sensor modalities (ECG, H7, camera). For each participant we have four measurement conditions, each one 5 minutes long: LB1: lying down with paced breathing, LNB1: lying down without paced breathing, SB1: sitting with paced breathing and SNB1: sitting without paced breathing. I computed HRV (the usual rMSSD in ms) for each condition. In particular, I used the first 4 minutes of data to analyze differences in minutes 1 and 3 as well as between minutes 1-2 and 3-4, so between each repeated measure I left 1 minute. This is a bit of a random choice but I figured it was a more realistic setup to leave some time between consecutive measurements to analyze. What differences should I expect when measuring twice in a row?Here are boxplots of all the data showing differences in rMSSD on consecutive measurements during different conditions. Note that for the analysis that we are doing in this post the sensor modality (ECG, chest strap or camera) is irrelevant, as consecutive measurements differ due to the nature of the ongoing physiological measurements that we are trying to capture via HRV analysis, and these changes are always present. Nevertheless, we will be showing all sensor modalities since we collected the data and we can see if things are consistent or not: 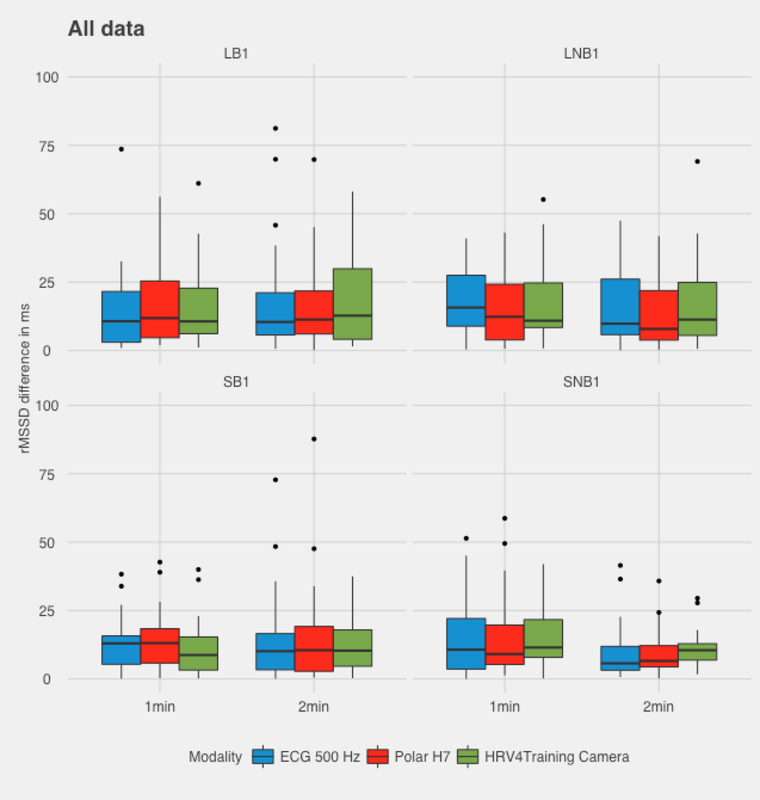 Results are quite similar across conditions. Differences in rMSSD between consecutive measurement average at 15.3 ms (15.0 ms for ECG data, 15.2 ms for camera data, and 15.7 ms for H7 data, nothing noteworthy). This is pretty much what you should expect when measuring twice in a row. While there are outliers, the boxplots show that much of the data is in the range 5-20ms. If you use Recovery Points in HRV4Training, these differences in rMSSD translate in approximately 0.1 - 0.6 Recovery Points differences, depending on your baseline rMSSD and age. Is measuring for longer a better idea?In the following plot I grouped the measurement shown above based on measurement duration, as I computed features over sub-periods of 1 or 2 minutes, to see if the situation would improve. Looking at the conditions above, it doesn't really look like it, except for SNB1. Here is the data by group (1min vs 2 min, regardless of the measurement condition): 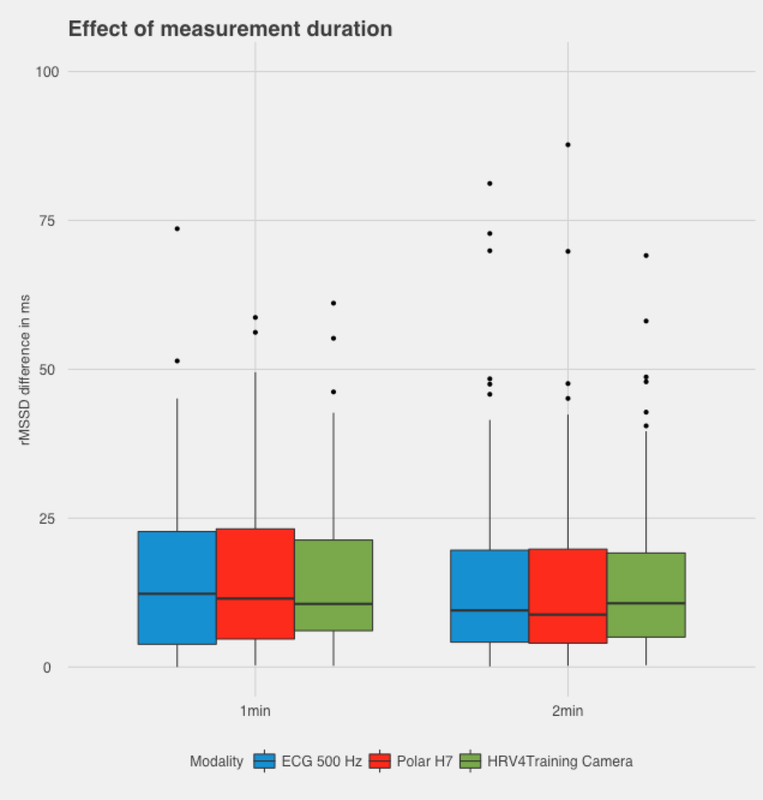 Again, pretty much the same. Slightly smaller variations, but we can't really take this as solid evidence that 2 minutes are better than 1. I personally went back and forth for a while and eventually settled on 1 minute. Do I get more consistent results by using guided paced breathing?Finally, I grouped paced breathing and self-paced breathing regardless of the measurement condition, to see if we could get higher repeatability (theoretically smaller differences between consecutive measurements) using paced breathing: 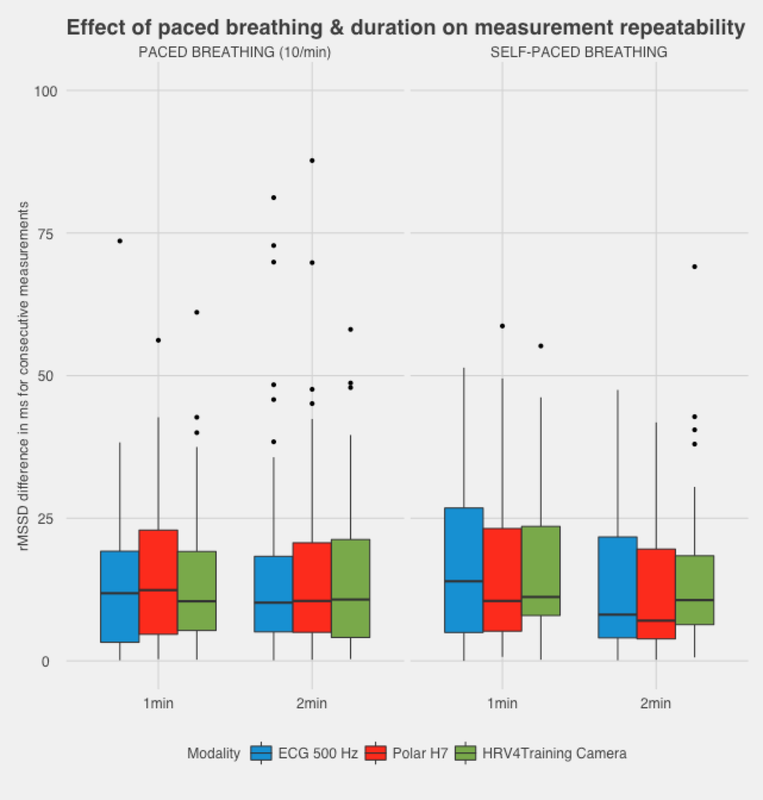 The plot above is basically summarizing the left vs right side of the first plot. We can see that during paced breathing measurement duration seems to matter less. Results are the exact same across sensor modalities for measurements of 1 or 2 minutes when using paced breathing, while there are some tiny changes for self-paced breathing. Looking at these data it seems that there is no improvement in measurement repeatability using paced breathing. For a broader discussion on the topic of paced breathing for short morning measurement (not biofeedback), please check this article. All plots above show the same differences across sensor modalities, highlighting once again how the camera measurement is as good as an ECG or a Polar H7. Finally, below is a last plot that shows how the error changes based on a participant HRV. Here I split HRV data in quantiles, meaning that we have clustered all participants into four groups based on baseline HRV values. You can see how differences in repeated measures are slightly higher for higher HRV values, as we would expect (another way to look at this would be to plot the percentage error, which is more similar across groups, highlighting a similar relationship): 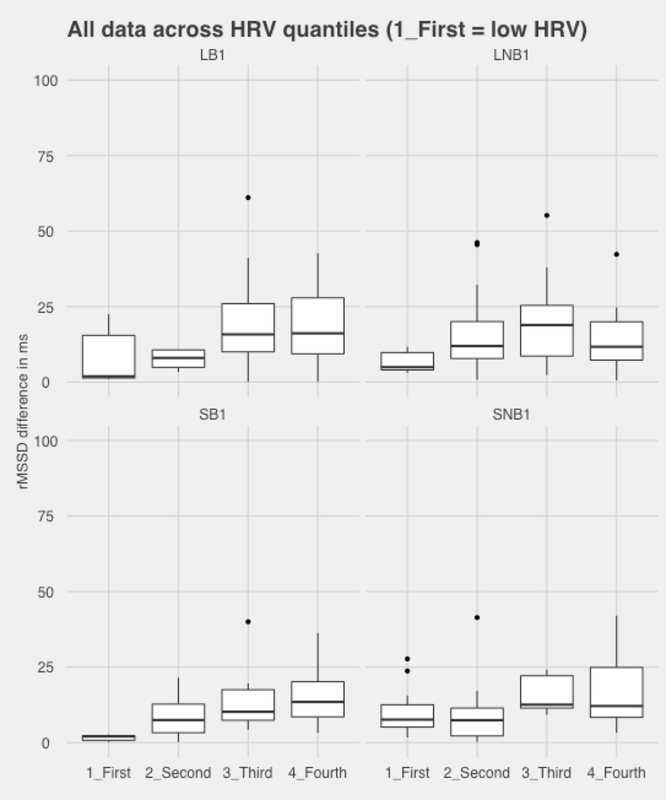 How do we account for day to day variability when interpreting the data?As daily measurements taken in succession can vary, and variations of 5 - 20 ms or 0.5 recovery points are perfectly normal, we now have a new way to display the daily advice that also takes in account what your normal values are. Your normal values are simply derived from your historical data, in particular from the past 2 months of data, and should make it easier to interpret the daily score and understand that there is always a normal variation even between successive measures, as your physiology is never in the exact same state. HRV4Training does the math for you, so that you can easily see when daily scores are significantly lower than your normal, and therefore high stress is detected: 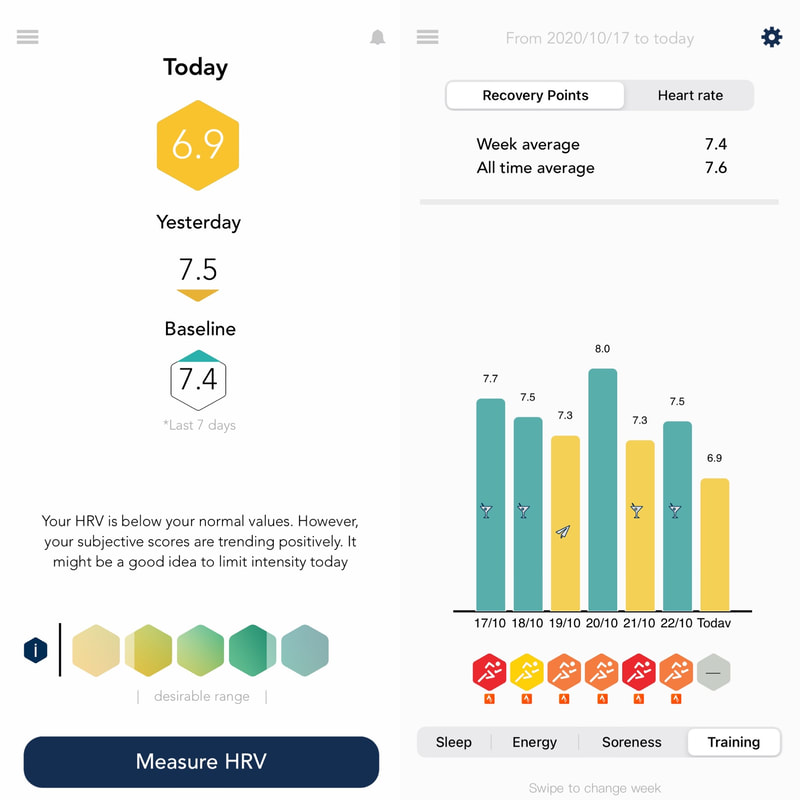 When your data is within the non-transparent area that covers the central part of the color-coded advice bar, it means that nothing really changed, and the fluctuations you see in there, are simply normal physiological variations. You can see also in the History page how there is always some variability between days, but only scores below your normal values are flagged in yellow, as significantly more physiological stress was detected. Here is another example with my own data in HRV4Training Pro, where you can see for example the effect of both running a marathon and slacking off a couple of days around new years. While there is still the usual day to day variability, values are quite lower than my normal, as highlighted by both the daily scores and baseline being below normal values (the light blue band): 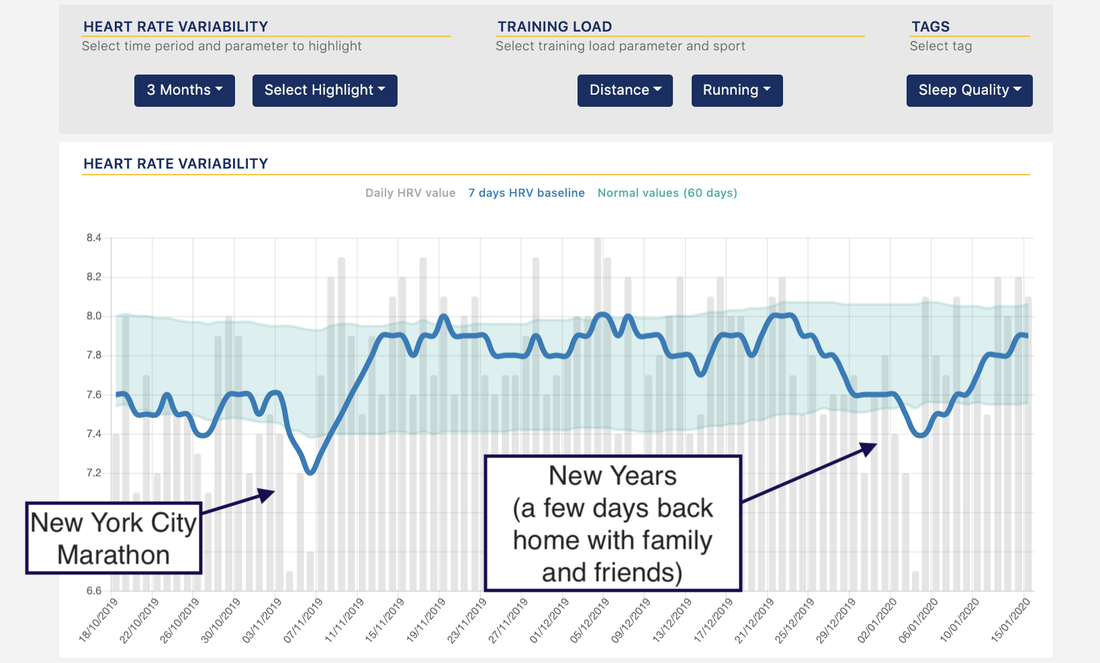 SummaryIn this post I analyzed a dataset consisting of recordings from 26 participants and three sensor modalities (ECG, H7, camera). For each participant we had four measurement conditions, including lying down and sitting with or without paced breathing.
We found that on average we have about 15 ms differences in consecutive HRV measurements under these conditions, and that paced breathing as well as slightly longer measurements (2 minutes instead of 1), did not change much the outcomes. I also showed how we deal with this variability in HRV4Training, by always analyzing your data with respect to what is your normal variability based on your historical data, and therefore making meaningful interpretations. Hopefully, this gives some clarity on a topic that is not much discussed but clearly puzzles many, as these questions are among the most common we receive.
0 Comments
Your comment will be posted after it is approved.
Leave a Reply. |


Register to the mailing list
and try the HRV4Training app! 
|