|
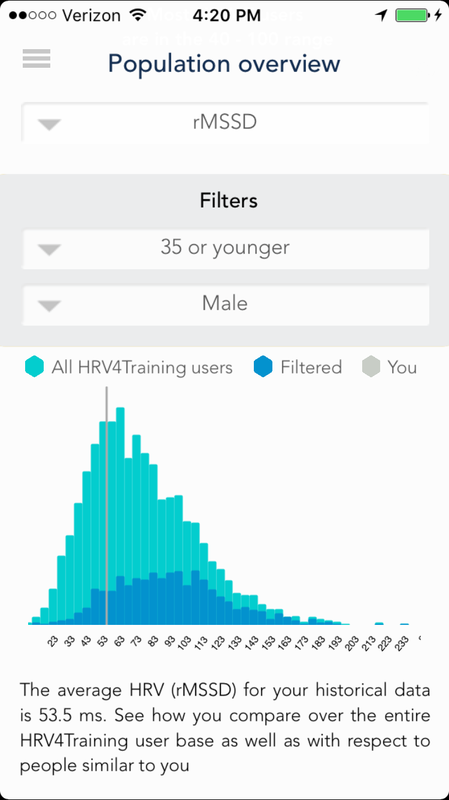
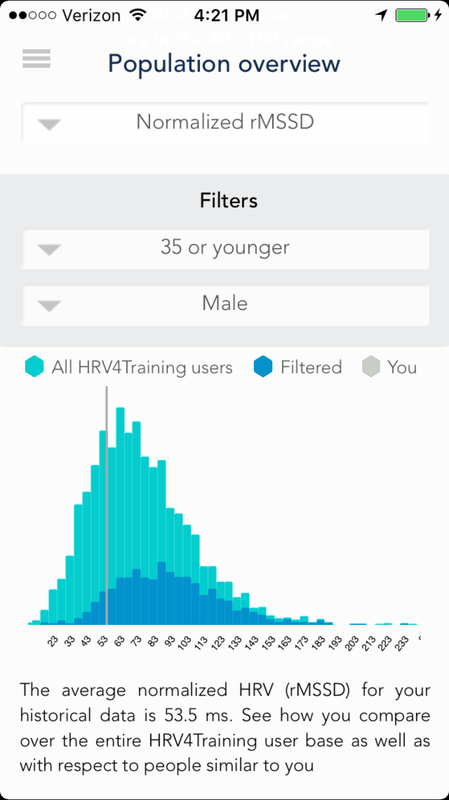
Blog post by Marco Altini I recently came across the issue of heart rate variability (HRV) normalization after Tom Herbert brought it to my attention before our HRV round table. Coincidentally, our friend Kari also asked me the same question a day after. Thus I figured this was a topic worth some digging and potentially inclusion in the HRV4Training app. The first time I read about HRV normalization was a couple of years ago thanks to Daniel Quintana. Daniel gives a good overview and cites relevant papers on his blog, that you can find here (check out also his podcast at this link). At that time HRV4Training had just a few hundred users and no backend, so we couldn't explore these relationships on our dataset. As we have gathered a few hundred thousand measurements in the meantime, the time seems right to move forward with this exploration. What's the problem?The problem is simple, there is a well known inverse relation between HR and HRV (higher HRV tends to be associated to lower HR, and vice-versa). However, this relation is non-linear. The easiest way to understand this is to look at the data reported by Jerzy Sacha, in his paper "Why should one normalize heart rate variability with respect to average heart rate". Here is the figure I took from the paper: 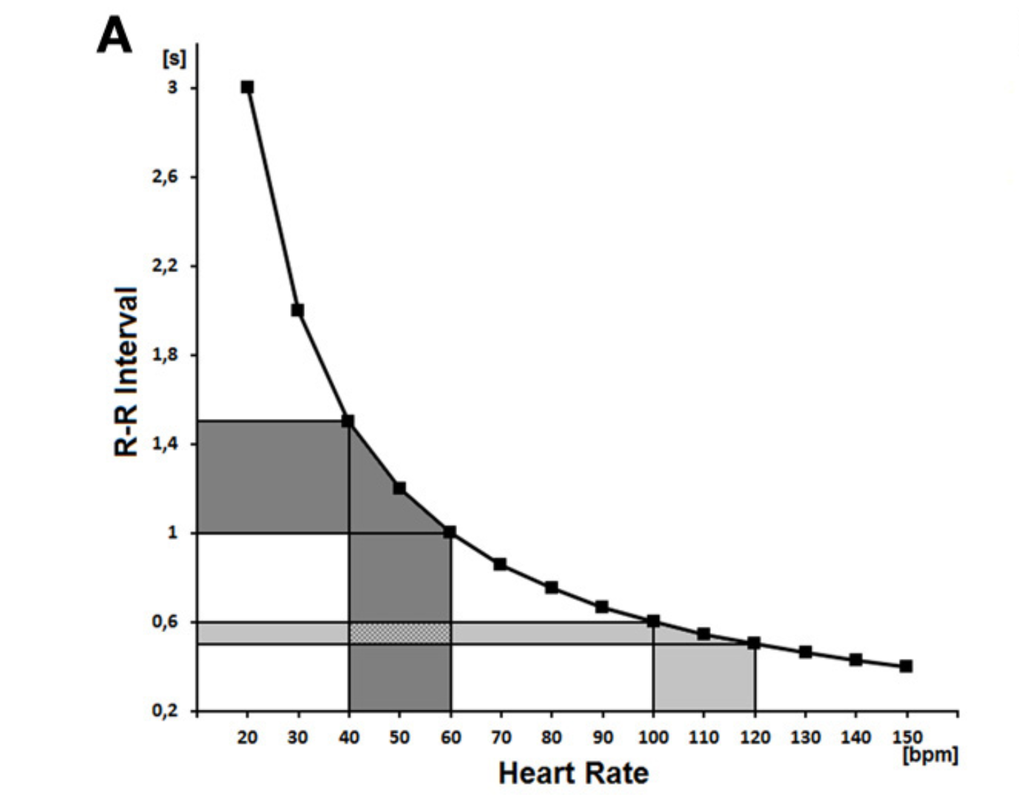 As the authors say: "The non-linear (mathematical) relationship between R-R interval and heart rate is depicted. One can see that the oscillations of a slow average heart rate (x-axis, dark gray area) result in much greater oscillations of RR intervals (y-axis, dark gray area) than the same oscillations of a fast average heart rate (light gray area). As a consequence, the variability of R-R intervals is higher for the slow average heart rate than for the fast one, despite the fact that the variability of heart rate is the same (reprinted with modification from Sacha and Pluta, 2008)" So basically, given the same oscillations in HR, you will get a lower HRV score if your average HR is higher. What does this mean for your data?As a matter of fact, not much. As data in HRV4Training (and all other apps as far as I am aware of, for example Elite HRV or ithlete) is always analyzed with respect to yourself, and your baseline heart rate won't change much, the lack of this normalization has a small impact at the personal level. What we care about are always changes with respect to your own baseline, your own trends, and never comparisons with other individuals. However, this normalization does impact things a bit more at the population level. If you have a normal or slightly lower than the average HRV, with respect to people similar to you, and your HR is much higher than other individuals similar to you, after normalization your HRV will end up on the higher end of the spectrum, instead of the lower. Thus, It can be interesting to look at population data, where heart rate differences are much broader than within an individual, after normalizing HRV by heart rate. Note also that in HRV4Training normalized HRV is already present under Insights / HRV Trends, as we use it for the automated trends analysis, as it can be insightful to spot saturation or maladaptation to training, when used in conjunction with other parameters (see for example Plews et al: "Training adaptation and heart rate variability in elite endurance athletes: Opening the door to effective monitoring") or our blog post on interpreting HRV trends. Normalized HRV in HRV4Training population comparisonsAs population comparisons are potentially affected by (lack of) HRV normalization, we added normalized rMSSD as one of the parameters you can pick in the app to explore how you stack up with respect to other users. Let's look at some HRV4Training data. Here is an example of how things change due to the normalization explained above. I isolated individuals with "high HR", based on a random threshold that I set to 80 bpm: 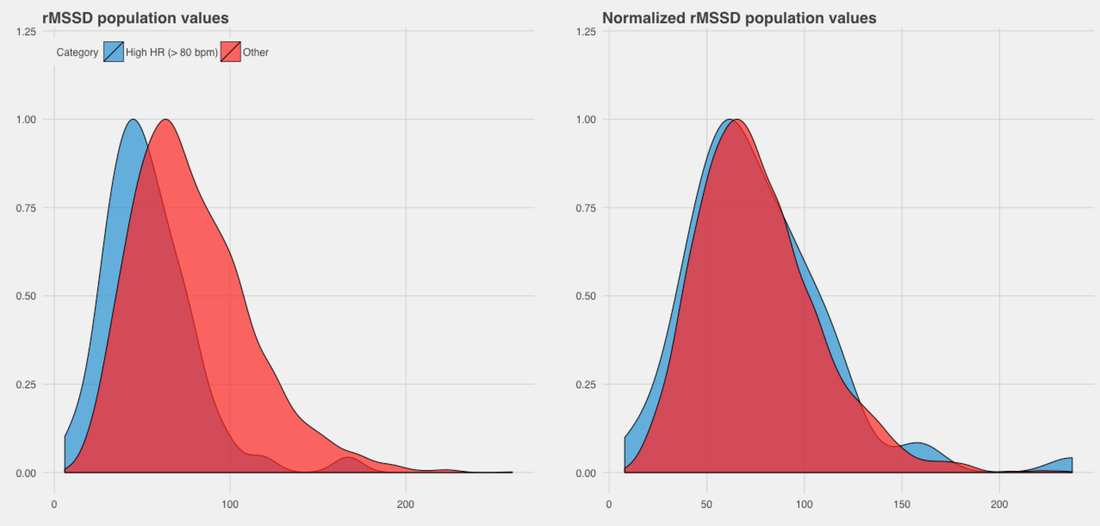 On the left side you see normalized density distributions for rMSSD data. As expected, individuals with higher HR, tend to have lower HRV values, as the peak of the blue distribution (HR > 80 bpm) is on the left side of the red one, which includes the remaining users, so the ones with heart rate below 80 bpm. However, when we normalize HRV by heart rate, as shown on the right end side, these differences disappear. The authors of the papers cited above suggest that this is a better way to look at HRV data at the population level, as it would remove mathematical bias from the inverse non-linear relationship between HR and HRV. Here is another way to look at the same problem. This time I isolated individuals with "low HR", based on the again arbitrary threshold of 40 bpm: 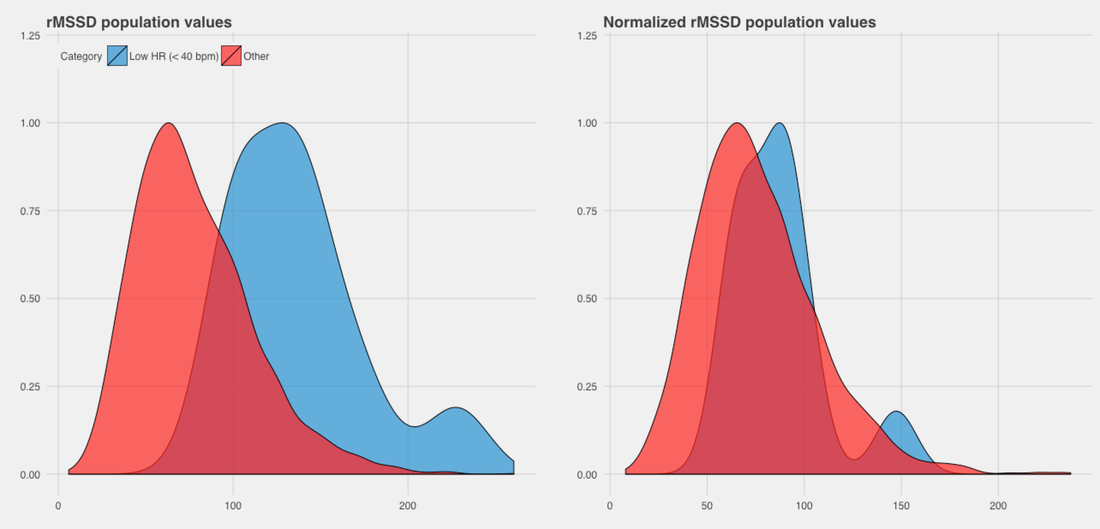 This time we see that as expected individuals with low heart rate tend to have higher rMSSD, with differences that are much bigger than before when we isolated the high heart rates. As we normalize these data, we see that the difference between the two groups becomes smaller. We also see that there is a group of people with low HR quite separated from the others after normalization (small blue "bump"). These are individuals that have low heart rate, but still much higher variability than the average person, even after normalization. I hope these plots are useful in understanding what HRV normalization is about. Basically, it's a better way to look at population level HRV data, after accounting for differences in heart rate. If you are curious about your own data, and how you stack up with respect to other people after HRV normalization, you just have to wait a few more days until we release the next version of HRV4Training, which will include HRV normalization under population comparisons. Here is an example for my data. As you can see, nothing really changes for me, as my heart rate is pretty average (59 bpm). You will see more significant changes if your heart rate is particularly high or low, with respect to other users:
Enjoy.
0 Comments
Your comment will be posted after it is approved.
Leave a Reply. |


Register to the mailing list
and try the HRV4Training app! 
|