|
Blog post by Marco Altini The latest HRV4Training update includes normal values in the Baseline page of the app for Pro users. You can try this visualization by logging in at HRV4T.com and starting your free trial or purchasing a Pro plan (use code NORMALISGOOD for 25% off)  Overview page in HRV4Training Pro What are normal values?Normal values are a representation of your historical data. They are built using the past 60 days of data and help you better understand when variations in heart rate and HRV are outside your normal range, so that you can focus on important changes. It is normal for heart rate and HRV to fluctuate quite a bit on a day to day basis, and it is key to be able to determine what changes are just part of normal day to day variability, and what changes are important. For example, a daily score or baseline below normal values for HRV data, identifies a day or period of increased stress, something to be cautious about. On the other hand, if your score is just a little lower than yesterday, but still within normal day to day variability, that's typically nothing to worry about. HRV4Training makes it easy to differentiate between these two conditions. 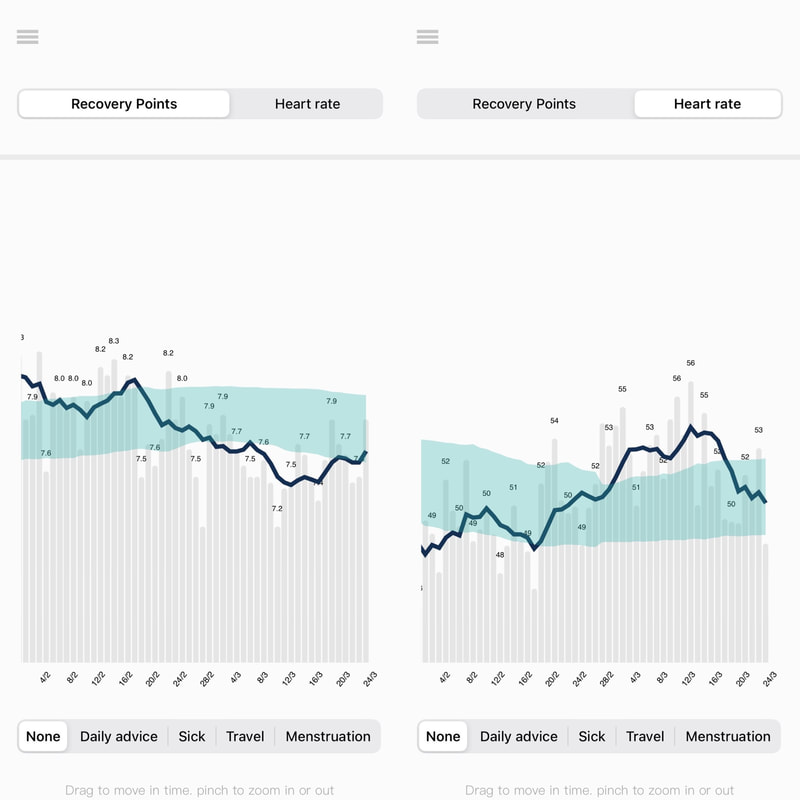 Example of the new Baseline page for Pro users in HRV4Training. Data can also be color-coded using different annotations, to better contextualize your trends. In particular, we can see how both HRV and heart rate go outside normal values, clearly highlighting a period of higher stress How do we build normal values?Currently, we use the past 60 days of your measurements to build your normal values. As soon as you start using the app, HRV4Training will start learning what day to day changes are normal for you, and what changes are outside your normal range. As you gather more data, the app will get better at this job, eventually giving you the best estimate when having all the 60 days of data. The normal values are always kept current, so that you are not stuck in older data, but at any given time, the most recent 60 days are always used. Over the years, we made a few adjustments to this method, but we believe that 60 days is a great trade-off between 1) not being too reactive, or adjusting your normal values too quickly for example using just the past few weeks of data 2) not getting stuck in very old measurements or in seasonal changes that might have little to do with your current status, which is what would happen when using more data. For heart rate and HRV, 60 days of data seems to be just right. How do we use normal values?Collecting high quality data using either our validated camera-measurement, a chest strap or an Oura ring, is only the first step. Once we have collected high quality data we need to be able to properly interpret it with respect to our own historical data. On a daily basis HRV4Training already compares your daily score with your normal values, you can see this comparison and a visualuzation in the homepage of the app. Additionally, you can also see the color coded advice in the History page, which also relies on normal values. The text in the homepage will also report if your score is within your normal values or not, as you can see below. What you aim for typically, is a stable physiological condition, so scores within normal on most days. Making adjustments such as trying to reduce training load or other stressors when your HRV is below your normal values, can be an effective strategy to better balance stress, and improve outcomes in the longer term. This is also the approach used in HRV-guided training. 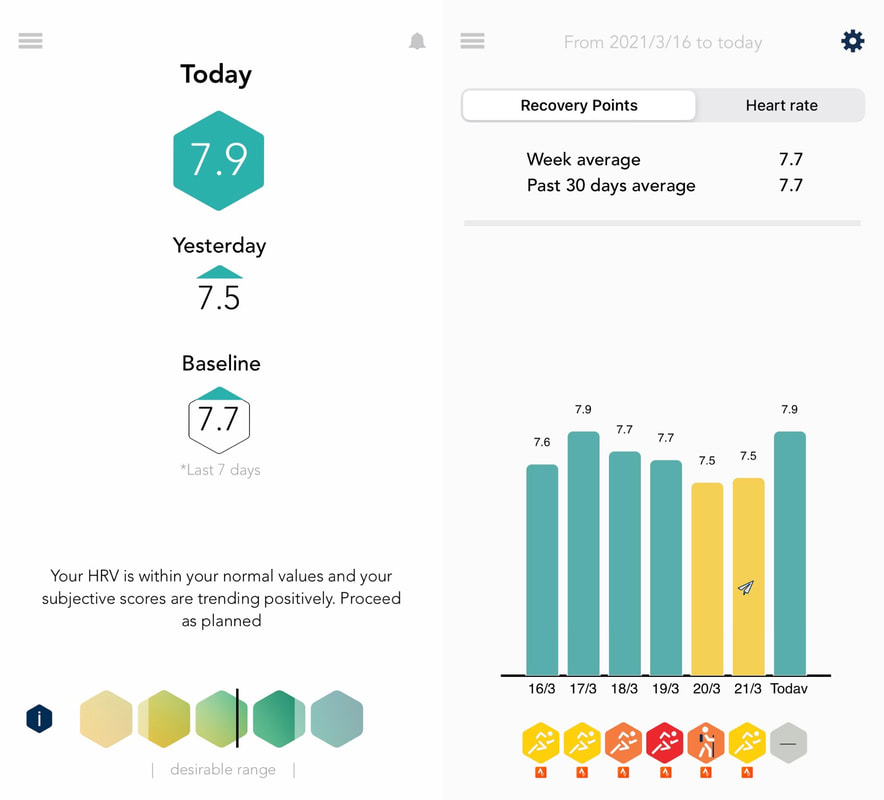 Homepage and History page in HRV4Training. The color coding and the bar at the bottom of the homepage highlight if your daily score is within your normal values However, in the long term, once you have used the app for a few months, it can be helpful to visually look at the normal values band to better understand the full picture and analyze baseline deviations that highlight longer periods of higher stress. This is what you can do now in the app if you have a Pro account, similarly to what you already see on the web dashboard in the Overview page. Additionally, the new visualization provides color-coded annotations so that it is a bit easier to contextualize stressors in the medium-long term. See for example here annotations related to the menstrual cycle or getting sick. How can you try it?You can try Pro for free by logging in at HRV4T.com Once you have started your free trial or purchased a plan, the Baseline page of the app will update automatically. We hope you'll enjoy this update. Thank you for supporting our work. Useful resourcesComments are closed.
|


Register to the mailing list
and try the HRV4Training app! 
|