|
Blog post by Marco Altini.
This post is about common issues in HRV analysis, namely motion artifacts & ectopic beats. Both motion artifacts and ectopic beats can create significant problems when computing HRV features and it is extremely important to include some level of post-processing once RR intervals have been acquired. These issues are present regardless of what system you use to acquire your data (full ECG, pre-processed RR intervals, e.g. from a Polar, or the Camera PPG in HRV4Training). You can find a very good example in Buchheit et al [1] (see this tweet). I highly recommend reading this paper even if you are not much into technical aspects or research since it includes plenty of practical insights on both HRV measurements at rest and submaximal HR during exercise as a proxy to fitness, something I’ve personally worked on during my PhD in the context of estimating cardiorespiratory fitness from contextualized HR in the general population, outside of sports [2]. In this post I will show issues on different data streams and how we can try to handle them. In particular, we will look at:
Full ECG
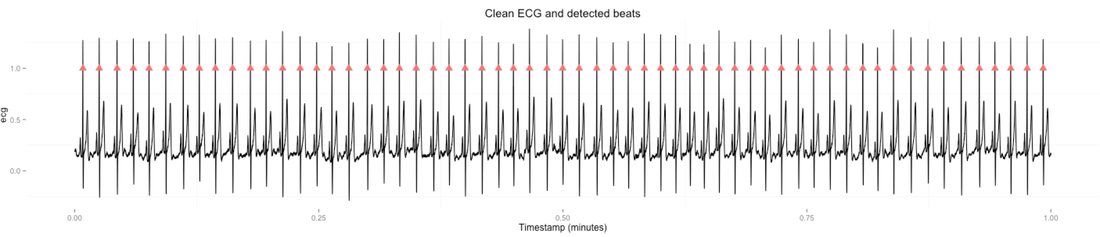
For the full ECG example we will look at the effect of one single ectopic beat. Let's start by plotting some data, from the same person, for two adjacent minutes, one with clean data:
and the second one including an ectopic beat towards the end of the measurement:
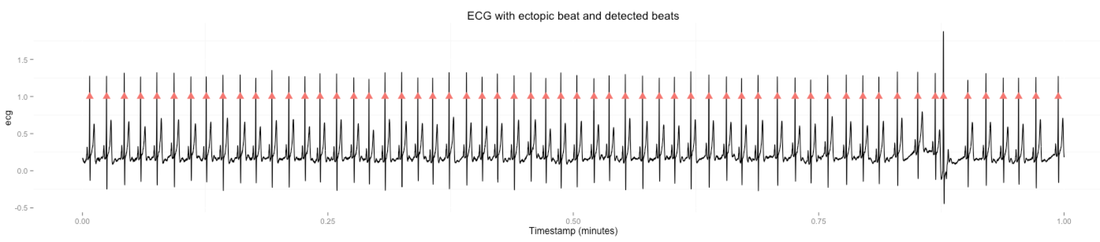
Detected beats are also highlighted in red. What happens if we don't do any post processing and compute HRV (let's consider the usual case of computing rMSSD), for the two chunks of data shown above?
Now that we identified the problem and showed the impact on HRV features, we need somehow to fix it. How do we go about computing HRV features for noisy chunks of data while ensuring the correct output? Identifying ectopic beats is done in clinical practice by removing RR intervals that differ more than 20 or 25% from the previous one, since that’s very uncommon and most likely is indicative of a problem (ectopic beat, noise, motion, etc.). Let’s try to identify all issues in the previous plots by using this technique (click the figures to enlarge): 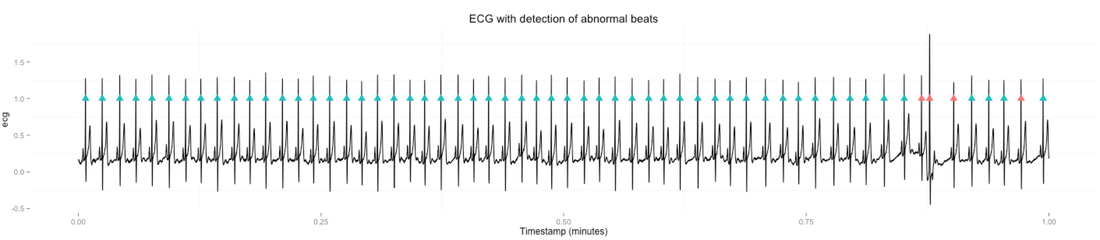
This simple algorithm was able to determine what RR intervals were abnormal and should be excluded from HRV analysis. We can appreciate the correction also by looking at the RR intervals histograms before and after the correction:
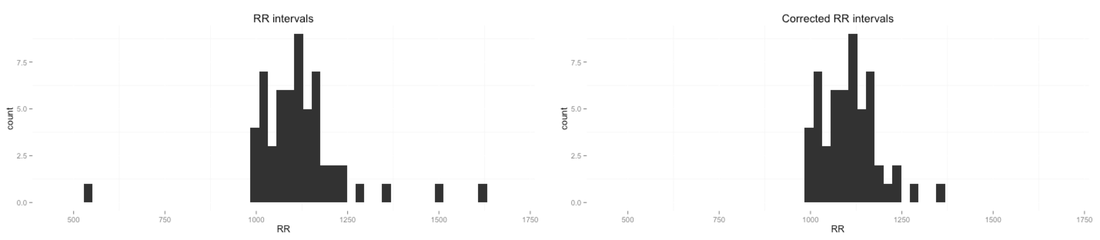
Now if we recompute the features we can see that results are as we expect, with similar values between consecutive minutes, regardless of the ectopic beat, which has been accounted for by the RR interval correction technique:
Polar H7
"I use a Polar, so my data is perfect"
I hear this a lot, and don't get me wrong, I'm the first supporter of the great work they do at Polar, however, RR interval correction is not performed by the sensor itself (possibly for very good reasons, e.g. some applications might be looking for such ectopic beats in order to develop different algorithms). Thus, we need to use the same techniques explained above even when we collect data using a Polar, and not only when we process it ourselves from a full ECG, or from PPG data as shown later. Since we discussed ectopic beats in the preceding example, in this one we will look at another problem, motion artifacts. Below are some data I recorded while running: 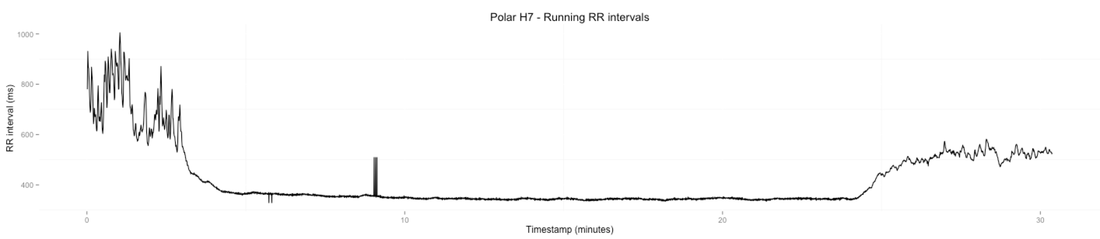
The data shows something rather typical of intense exercise, with RR intervals becoming very small and rather constant as heart rate increases. We can spot already an issue sometime around a third of the recording. Here I was maybe adjusting the strap, or simply there was bad contact for a few seconds, and I got some inaccurate RR intervals.
Since we often consider short windows, I cut the data around the artifacts to perform HRV analysis over 60 seconds of data, similarly to what we did before: 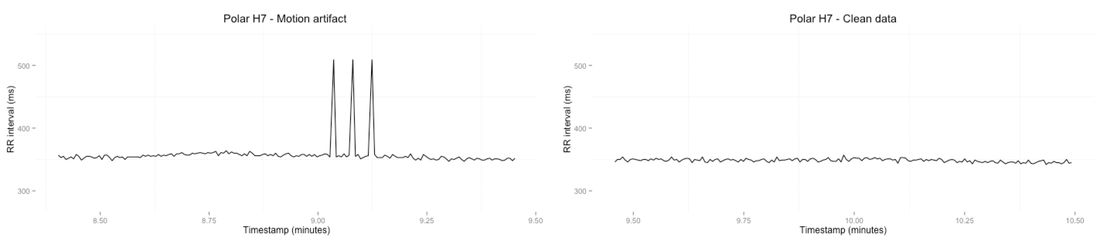
Values for rMSSD:
As expected, when running there is basically no variability. However, the motion artifact changes things quite a bit, raising rMSSD up to 28 ms.
Now we know how to fix the issue, i.e. we need to identify and remove RR intervals differing more than 20% from the preceding one. Once we perform the correction, we easily remove the three peaks, and obtain the following:
Camera PPG
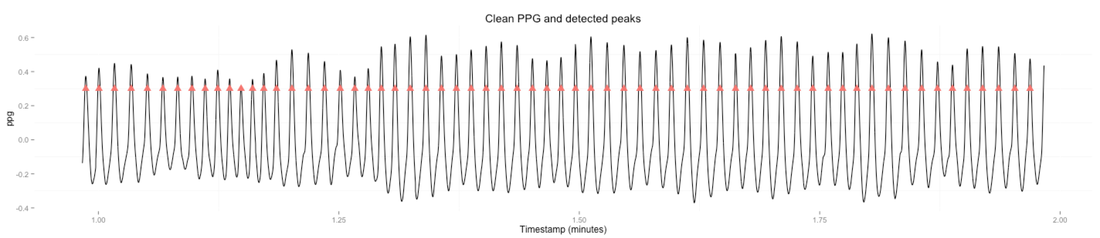
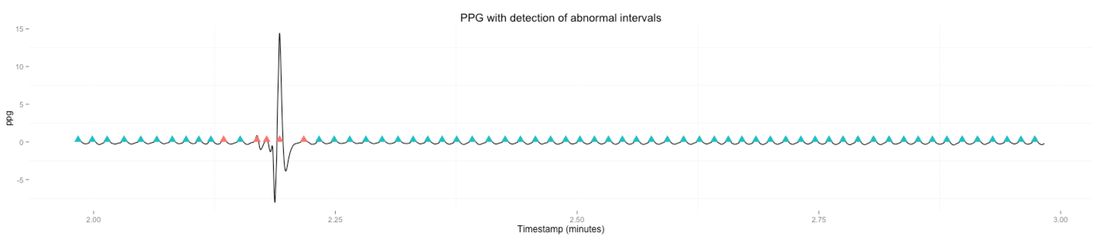
As a third and last example, I will show how the Camera-based algorithms implemented in HRV4Training deal with the issues above. Let's first look at some data. Again two 60 seconds windows, one with clean data:
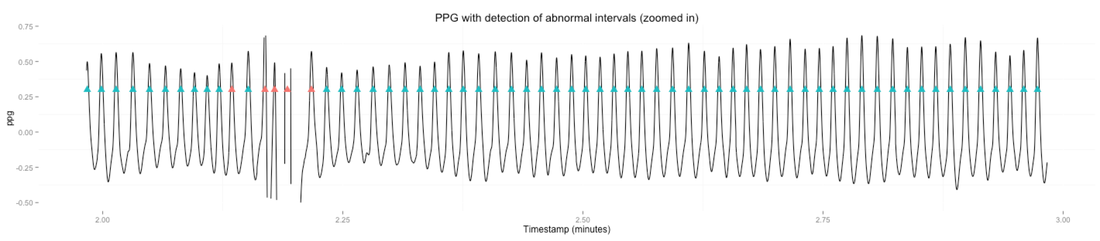
And another one including motion artifacts (the second plot is a zoomed-in version just to show that the rest of the data are clean). To create the artifact below, I pushed hard on the camera while measuring, the change of pressure and finger movement messed up completely the signal:

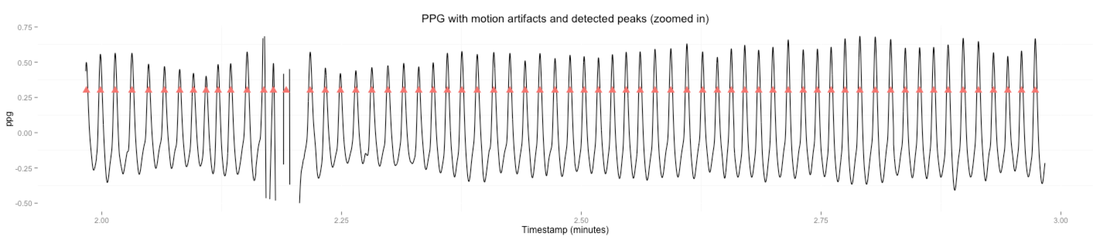
I've also highlighted the detected peaks according to HRV4Training's algorithms. We can see the peak detection works decently around the artifact, detecting the extra peak and then going back to normal right after. However, we can also see that around the motion artifact the intervals between peaks become more irregular and we need to take care of the situation or we will end up with a much higher rMSSD, similarly to the ECG and Polar examples above.
As a matter of fact, computing rMSSD without any artifact correction shows the usual issues, with values being much higher when we have artifacts disrupting the signal:
We could isolate once again the noisy intervals. Computing rMSSD on the new time series gives us the following:
There is one more important aspect when we consider issues caused by motion artifacts instead of just ectopic beats, i.e. motion artifacts are localized but do last for a certain amount of time, typically involving quite a few beats, instead of just a single ectopic beat. This is a common problem especially for PPG based systems, since they are very sensitive to motion. Thus, we need to correct for artifacts but also make sure we discard a reasonable number of intervals and do not throw away too much data. For this reason HRV4Training provides two extra processing steps. The first one makes sure that by removing RR intervals we did not create too many gaps between the intervals that are still part of the time series. The second one computes the % of clean data, and if a certain threshold of noise is crossed, the recording will be labeled as poor quality and you will be prompted to retake the measurement. To convert this whole thing into something human readable, HRV4Training currently provides the following labels (subject to changes since these algorithms are revised and improved from time to time):
What can you do to make your measurements less error-prone
The method currently implemented in HRV4Training is very similar to the above, with a few extra tricks to make sure all artifacts are removed. However, to make sure the chance of artifacts (at least the ones due to motion or other technical problems) is minimal, please do the following depending on the sensing modality you are using:
For a Polar:
Summary
Ectopic beats and motion artifacts are common issues that affect any sensing modality and need to be dealt with. Using a simple rule (20% difference) allows for easy detection of the unwanted beats, that can be removed as a post processing step after collecting the relevant window of data. Once the artifacts have been removed, HRV features can be computed correctly. See a few lines above for some tips on how to limit the risk of introducing artifacts during your measurements.
|


Register to the mailing list
and try the HRV4Training app! 
|