|
Blog post by Marco Altini.
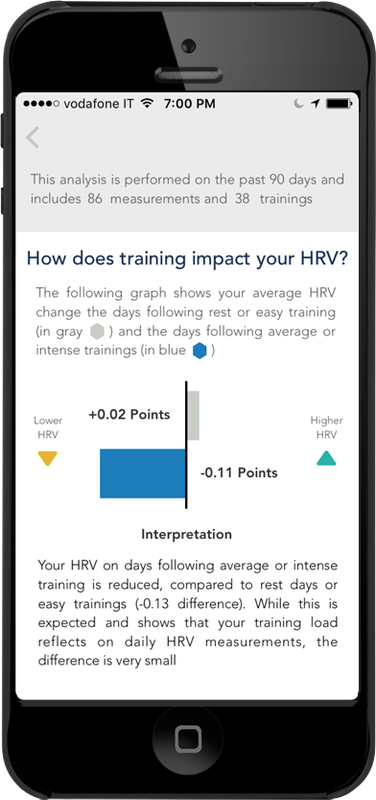
In quite a few previous posts (see the blog index on the right) I've covered acute HRV changes, i.e. changes in HRV following training. I've shown how we can use differences in HRV measurements between training day and the day following training to determine the impact of our training session on our physiology. What we typically expect in this situation is a reduced HRV on days following intense aerobic trainings. This method is one of the most common and reliable ways to use HRV, and is the principle behind the daily HRV advice provided by apps like HRV4Training.
In this post I'll explore another interesting point when it comes to training and acute HRV changes, i.e. can we rely on this measure for different sports? Is monitoring day to day changes in HRV useful only for aerobic sports (e.g. endurance running) or can we benefit from this type of monitoring for other sports as well?
Before we start
A few points are worth mentioning before we start, to avoid confusion:
What do we know from literature?
It is clear from literature that acute HRV changes reflect training load and training intensity and can be used to adjust trainings [1-4]. This is the whole principle behind HRV monitoring and HRV apps, and has been shown multiple times in various sports, mainly aerobic ones, for example running [2, 3], biking, triathlon [4], soccer, etc.
It is less clear if the same principle holds for other sports. This is an active area of research, and I'd suggest checking out Andrew Flatt's blog and research. Andrew is one of the most active researchers around HRV and training monitoring in athletes these days. An interesting dataset was analyzed in this context by Berkoff et al [5], where American track-and-field athletes were split into two groups, endurance and power. The distinction was based on what the authors felt the predominant focus of the athletes’ training was. All running events, middle distance and longer, comprised the aerobic group, with all of the remaining events making up the power group (decathlon, heptathlon, the sprints that were 400 m or less in length, all hurdle events, shotput, discus, javelin, and hammer). However, the authors did not have longitudinal data on HRV and training over periods of weeks to months, and therefore they could only look at the data cross-sectionally, and determine that there was no difference between groups in HRV values (i.e. all athletes showed rather high HRV values, as expected, regardless of the focus of their training). With only one data point per person, and without monitoring training, the authors couldn't determine the effect of different training types on acute HRV changes. As I try to stress often, apps like HRV4Training, ithlete or Elite HRV open great opportunities to better understand complex relationships between physiology, training and lifestyle factors, by outsourcing data collection to thousand of users and collecting reference points around the physiological measurements (e.g. tags in HRV4Training). Thus, we can try to answer our initial question using HRV4Training data, i.e. is monitoring day to day changes in HRV useful only for endurance sports (e.g. running) or can we benefit from this type of monitoring for other sports as well? Dataset
For this analysis, I used the last 3 months (October-December 2015) of measurements collected from HRV4Training users. I filtered out all users with less than 20 measurements and 10 trainings annotated during the selected time period, to make sure I had enough data to make meaningful considerations. This procedure left me with data from 597 users, summing up to 39387 HRV measurements.
Then, I split users into two groups, similarly to [5]:
The information I have is not extremely detailed, for example it is true that running could mean running 100m on the track and therefore not really aerobic, but among my assumptions are that most runners are endurance runners. Selecting only users that belong to the categories above left me with a total of 350 (239 endurance + 111 power) users and 23733 measurements. The plots below show the distribution of anthropometrics data for the two groups: 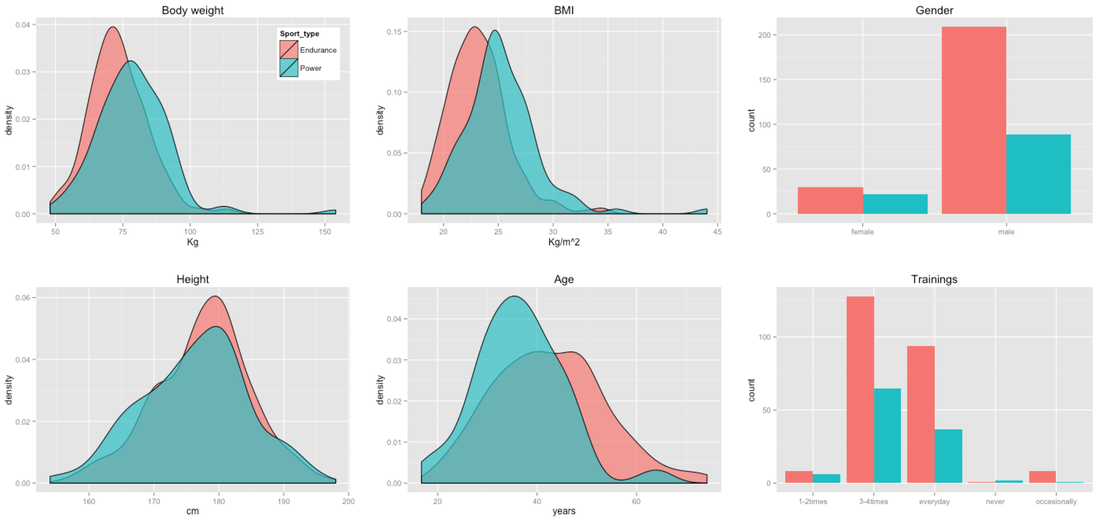
I preferred to use density plots instead of histograms due to the different sample size of the two groups. This way we can better see the differences in values without getting confused by the differences in sample size. We can easily spot some expected differences between the endurance and power categories. For example, body weight is higher in power sports, same for BMI. On the other hand height is similar and endurance sports seem to be preferred by a broader set of people, typically of older age. All points that make sense.
Finally looking at HR and HRV (rMSSD) values for the two groups we can see an almost perfect overlap in rMSSD values, together with a consistent reduction in HR for endurance sports (also to be expected given the different type of training):
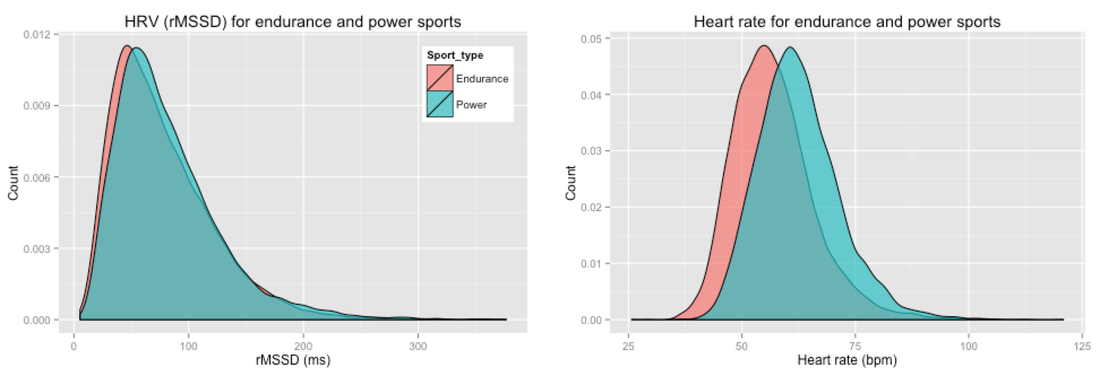
The slightly lower rMSSD for endurance athletes might be due to an average higher age. However, age does not seem to influence much HR at rest, and the differences in HR shown above might be more related to the effect of endurance training on the heart.
|


Register to the mailing list
and try the HRV4Training app! 
|