|
Blog post by Marco Altini.
In this post I will introduce a few new Tags included in HRV4Training and a new feature that will let you explore correlations between physiological parameters (heart rate, heart rate variability) and annotated tags.
There are mainly two reasons I see for introducing new tags and correlations:
More Tags
The new tags are related to Sleep, Training and Lifestyle. The aim is to gather a few more parameters that can be useful in explaining both day to day and long therm chronic variations in HRV.
Sleep
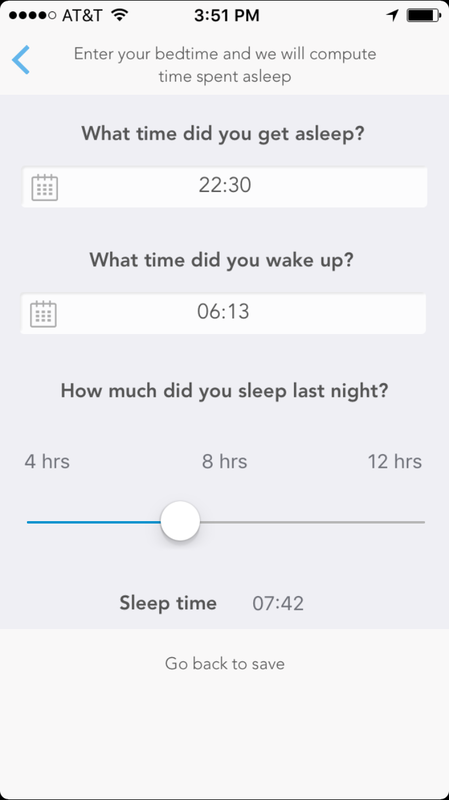
With the previous version of HRV4Training you could provide a subjective score to the quality of your sleep. The new version adds sleep time:
Sleep time is also computed automatically given wakeup time and bedtime.
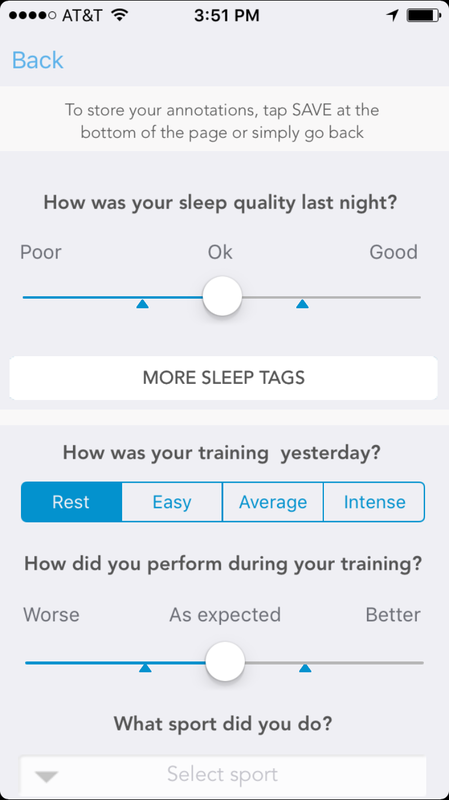
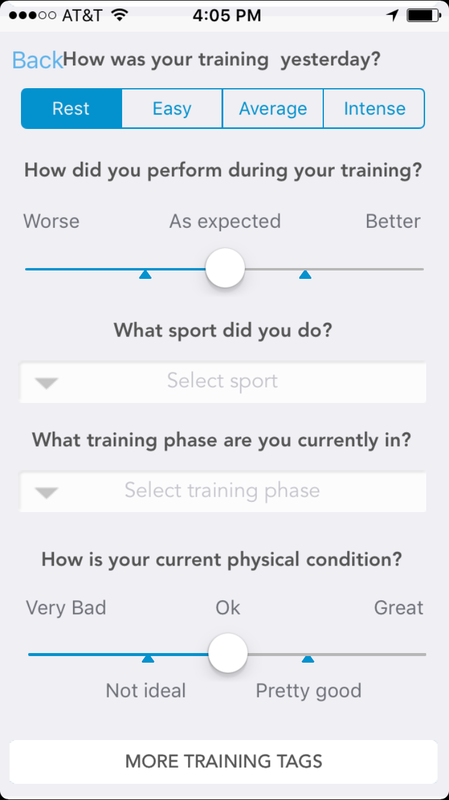
Training
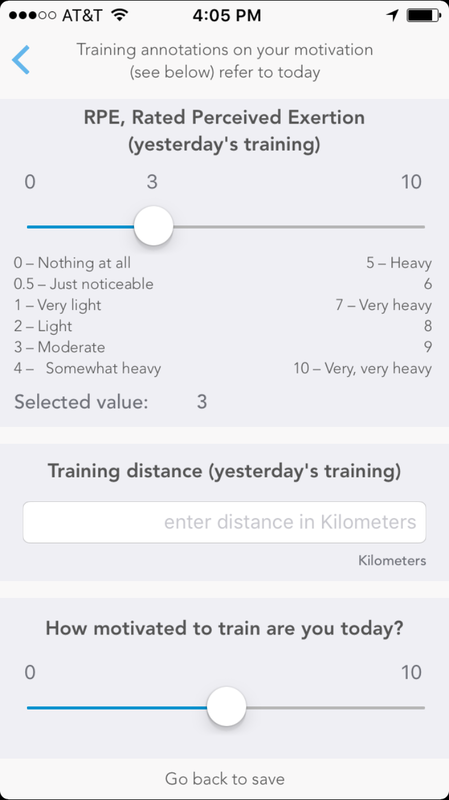
A few new Tags were introduced recently around training (type of sport, training phase, perceived performance and physical condition). Additionally, I added Tags related to more standard ways to estimate training intensity (e.g. RPE or rated perceived exertion), training distance (obviously it makes sense only for certain sports), and motivation.
Lifestyle
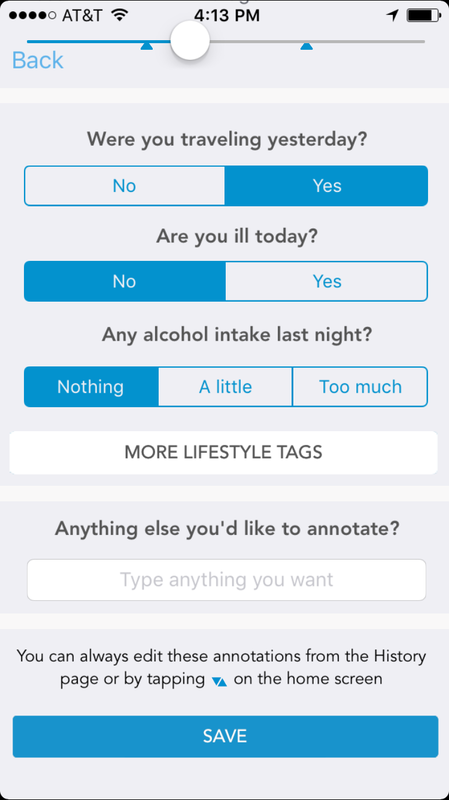
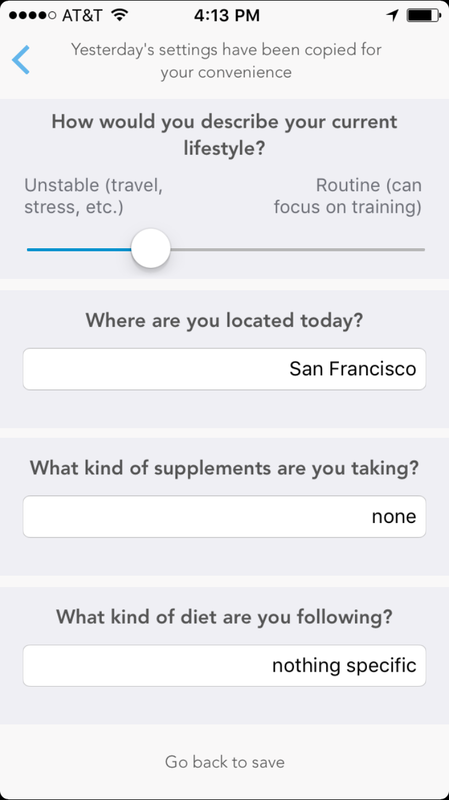
Finally, I included a few more lifestyle Tags that can be useful especially for people often traveling and living a less ordinary lifestyle. Under these conditions, understanding the relation between training and HRV is more complex, due to many other stressors influencing physiology.
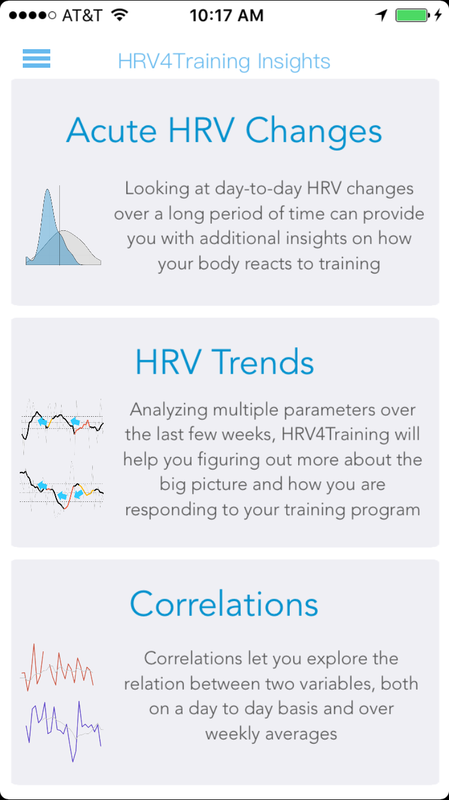
Correlations
Correlations are a simple way to make manual annotations useful to you. Citing Wikipedia:
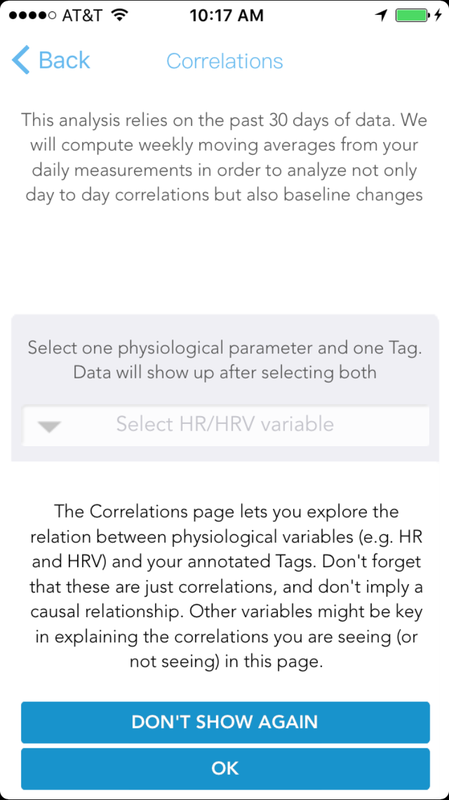
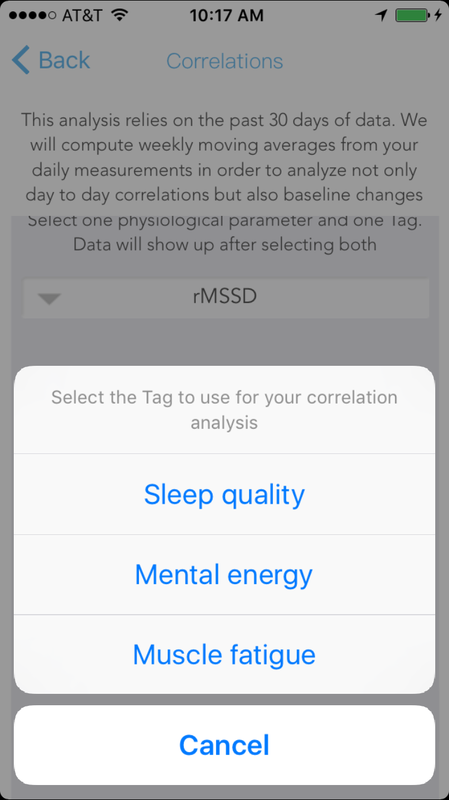
"Correlation refers to any of a broad class of statistical relationships involving dependence. Familiar examples of dependent phenomena include the correlation between the physical statures of parents and their offspring, and the correlation between the demand for a product and its price. Correlations are useful because they can indicate a predictive relationship that can be exploited in practice." There are many limitations around using correlations to understand the relation between two variables, the main one being that correlation does not imply causation. However, looking at correlations is still one of the most practical and useful ways to start exploring a dataset. Here is what you'll get in HRV4Training:
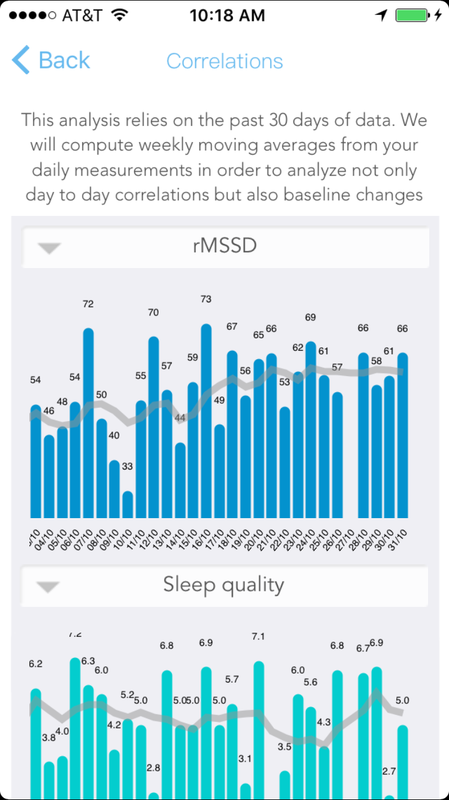
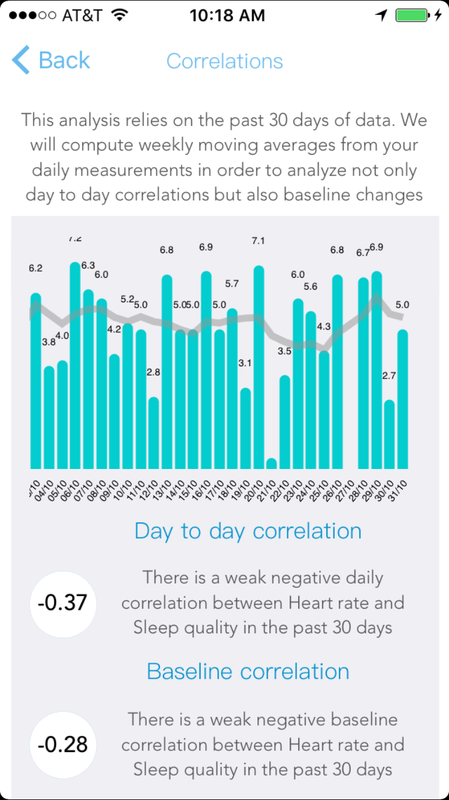
As you can see from the screenshots above, correlations are reported for the day to day data, basically in the same way you annotate it, as well as for baselines (or 7 days moving averages). This way you can evaluate both.
The important part after you start looking at these correlation, is not to jump to conclusions. For example, it could be that the relation you are seeing is actually caused by another variable excluded by the analysis. There are many different ways we use in research and statistical analysis to be able to better understand the relation between variables, beyond correlation. For example, a common step in analyzing the relation between an outcome variable of interest (say rMSSD) and a dependent variable (e.g. sleep quality) is to "control for other variables", e.g. build a model including dependent variables beyond sleep (e.g. training intensity) that could be affecting rMSSD. When in doubt, always remember this: 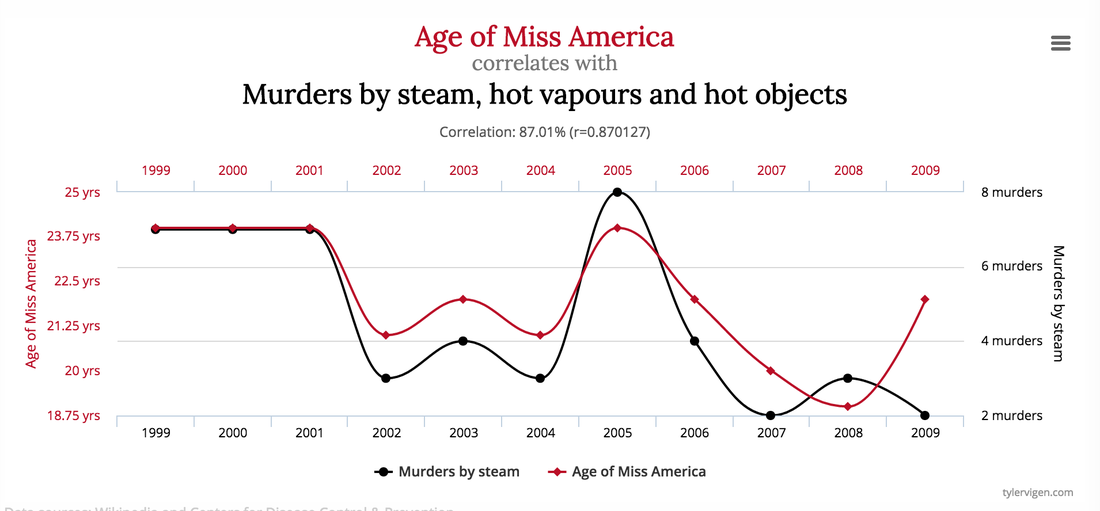
You can find many other spurious correlations here. I chose the one above because the two time series do not simply trend up or down over time, but have a sort of complex and very similar behavior regardless of having nothing to do with each other.
What's next?
As I have briefly explained above I am particularly interested in the opportunity to "outsource" data collection for research to HRV4Training users, so that new models explaining the relation between training, lifestyle factors, physiological parameters and performance can be developed.
This is a trend we are seeing more and more, especially with the release of ResearchKit earlier this year, and the involvement of big companies like Apple. The main idea is that instead of running expensive clinical trials on a bunch of participants, we can try to provide clinical grade tools (a bit optimistic) to users/consumers, and acquire a much bigger dataset that can allow a better understanding of the relations between our outcome of interest and other variables. Things are a bit more complicated than this, bit you get the point. HRV in the context of training is a rather mature field, with many assumptions that have been validated multiple times (see the relation between training intensity and acute HRV changes in aerobic sports). However, when moving towards more complex trends analysis, and introducing multiple parameters to try to better understand the relation between physiological responses to training programs and performance, things get more complex. From many studies it also seems that there is no model that fits everyone, but analysis of long term HR/HRV trends requires personalized assessments for each athlete. By letting users annotate a few extra Tags, most importantly perceived performance and physical condition, I hope we can start investigating what are the most important parameters affecting physical condition for each individual, and build personalized models that each user or athlete can use to further optimize performance. To do so, we need the right reference points (i.e. the Tags) as well as plenty of data from plenty of users. If you are using the app, try to take the time to provide your Tags accurately every day, and hopefully the whole community will benefit in the future. Like the app and the blog?
If you like the app and or the blog, take a minute to review HRV4Training on the Apple store. The haters always have plenty of time ;)
HRV4Training on Facebook
HRV4Training is on Facebook, I plan to use this page as a centralized place for feedback, discussions, feature requests, bug reports and to introduce new features and changes in the app.
Especially for the ones that are not much into Twitter, feel free to use the FacebookHRV4Training page as a place to open discussions around HRV, training, performance and more. I'll try to be responsive so that the whole community can benefit.
0 Comments
Your comment will be posted after it is approved.
Leave a Reply. |


Register to the mailing list
and try the HRV4Training app! 
|