|
Blog post by Marco Altini.
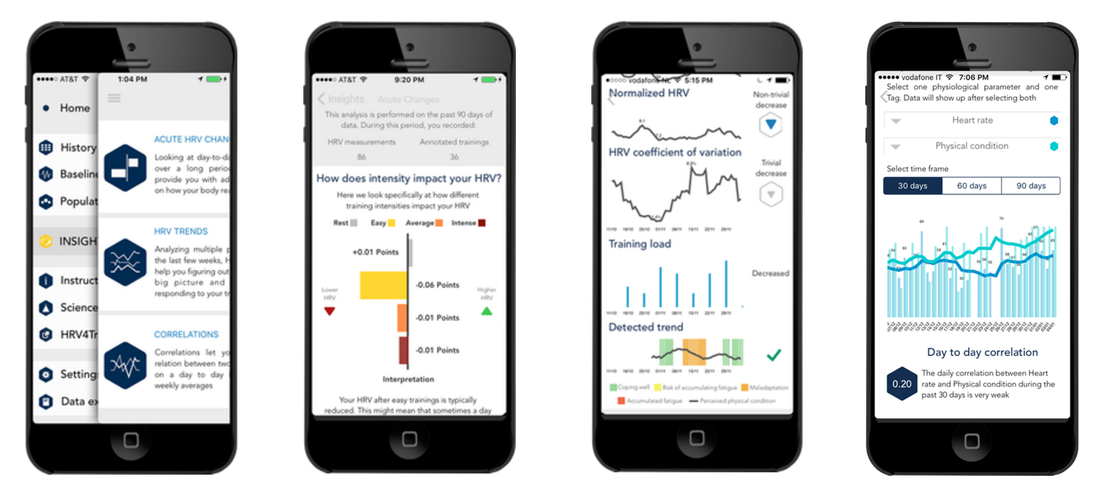
In the past few months we've been introducing different features under the Insights section of HRV4Training, aiming at providing more systematic and practical analysis of the relation between physiological parameters and training as well as more freedom to explore your own data, beyond the daily advice provided in the home screen. In particular, we currently provide the three following Insights:
In this post we cover the latest changes that are coming to the app in the next few weeks.
Acute HR(V) Changes
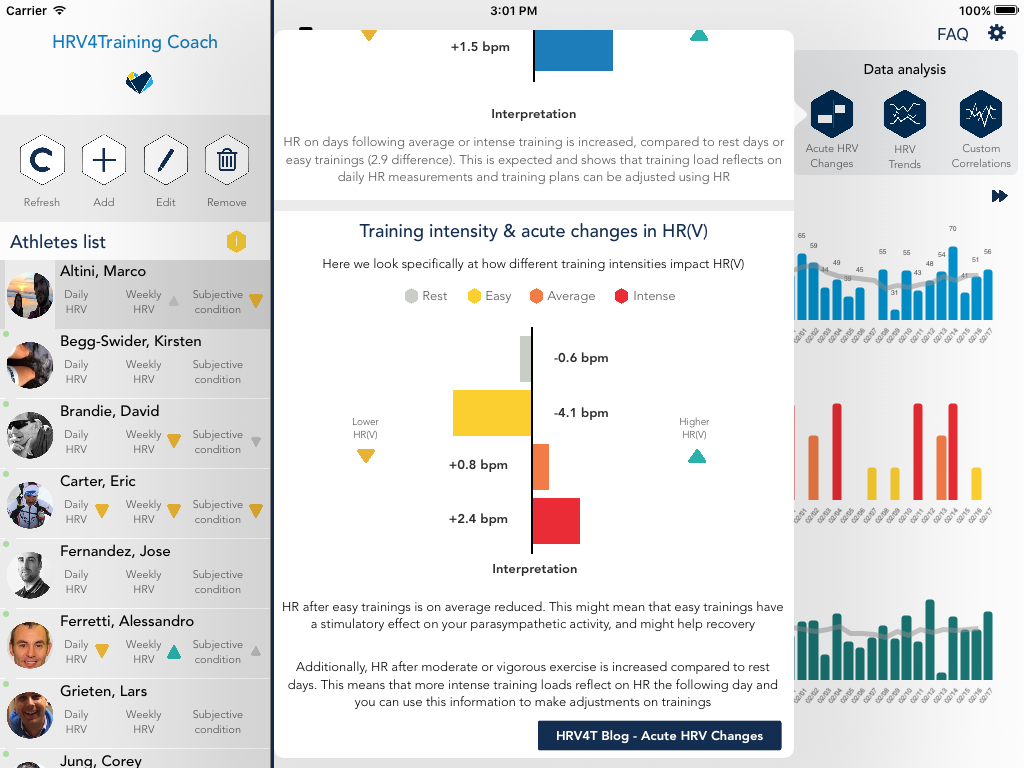
The Acute HRV Changes analysis used to provide insights on the change in Recovery Points following training days, and also a breakdown by training intensity.
From the next version of HRV4Training, you will be able to pick different physiological metrics (e.g. heart rate, rMSSD) and analyze how they change with respect to training. Typically, we expect small changes in HR, with increases in HR on days following intense training in the order of a few beats, as well as reductions in HRV (rMSSD or Recovery Points) on days following intense trainings. See below for an example: 
The same functionality is also available in HRV4Training Coach, and you can run it on all your athletes, if you are a user of the Coach platform:
This analysis is one of the easiest and more practical ways to benefit from HRV analysis and analyze systematically day to day variations to better understand if we can use HRV to guide training in the long term. We are also excited to announce that we've been performing such acute HRV changes analysis on a dataset of almost 800 HRV4Training users that recorded data for periods of 3 weeks to 5 months, and recently submitted a paper highlighting our findings (to the 38th Annual International Conference of the IEEE Engineering in Medicine and Biology Society): 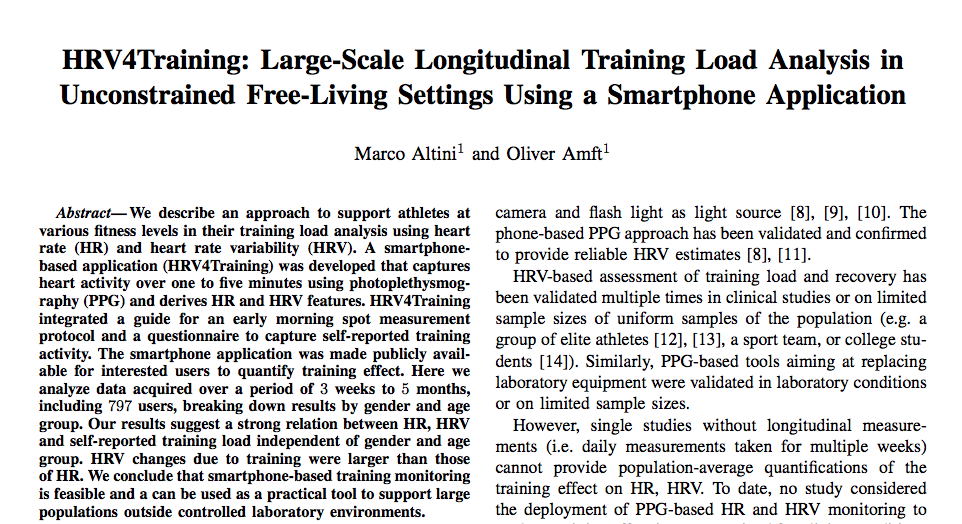
We will discuss the results of this paper later on when it is published. However, reductions in HRV and increases in HR on days following more intense trainings, with respect to rest or easy trainings, were detected consistently on a large population, regardless of age group and gender, indirectly validating the effectiveness of tools like HRV4Training in capturing training load information in unconstrained free-living settings. You can perform the same analysis inside the app when you have more than 40 days of data. Ideally, 3 months of data are required. As usual, remember that your physiological data (HR/HRV) is affected by many parameters, and if your lifestyle is very stressful (much traveling, or other major sources of stress), you might not be able to see the relations explained above. Here are a few useful suggestions if you see unexpected results. HRV Trends
We made limited changes to the HRV Trends page, mainly to provide more flexibility around the training load plot. You can now choose between Distance, TSS, training intensity and RPE as metric to be displayed. We also smoothed out a bit the baselines (they are still 7 days moving averages):
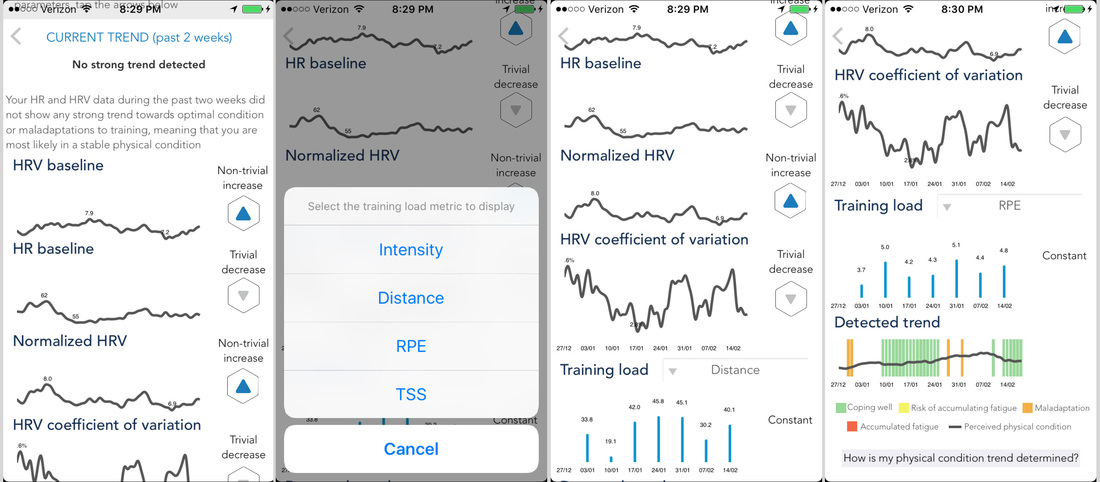
The HRV trends feature is one of the most experimental. Currently, we are trying to determine your physical activity condition trend based on common multi-parameter trends highlighted in state of the art research up to date. However, our goal is to use HRV4Training data and your own self-reported physical condition to develop new models able to determine with higher accuracy at the individual level what is your current physical condition. As you collect more data and provide insights on your perceived physical condition, we will be updating these models to learn from your past data and hopefully provide more accurate results. Correlations and Tags
A few weeks ago we introduced a complete redesign of our Tags, providing much more flexibility. You can now pick only the Tags you are interested in, and most importantly you can create your own custom Tags (up to 3 numerical variables).
Here is an example of how I used the custom tags to track sleep quality as measured by Beddit. First, you need to go in "Configure TAGS" that you can find either right after the measurement or in Settings. Then you can enter whatever name for your variable, and at that point it will be shown every time you fill in your Tags after the measurement: 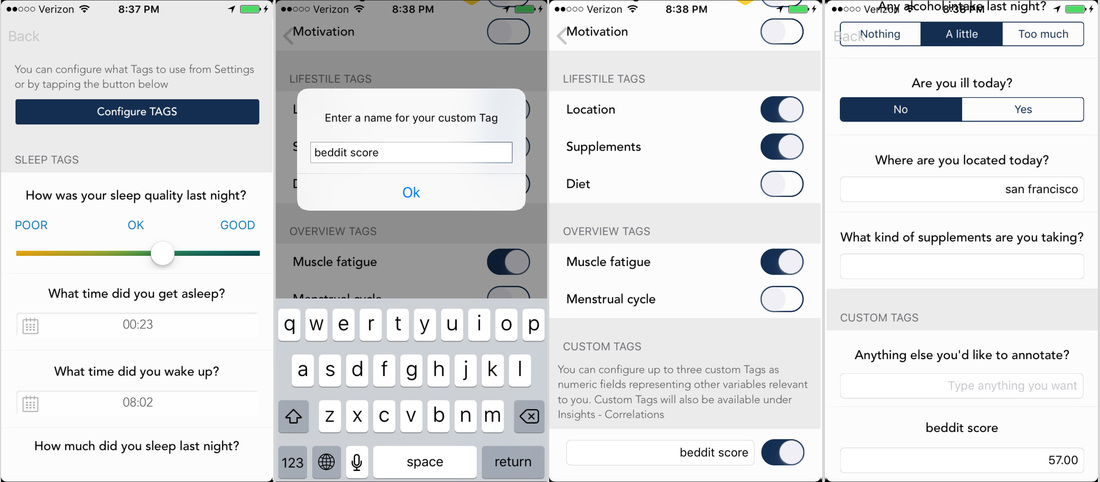
You can use any numerical variable. From the next version of HRV4Training, you will be able to select your custom Tags for the correlation analysis as well. Additionally, the app will now remember your last choice of parameters, and load them by default when you open the Correlations page: 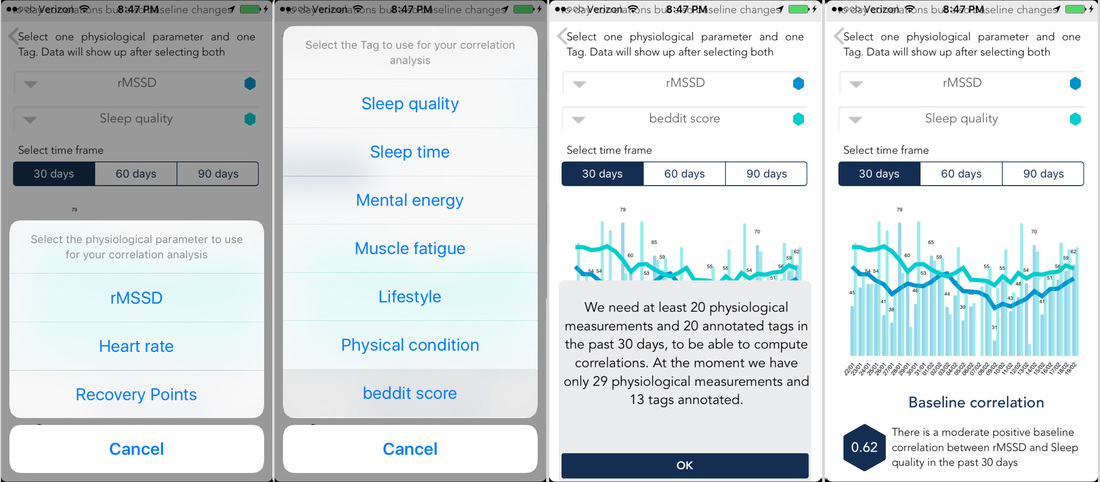
As you can see we can now select custom Tags (e.g. beddit score). However I haven't used my Beddit for long enough to look at correlations, since a minimum of 20 measurements are required. I'll have to do with subjective sleep quality for now ;) What's next in HRV4Training
This is all for now on the Insights. The next updates will focus on providing more flexibility for triathletes and everyone doing more than one sport, with History icons that differ based on the sport performed and the possibility to tag double trainings in a single day. Stay tuned.
|


Register to the mailing list
and try the HRV4Training app! 
|