|
Blog post by Marco Altini.
In the last post, I've introduced HRV trends analysis and covered the main parameters of interest as well as a few conditions that can be automatically identified using HRV data and some extra information on the current training plan.
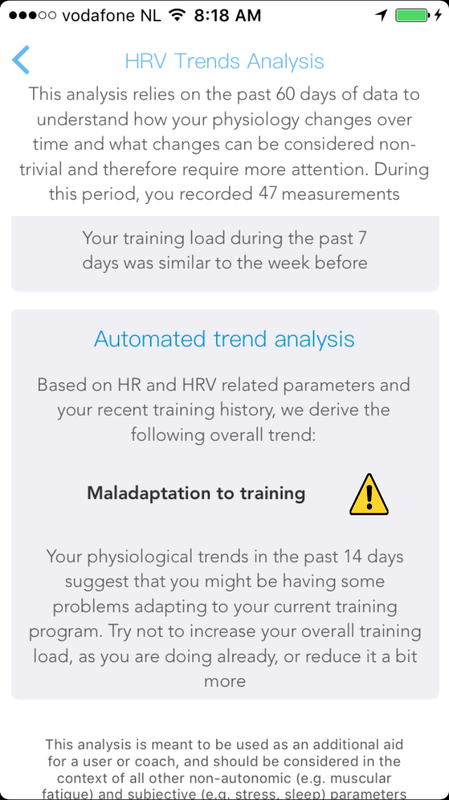
In particular, we looked at using HRV (ln rMSSD), HR, HRV/AVNN and CV ln rMSSD as the parameters of interest to analyze HRV trends. We used all of these parameters together to identify the following conditions: no relevant trends detected, coping well with training, maladaptation to training and accumulated fatigue. I've implemented the same analysis directly in the app, so that you can get the same insights I showed using my own data. Here are a few things you need to know. What will you get?
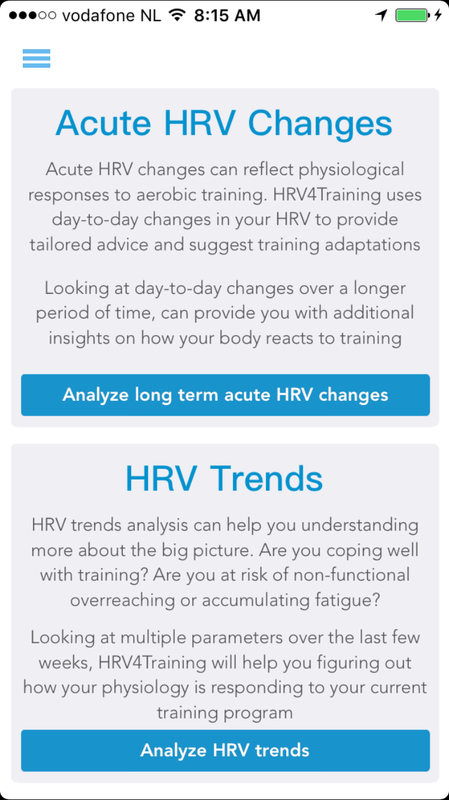
The trends analysis will be accessible under Menu - Insights, similarly to the analysis of acute HRV changes.
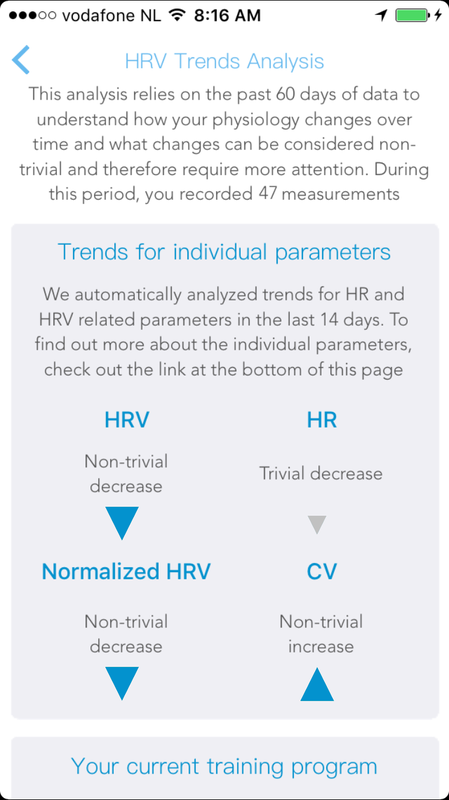
The app will analyze your historical data to determine how the different parameters change over time in your specific case. This is necessary to understand what trends are trivial and should not be considered, and what trends are worth investigating. Then, the non-trivial trends will be used to determine your current condition, based on the last two weeks of data.
The screens above show my condition right now. I've been trying to do intense trainings and intervals in preparation for a race (half marathon coming up in 10 days), however at the same time I got a cold and my data shows indeed that HRV is not looking good and varying a lot on daily basis (non-trivial increase in CV).
How much data do you need?
The trends analysis will always report your current trend, which is detected using the last 2 weeks of moving averages for the parameters above.
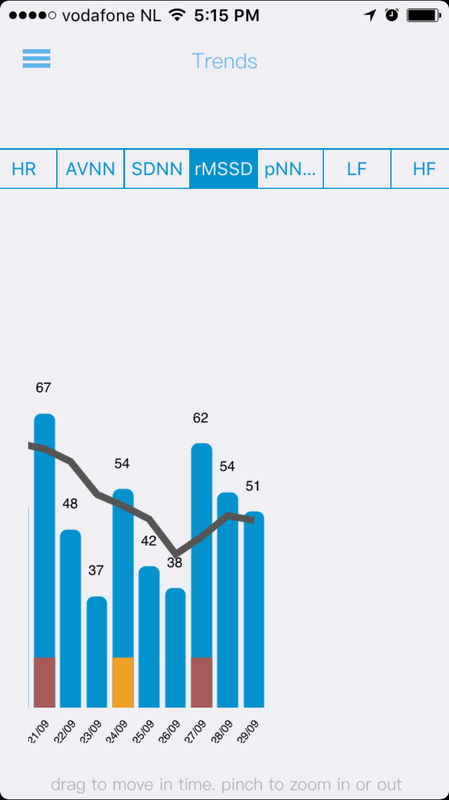
However, the app asks for at least 40 measurements in the past 60 days for the analysis to be performed. Why? The reason for using more data is that the trends analysis needs to understand what trends are just noise (i.e. natural variations in HRV that are not particularly interesting) and what trends are non-trivial and should be part of the analysis. You can see this process better in the figure below, the red and yellow segments follow variations that are non-trivial and should be analyzed further (pointed by the blue arrows). There are clearly variations in the rest of the data as well, but they are not considered by the analysis. This procedure requires more data and is the reason why you will need at least 2 months of measurements before you can start using this feature. 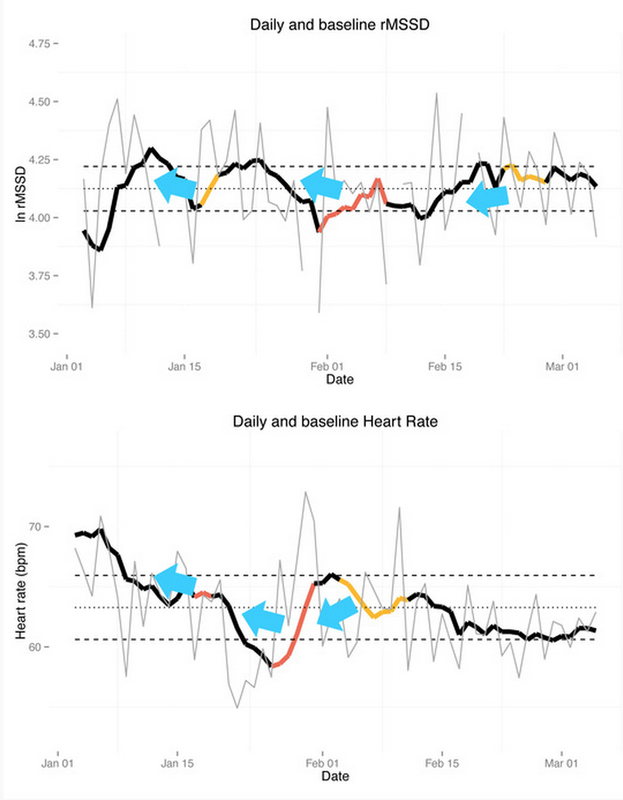
Please note that this analysis is meant to be used as an additional aid for a user or coach, and should be considered in the context of all other non-autonomic (e.g. muscular fatigue) and subjective (e.g. stress, sleep) parameters. Most importantly, the specific training program and training phase need to be considered when analyzing trends. By tagging your trainings in HRV4Training (training intensity and phase) you will provide more context around your current training program, and help automating this analysis The automated trend analysis is an experimental feature and will most likely evolve over time. For questions of feedback on this feature either comment below or contact me on twitter. Your feedback will be of great help to further improve this analysis.
0 Comments
Your comment will be posted after it is approved.
Leave a Reply. |


Register to the mailing list
and try the HRV4Training app! 
|