|
We have just released an improvement in HRV4Training Pro that lets you easily identify periods of significantly higher or lower values in the subjective tags you are tracking with HRV4Training. In particular, the update adds normal values to the plots under the Overview page. The normal values represent the expected value for a certain parameter, given the past two months of historical data. This means that any values outside of this range will be easy to spot (for example days in which you slept much less than normal), and most importantly, you will be able to easily see when your baseline tag (7 days moving average) is outside of your normal values, highlighting how some major change is occurring. Without normal values, it can be difficult to understand if things are just fluctuating in a trivial way, or if there is a larger change that we should be more cautious about. Let's look at a few examples. Below is the data from an athlete that has been prioritizing sleep quality, and we can see that despite some normal variation and a few data points that are particularly high or low (in this case associated to traveling), the baseline never gets outside of normal values, hence confirming that sleep is going well and should not be a major issue or the cause of any significant changes in baseline physiology (e.g. changes in HRV): 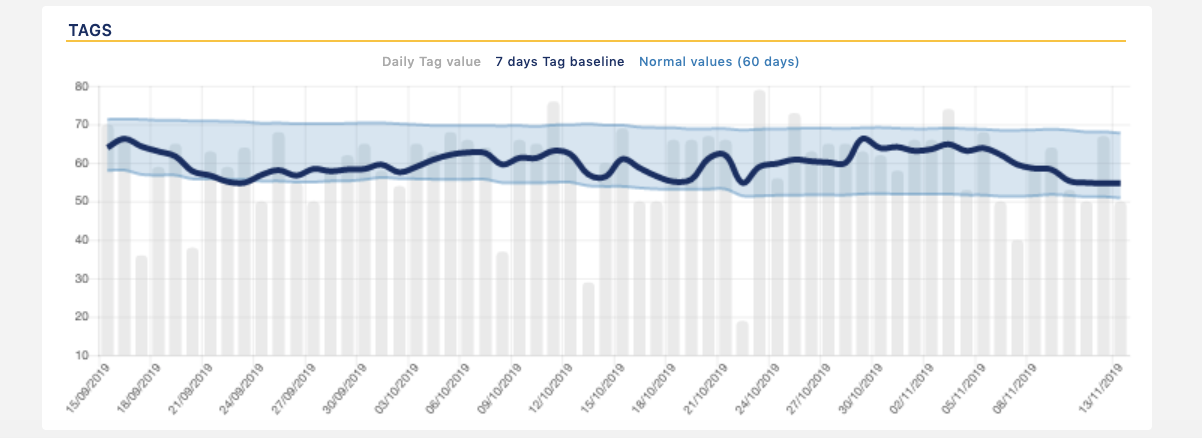 Sleep quality is rather stable despite some variability Below is another example where we look at muscle soreness during marathon training, we can see some peaks here and there, followed by periods of recovery as we alternate long and easy runs, as well as the major impact of the race towards the end, and how long it took subjectively to go back to normal:  Muscle soreness during marathon training And finally, here is a complete example where we can look at changes in resting physiology (HRV), training load and subjectively annotate lifestyle stress, during 2 months that include a few business trips (color coded in the first plot), periods of higher lifestyle stress (due to work and traveling, as shown in the last plot), and marathon training (plus marathon day, the peak in acute load towards the end of the second plot). Using the latest visualization in Pro, it is easy to see when lifestyle stress was much higher than normal for this person, and how only the combination of high load (e.g. the marathon) and high stress brought HRV below normal values, showing that we had significant stress on the body (and staying in that condition for several days, with a difficulty to getting back to homeostasis quickly). On the other hand, periods with high stress earlier where managed better, for example by reducing training load: 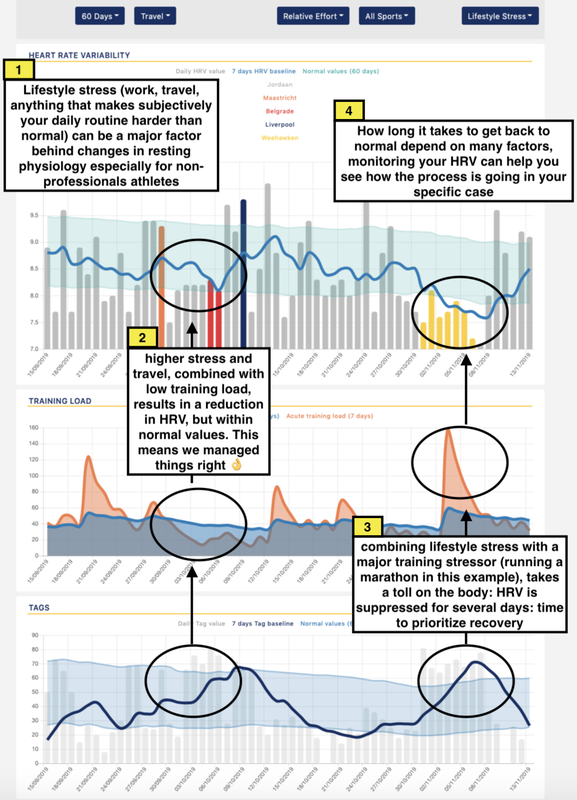 Overview page in HRV4Training Pro. HRV, training load and lifestyle stress are plotted during marathon preparation (and race day). This case study above shows what we know very well already, stress is cumulative and we cannot isolate training and lifestyle stress or think that training is not affected by everything else going on at any given moment in our professional or personal life.
Yet, a simple marker such as HRV, measured in a well defined context (first thing in the morning while in a rested state), can capture stress deriving from all sources and help us make meaningful adjustments to maintain things in check. We hope you'll enjoy the latest update. If you have an HRV4Training account, you can try Pro for free by logging in here. Comments are closed.
|


Register to the mailing list
and try the HRV4Training app! 
|