HRV4Training
  • Home
  • QuickStart Guide
  • PRO & TEAMS
  • FAQ
  • Privacy & Terms
  • Contact
  • Publications
  • Blog
  • Shop

HRV4Training Coach: Advanced view & new pricing for personal use

6/11/2016

0 Comments

 
Blog post by Marco Altini.

We've made a few improvements to HRV4Training Coach, and introduced a new (cheaper) pricing for personal use.

For the ones interested in using HRV4Training Coach for personal use, without the necessity to add additional athletes to monitor, you can find the app here, starting at 9.99 USD (30% of the previous low tier). 

HRV4Training Coach features a new advanced view that you can use to ease interpretation of HRV data for your own analysis as well as your team data. The latest Coach app can now show you the daily score, daily advice, desirable range, HRV baseline and normalized HRV baseline. We have also added the training load plot directly to the main view.

Finally, for coaches interested in using the platform for their team, we have a few additional features:
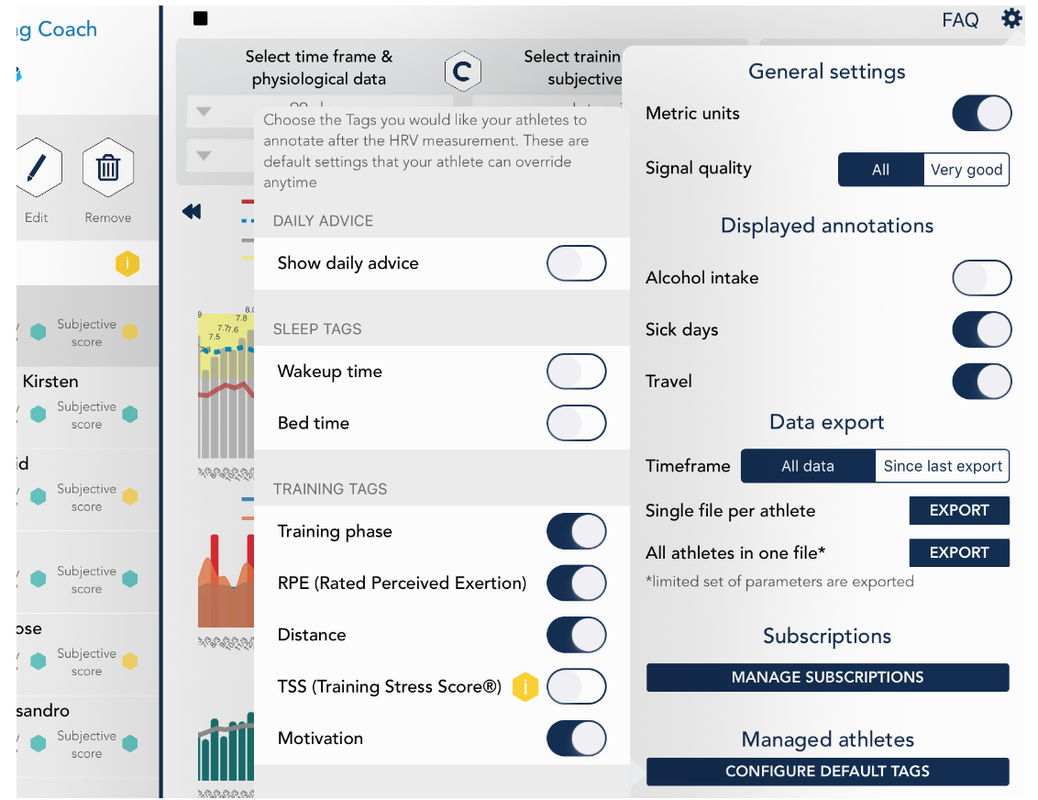
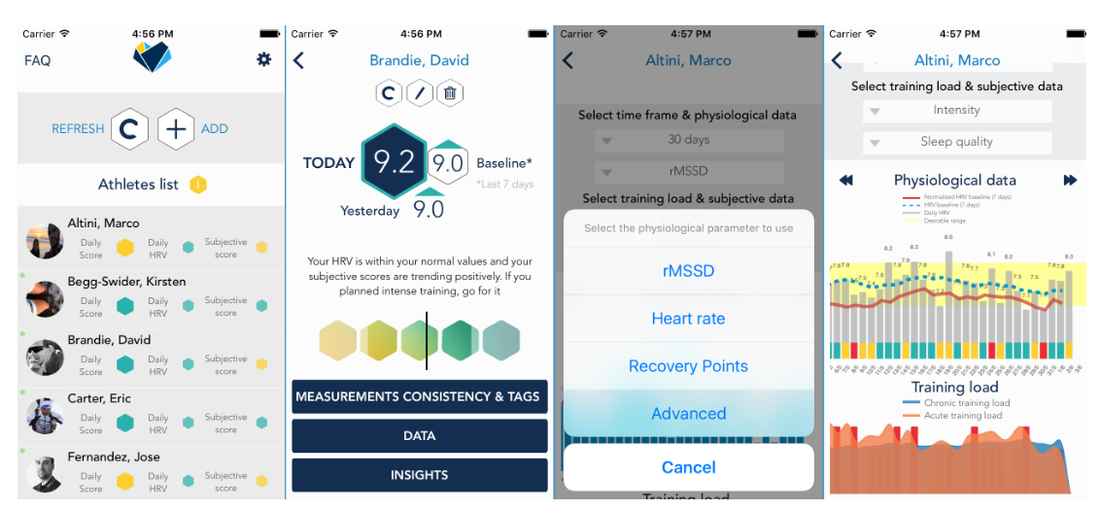
  • Remote tags configuration - you can now configure remotely the tags you'd like your athletes to use by default. As we provide many different tags and not all of them are relevant in different sports, this way you can make it simpler for your athletes and track only the variables relevant to you. The remote configuration will also let you disable the daily advice if you'd rather do so. Note that this is just a default configuration, your athletes will still be able to change settings
  • Team export -  you can now export data not only for each individual athlete but also for all your athletes at the same time as a csv file, which should make it easier to import data in other tools for further processing. The team export will also include additional parameters such as the new daily advice
  • improved athletes overview - the athletes list provides an overview of the daily advice, daily HRV and subjective score, so that you can get an overview of your entire team and take action without having to go through all the data for each individual athlete
Picture
Picture

How can you use the advanced view?

Daily HRV, Desirable range, HRV baseline and Normalized HRV

The new advanced view is available on both iPad and iPhone, and provides the following parameters:
  • Daily HRV: Your recovery points, based on ln rMSSD, the most commonly used metric in sports science to quantify parasympathetic activity & recovery. This is what you have also in the regular app home screen.
  • HRV Baseline: 7 days moving average of your recent HRV (Recovery Points). The dashed line shows you your recent trend, and can be interpreted as a more stable marker of how things are going recently, as by definition it is less affected by day to day variability.
  • Desirable Range: highlighted in yellow you can see the desirable range, basically based on your historical data we can determine what is your normal HRV range, and hypothesize that anything inside that range is simply related to normal day to day physiological variations, while values outside of this range are the ones to analyze more carefully. We do this also in the regular app, to provide the daily advice.
  • Normalized HRV: normalized HRV (sometimes called rMSSD / RR ratio, basically the ratio between HRV and the average RR intervals, which is the inverse of Heart Rate), becomes particularly useful in certain situations. For example, sometimes HRV might be decreasing, as part of a particularly intense training block, and we might be worried that the decrease is signaling maladaptation to training. However, especially for elite athletes with particularly low HR and potentially saturated HRV, looking at the normalized HRV can shed some light on the low HRV being either no problem because potentially saturated or actually being representative of maladaptation. What you should aim for, is a steady or downwards trend for this parameter, which is what happens when your HR is also stable or decreasing.
By looking at all of these parameters together, you should be able to have a good overview of the physiological data for you or your athletes, and adjust training plans accordingly. For example, a downward HRV baseline trend, can be used to postpone intense training blocks, as previously reported by Vesterinen et al. 
Picture
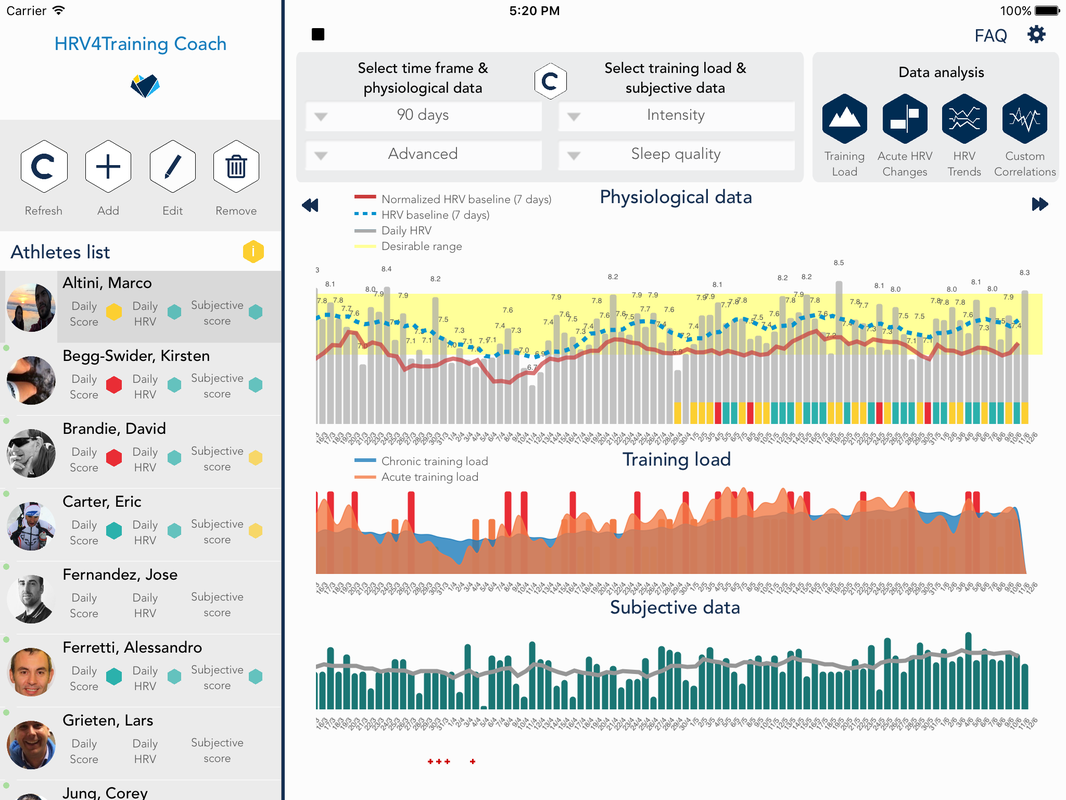
In the figure above, you can see an example for my own data. After being sick around the end of March, my HRV went below my normal values, showing quite clearly poor form. 

Right after I increased load maybe a bit too much, and the body response was improved HRV (after being sick we expect to go back to baseline), but still with higher HR, as the Normalized HRV was trending upwards, while a lower HR would keep it more stable. The struggle was captured quite well also by the automated trends analysis, that you can see below:
Picture
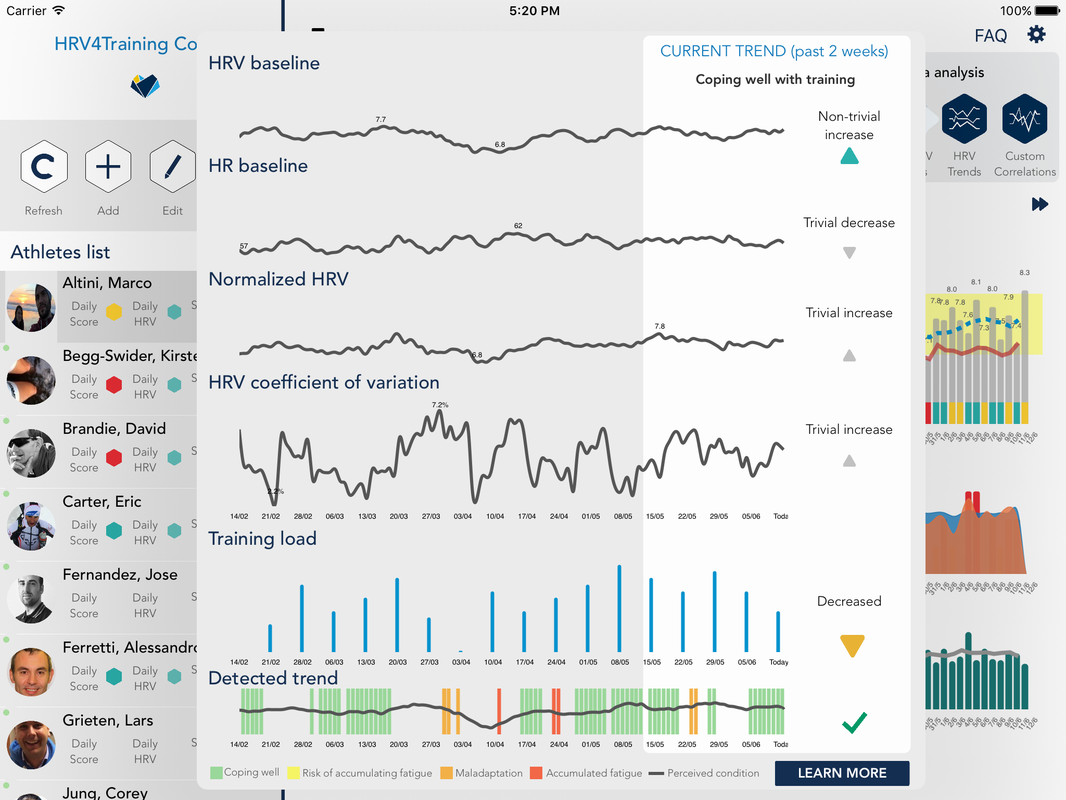
Above we can see a few interesting points between the end of March and first weeks of April:
  • As I was sick, my HRV was down, and the coefficient of variation was also down. Often we prefer a low coefficient of variation, as it means your HRV jumps around less, and you might be coping well with your training plan. However, this needs to be always interpreted with respect to other variables, because when our physiology is completely crashed (e.g. while being sick), the coefficient of variation will still be low, but definitely not for good reasons. The app is able to discriminate by looking at training load, but could also include additional metrics in the future.
  • The app captures how a low coefficient of variation together with a decreased training load, a reduction in HRV, and increase in normalized HRV, is representative of maladaptation to training (last plot). Maladaptation here is used as a broad term indicating that physiologically speaking, things are not looking good.
  • Right after being sick, I increased training load possibly too much with respect to what I should have, which resulted in coping poorly, and normalized HRV trending even higher (as shown also before in the new advanced view), and the app detecting accumulated fatigue.

While the automated trends analysis is an experimental feature, combining all the parameters described above can provide good insights on the overall physical condition.

The gray line shown on top of the detected trend plot is the subjective physical condition tag, which in my case is quite highly correlated with my HRV, as shown by the plot below:
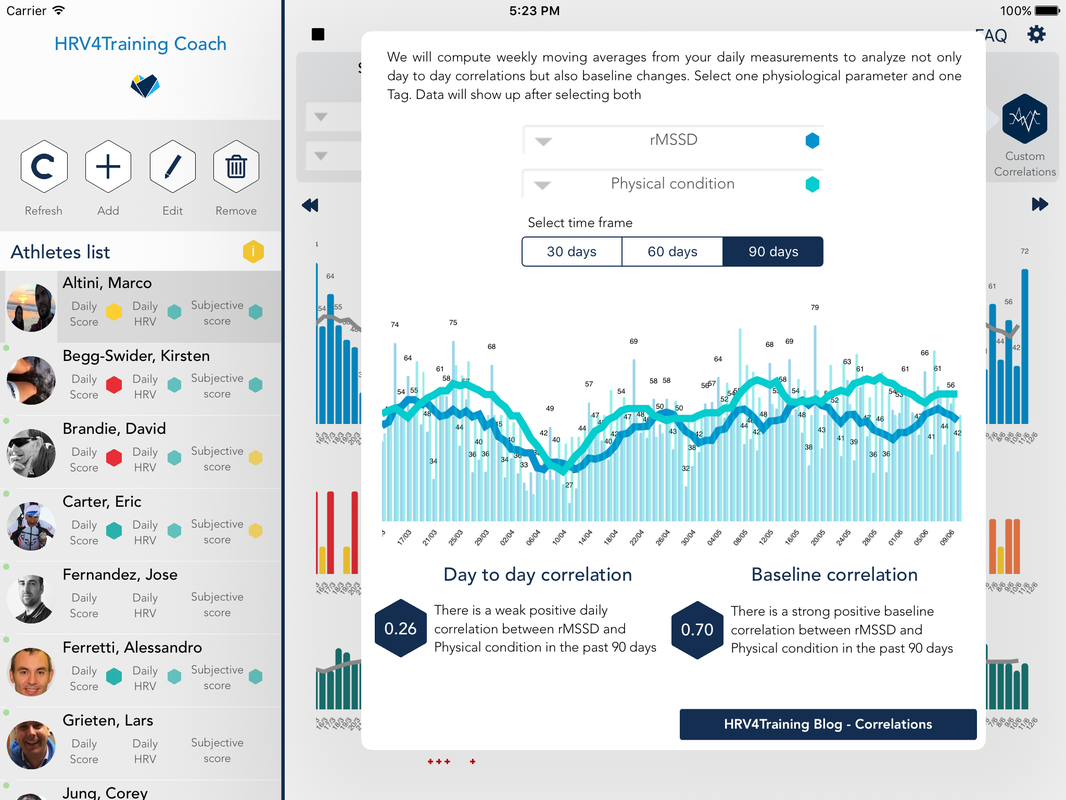
Picture

Summary

In this post we've shown how the new advanced view can be used to interpret multi-parameter physiological data, as well as how the automated trends analysis uses these variables to provide additional insights. In particular, the advanced view provides more perspective on your values using the highlighted desirable range, and helps discriminating parasympathetic saturation using not only HRV data but also Normalized HRV.

You can get HRV4Training Coach at this link, and shoot us an email in case you have any questions or would like to get a free trial.
0 Comments

Your comment will be posted after it is approved.


Leave a Reply.

    Picture
    Picture
    Register to the mailing list
    and try the HRV4Training app!
    Picture
    Picture
Picture
  • Home
  • QuickStart Guide
  • PRO & TEAMS
  • FAQ
  • Privacy & Terms
  • Contact
  • Publications
  • Blog
  • Shop