HRV measurement time of the day: does more consistency ease interpretation of acute HRV changes?11/8/2015
Blog post by Marco Altini.
In the last post I analyzed acute HRV changes on data gathered from ~400 HRV4Training users. Acute HRV changes are day to day changes in HRV following trainings of different intensities, and we've seen how we can use such acute HRV changes as a proxy of training load.
In this post I want to expand a bit on the previous analysis, by looking at consistency in the measurement's time of the day. I've stressed multiple times the importance of being consistent and following the best practices, for example using always the same breathing rate, taking the measurement right after waking up and in the same body position, and so on. The dataset analyzed in the previous post includes 375 users that recorded on average 50 measurements in the last 60 days. Additionally, 98% of these users recorded data in the same conditions (camera measurement, 60 seconds duration and 8 breaths per minute). Since we have many measurements per user, and almost all users measured following a similar protocol, we can use the data to try to understand the importance of being consistent in terms of measurement time of the day. While taking the measurement right after waking up helps, we don't always wake up at the same time. There can be obviously different reasons for an inconsistent wakeup time (late night, early meetings, early trainings, bad night of sleep, etc.), and it should be no surprise that additional factors related to this inconsistency might influence our HRV measurement (even just the circadian rhythm). To try to answer the question above, i.e. does more consistency ease interpretation of acute HRV changes?, I first computed the mean and standard deviation of each user's time of measurement. Here is a plot showing the mean for each user: 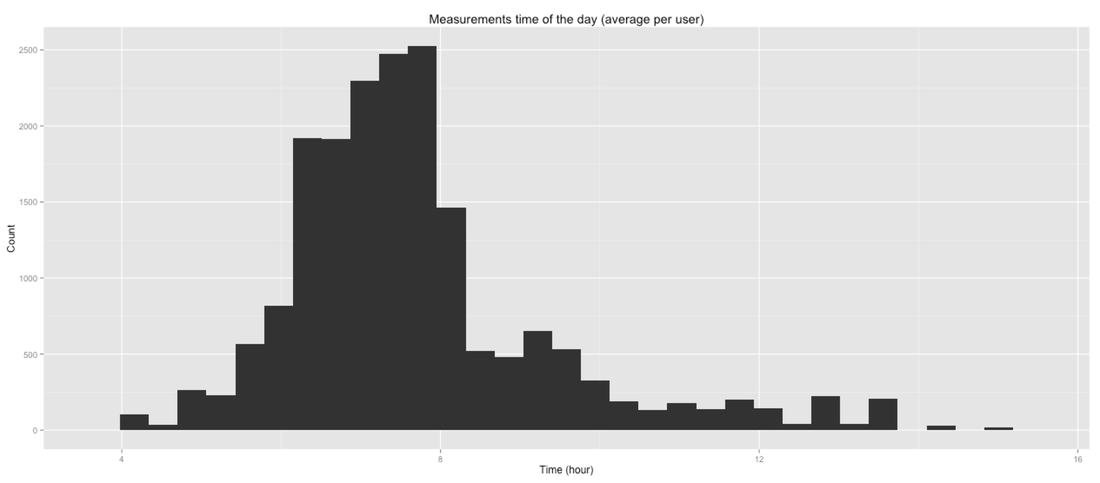
We can see how measurements peak at more or less 07:45 in the morning, that's when most HRV4Training users wake up.
Then, I split all users into two groups, consistent and inconsistent users, based on the standard deviation of the measurement's time of the day. Basically the more variability in the measurement's time, the more likely the user to be labeled inconsistent. Here is an example of data from 20 users, we can see how the users labeled as inconsistent have measurements more spread out: 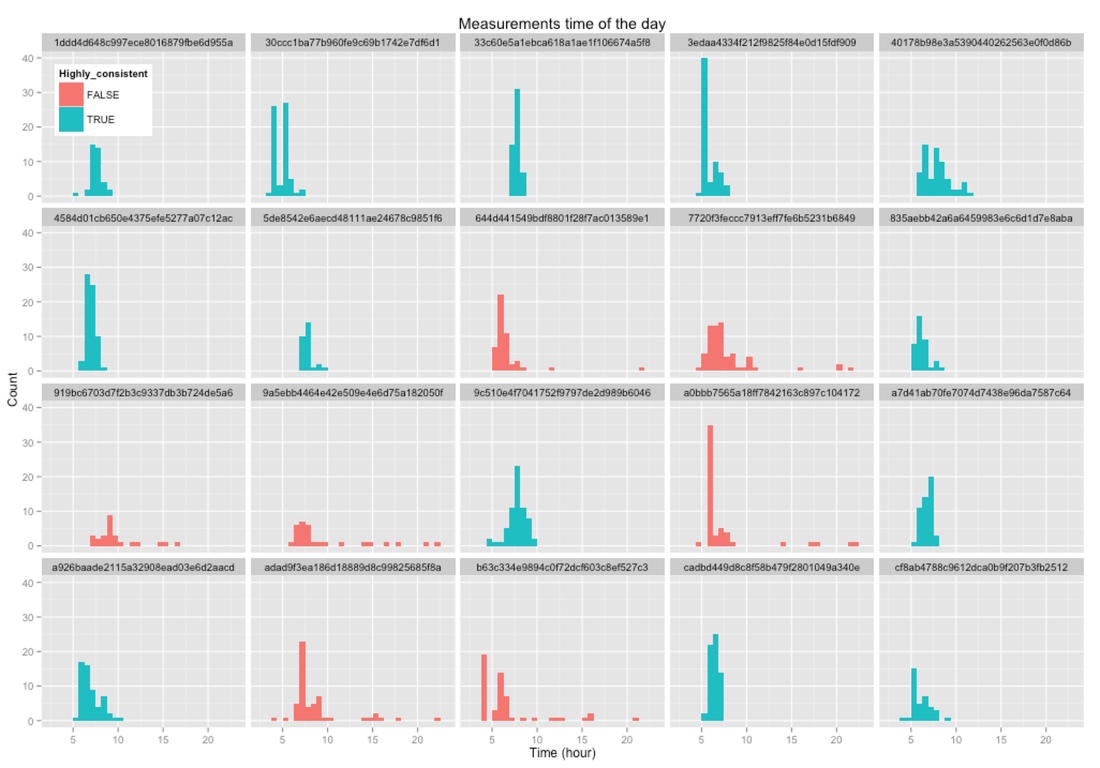
Now that we have our two groups (197 consistent users, for about ~10000 measurements, and 180 less consistent users, for another ~8400 measurements), we can perform the usual analysis of acute HRV changes to see if there are any differences between the two groups. What we do is to compute the daily change in HRV on a day following a training, and then break it down by training intensity, based on manual annotations reported by the users. Here is what we obtain: 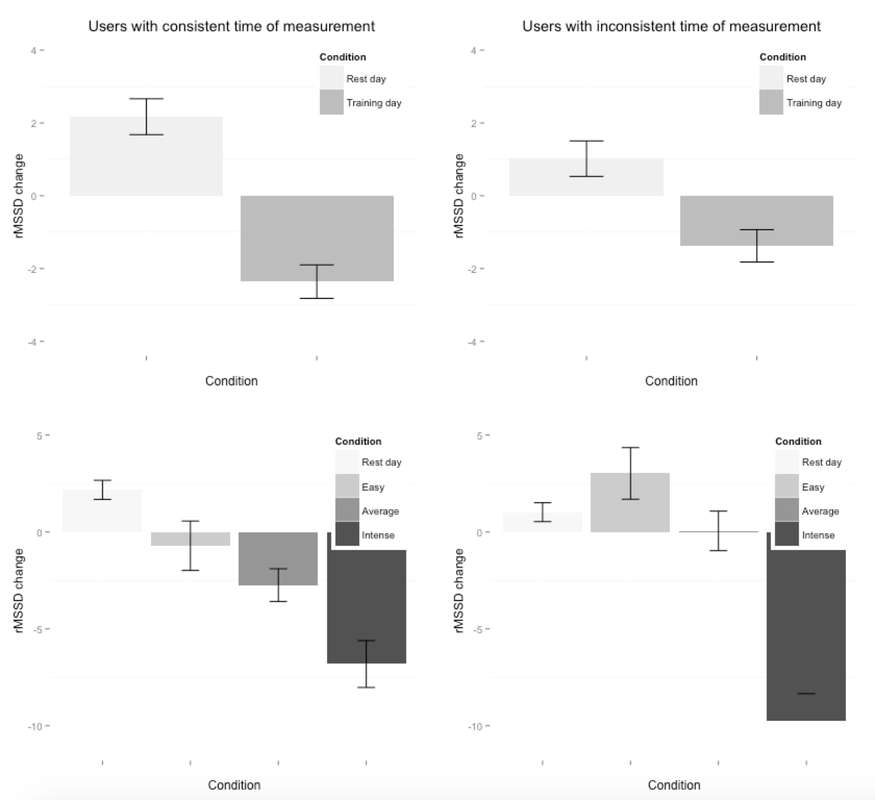
The two plots on the left refer to users measuring consistently more or less at the same time every day, while the two plots on the right are relative to less consistent users. We can highlight a couple of things: first, for both groups we can clearly see a difference between rest day and training day. HRV is typically increased following a day of rest, and is typically decreased following training. However, the differences are more marked when measurements are more consistent (see the two top plots). Secondly, when we try to break down the relation between HRV and training by training intensity, things get more complicated. For consistent users, we see a gradual decrease in HRV with increased intensity, pretty much what we expect. Rest days cause an increase in HRV, easy trainings are a bit all over the place (might stimulate parasympathetic activity), while average and intense trainings clearly show reduced HRV. On the other hand, for inconsistent users (bottom right plot), we see the expected results only for intense trainings. The rest of the data is more difficult to interpret, with average intensity trainings showing no consistent decrease in HRV. What does this mean? It could mean that being more consistent with our measurement makes it easier to interpret HRV data in the context of training. This is what we would expect, since as we know physiological stress is affected by a long list of factors, and the more we are consistent (on all aspects of our measurements and lifestyle) the better. However, it could also be that the consistent measurements are taken by hardcore athletes with a primary focus in training, while less consistent measurements are taken by users with all sort of other things on their mind, therefore making our conclusions less valid. Hard to say. What we can do though, is to look at the two group's characteristics, to determine if there are marked differences in their composition or not. The more similar the groups, the more we might trust our speculation on the relation between measurements consistency and interpretation of acute HRV changes with respect to training. Here are the user's characteristics: 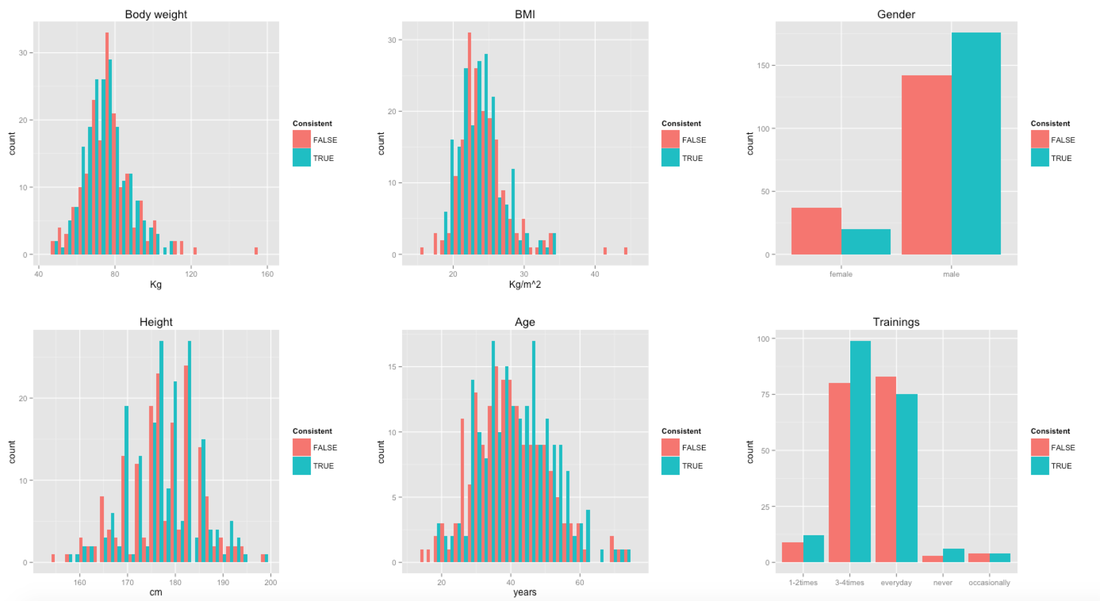
And here are the user's average heart rate and heart rate variability (rMSSD): 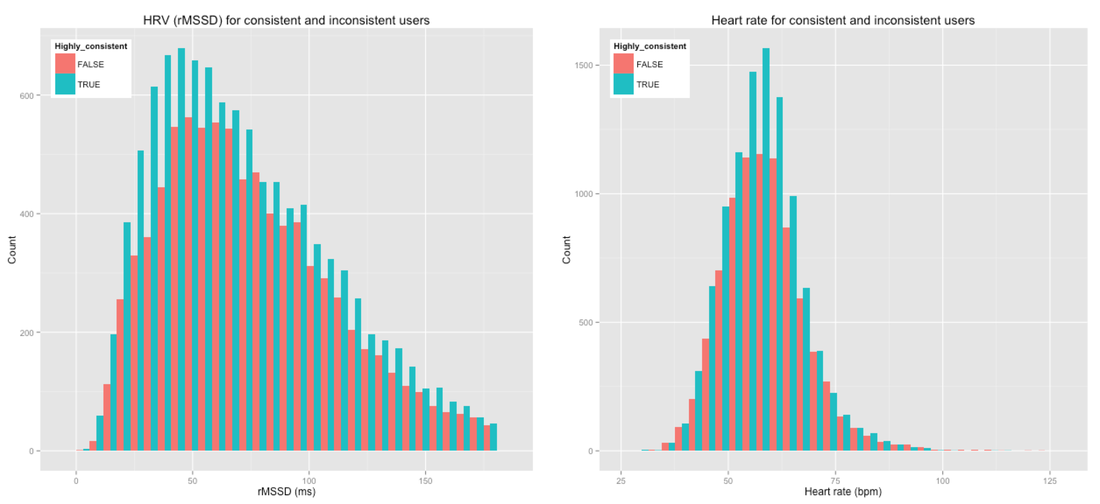
And finally a breakdown by sport:
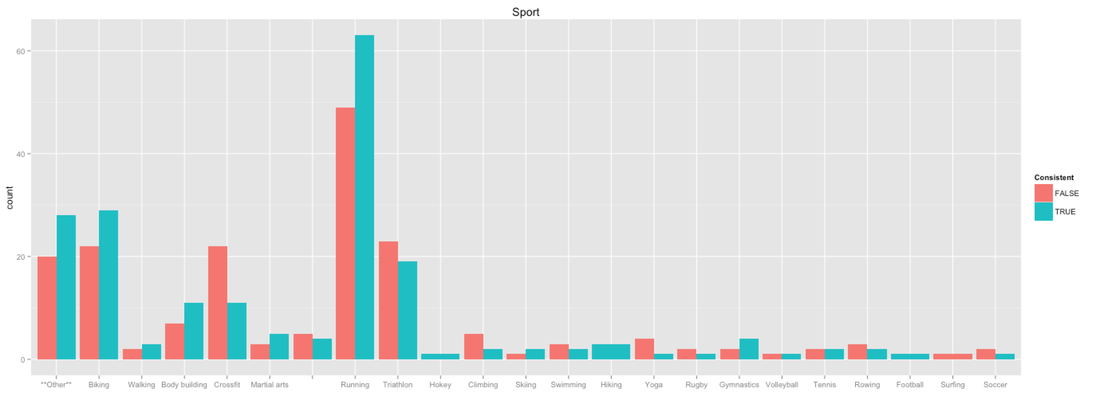
From these plots it seems the two groups are fairly similar. They certainly are in terms of HR/HRV, as well as in terms of trainings per week, height, body weight, BMI and sports practiced. Men seem to be slightly more consistent, same holds for older user. Since the analysis of acute HRV changes is performed at the individual level (i.e. we analyze how HRV changes with respect to a person's previous day value, regardless of other users), these small differences should not affect much this analysis. Summary
We've talked multiple times about the importance of following best practices for short, unconstrained HRV measurements. The main point is to try to make these measurements as close as possible to what we typically measure in clinical practice under laboratory conditions.
Measurement time of the day is an important parameter, and it certainly reflects how "stable" our lifestyle is. In this analysis we've seen how interpretation of acute HRV changes seems easier (and probably less confounded by other factors) when we are more consistent with our measurements. I hope in future posts to be able to perform more of these analysis, in which we can analyze the impact of different parameters on the accuracy and effectiveness of HRV measurements, at a scale that is possible only due to consumer applications like HRV4Training,
|


Register to the mailing list
and try the HRV4Training app! 
|