|
Blog post by Marco Altini
In this post I'll try to give some practical suggestions on how to make use of physiological measurements, in particular heart rate variability (HRV). There's plenty of articles online on what is HRV, how it represents parasympathetic activity and how the whole principle is used to quantify recovery. However, there seem to be still a disconnect between the theory, and getting more practical in using these data effectively. This post will be far from complete, but I hope it will you give some good starting points. Measure | Optimize | Perform
First of, collect data. Measure. Measure. Measure. Physiology is 1) very personal 2) affected by many factors. The more data you have the better you will understand how to use them effectively. I believe it's important to collect data for quite some time without implementing any changes or interventions. This way you will become part of the decision process, as you will start to understand how HR & HRV responses and trends work for you, over time.
Optimize. Once you start understanding what affects your physiology and to what extent (see later), it's time to start making adjustments based on your unique physiological responses. Training load models typically ignore physiological measures and therefore lack the ability to incorporate in the equation how your body is responding, which can be key in optimizing performance. By measuring HR and HRV using apps like HRV4Training, personalization is now possible. Perform. Measuring and optimizing your trainings based on physiological data allows you to train smarter. We've seen in recent literature athletes performing better when starting intense training blocks only under good physiological conditions, despite having actually trained less than the control group (see full story here). Acute stressors & long term trends
While HRV4Training does much of the interpretation for you, translating your recent trends and daily score in a daily advice that can be used to adjust training, as well as helping you understanding the big picture based on different parameters, breaking down the analysis in acute stressors and long term trends can help understanding a bit better what the data can tell you.
Acute stressors
What's an acute stressor? Acute stressors are events that affect your physiology in the immediate future. Think about an intense aerobic workout, an intercontinental flight, a night out with too many drinks, high caffeine intake, etc. Acute stressors are typically the easiest phenomena to interpret and reproduce, and looking at data in the context of acute stressors can help understanding how your physiology works.
Training
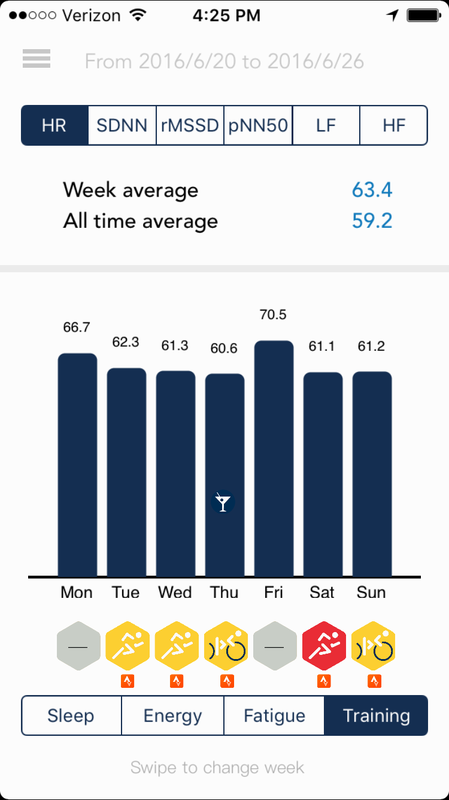
The most relevant here is certainly training, as we aim at using HRV to quantify recovery. We've shown inprevious blog posts and scientific publications, that there is quite a strong relation between intense aerobic workouts and reductions in HRV on the following day. This is a typical acute stressor, and the reduction in HRV (and smaller increase in HR) can be used to quantify recovery and understand if we need an extra day off. Here are some examples from my own data as well as other users of the app:
Examples of strong reductions in HRV on the day following a very intense workout.
On the left, strong reduction in HRV following a 7 hours long ride. On the right, physiological recovery associated to a day off as suggested by HRV4Training on the previous day.
Here I'm showing also results across a broad range of users (about 800 people), as it should be clear this is not just anecdotal evidence:
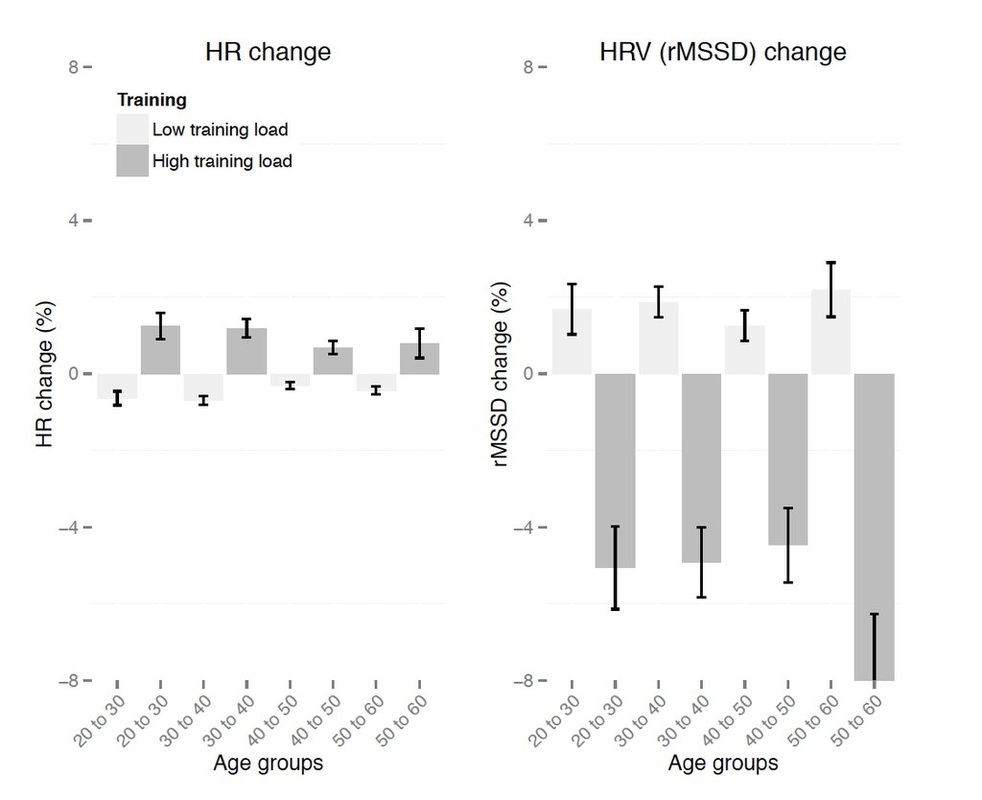
Relation between HR, HRV and training for different age groups. In all conditions HR is consistently increased on days following higher training load, while rMSSD (HRV) is consistently decreased.
We also handle the less intuitive case of HRV being "too high", but as this is a rare situation I will not cover it in this post. Analyzing acute changes due to training can help you not-overdoing it, and understanding when to take it easy for a day. Most of the time your HRV data will be within your normal range of values, something the app will start to understand better and better as you collect more data. However, when you are outside of this range, it's probably a good idea to listen to your body and adjust accordingly. Here is an example of how these data can be visualized in HRV4Training Coach:
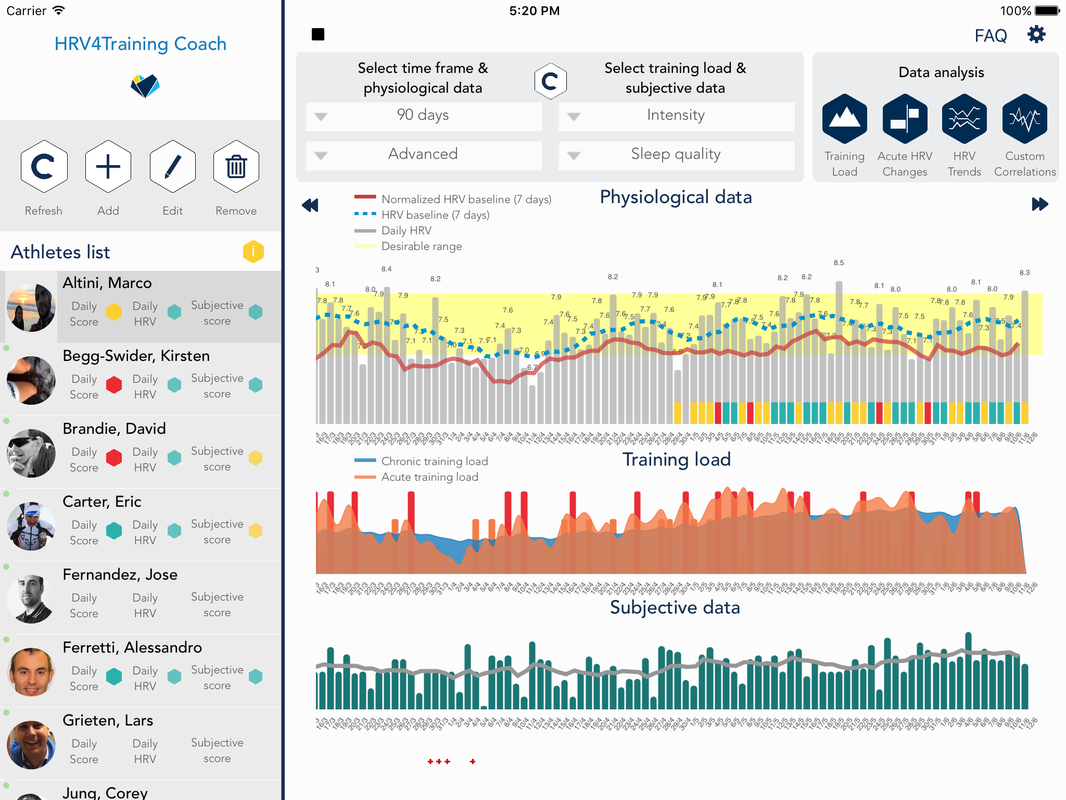
While I was mostly within my normal values (by definition), you can see a clear consistent drop in HRV during/post-injury, when it took some time to get back to normal. You can easily use these data to understand when your physiology is back to normal, and avoid overdoing it too early, which might be hard to quantify subjectively sometimes.
Being sick & alcohol intake
Other acute stressors that show up consistently are for example the effect of injuries/being sick or alcohol intake, as shown below:
On the left, increase in heart rate on a day in which I had one drink too many. On the right, crashed HRV and increased HR while getting and recovering from pleurisy/pneumonia.
Long term trends
We've seen that acute stressors can be analyzed systematically to understand how our physiology responds to such stressors, and therefore adjust accordingly. Another interesting aspect to analyze once we start having more data, are long term trends. When we look only at day to day changes, we fail to capture the big picture, hence the need to look at longer term trends.
Training
I mentioned briefly before that in recent literature a group of runners performed better when starting intense training blocks only under good physiological conditions, despite having actually trained less than the control group (see full story here). Good physiological conditions meant simply having their baseline HRV within their normal values or trending positively. A negative trend was a no go. You can look at these data in HRV4Training under Insights / Trend analysis, as shown below for my own data again:
Examples of analysis of long term trends (multi parameter, typically HRV, HR and coefficient of variation of HRV - meaning how much your HRV is jumping from day to day). Click to see the images.
Travel
Here is another interesting one from Massimiliano Milani, a marathon runner with a recent 2 hours and 30 minutes PR. Massimiliano travels a lot because of his job, which is definitely a source of stress, and here you can see how his rMSSD is much higher over a 30 day without travel (blue distribution) with respect to the previous 30 days including much traveling:
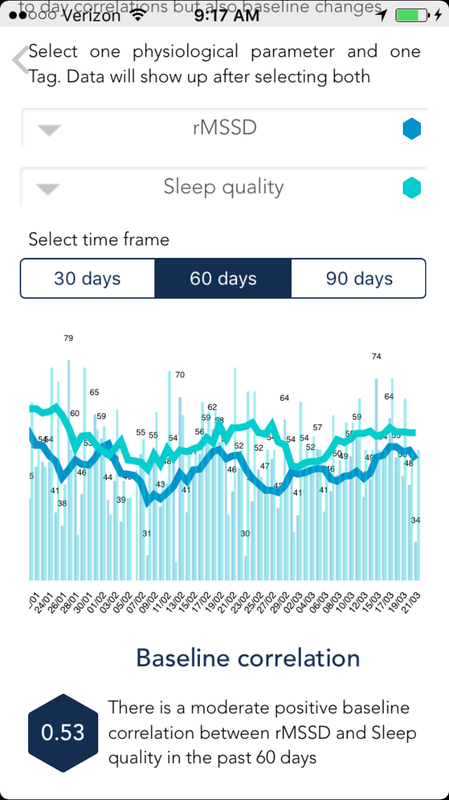
Sleep & other variables
Summary
In this post I've tried to show a few practical ways of how you can make use (and sense!) of physiological data, in particular HRV. By collecting data for a few weeks, and analyzing the effect of acute stressors as well as long term trends, you should be able to see the benefit of capturing your unique physiological responses to your training plan (& life!). I tried to include a few examples to make all of this more tangible, but the best way is probably to try it for yourself. You can find all that is discussed above directly in HRV4Training, from our Insights sections, including among other things: Acute HRV changes, HRV Trends & correlation analysis.
0 Comments
Your comment will be posted after it is approved.
Leave a Reply. |


Register to the mailing list
and try the HRV4Training app! 
|