|
Blog post by Marco Altini We have made some changes to the Heart Rate Variability Logger app on iPhone (http://hrv.tools) to make it easier to compare pre and post-exercise data. The goal of these measurements is to assess the impact of intensity (or other stressors, such as the heat for example). Measuring heart rate and HRV before and after a workout, we isolate the training stressor in a way that allows us to assess and compare autonomic control. I have discussed these aspects in greater detail in my blog here. This approach, is based on Stephen Seiler's research and could be a practical way to determine if training was executed according to prescription or if the intensity or the addition of other stressors, caused a greater autonomic disruption (and therefore a need for more recovery) 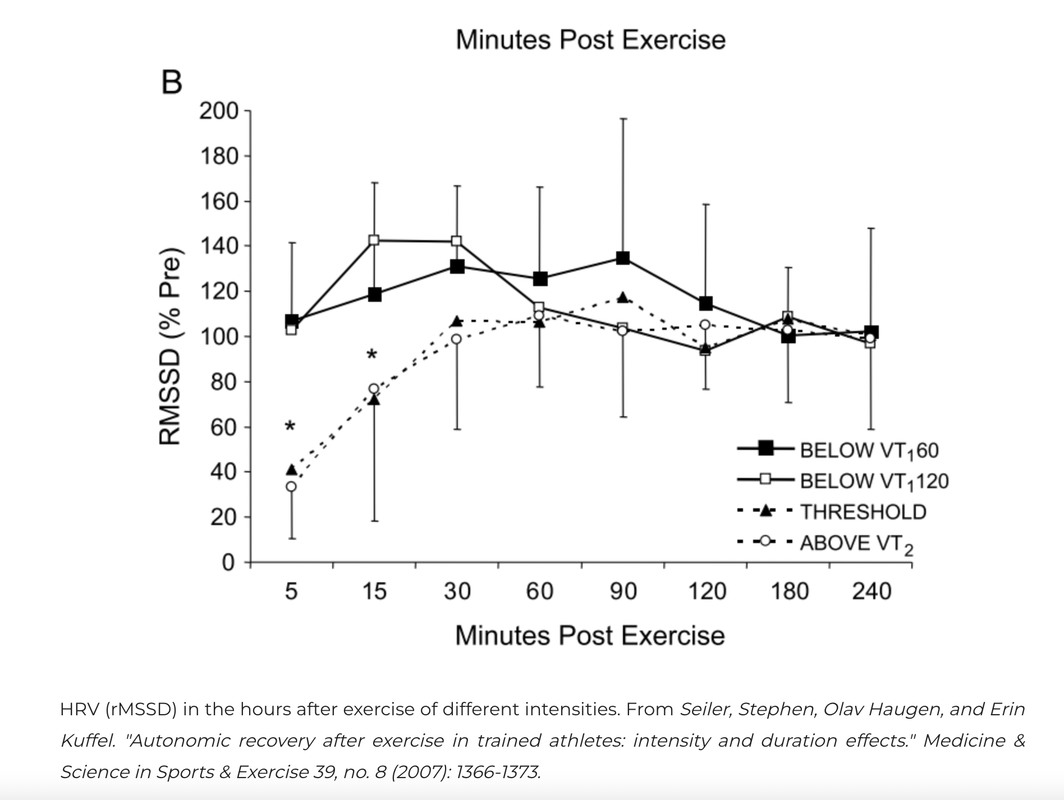 With the HRV Logger you can take measurements before and after exercise, and run the same comparisons shown below, directly in the app (the Compare tab is available only on iPhone). Make sure to configure the app as below:
I would like to add a note about artifacts here and how the Compare view allows you to filter them out even when the RR intervals timeseries is impacted. Post-exercise, these days I have many ectopic beats. You can see below that some of them remain even after artifact correction (the spikes in the second recording, right end side). 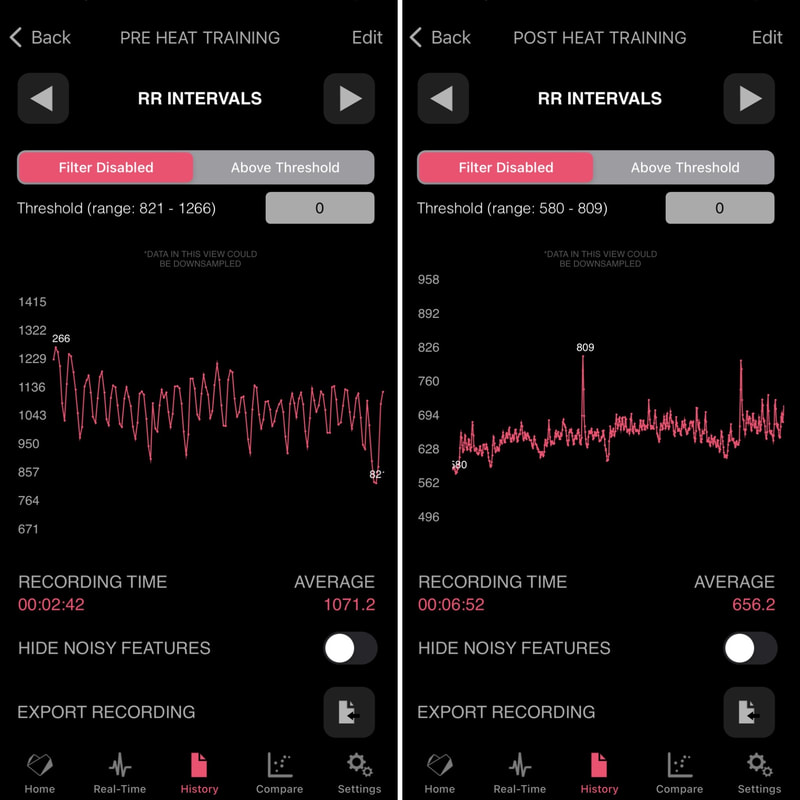 When we analyze the data, we can get rid of features that have been computed using the Outlier removal button, in the Compare tab. First, select the recordings to compare. Then, you will see histograms showing the distribution of the data, for the selected feature (typically I would look at heart rate and rMSSD). You can also see the averages (e.g. rMSSD = 68.1 pre-run and 10.8 post-run): 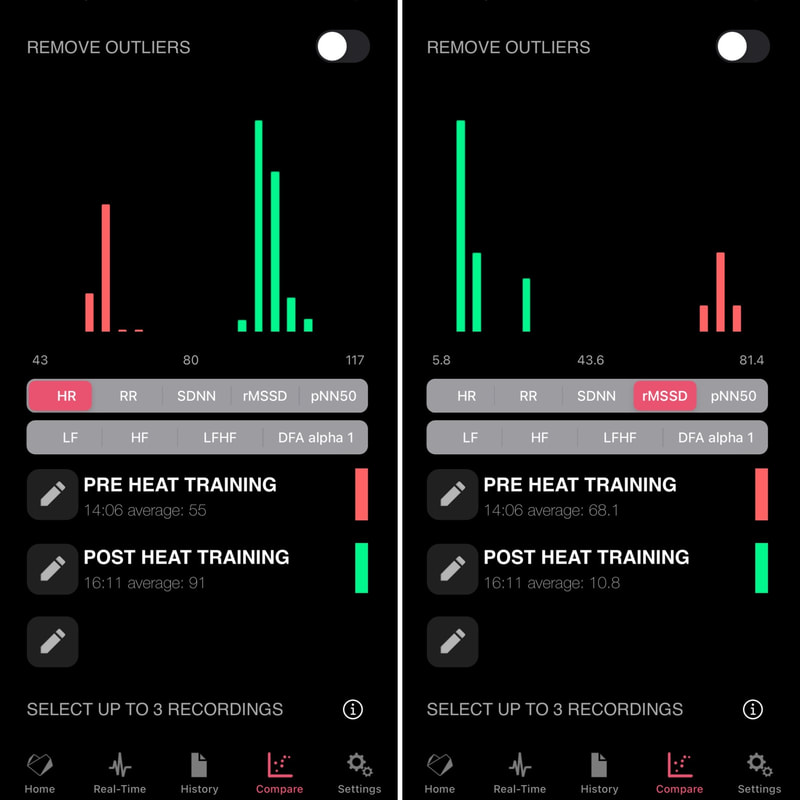 As mentioned earlier, there were some artifacts in the RR intervals, that might impact rMSSD. If you toggle the Outlier removal button, you will get a cleaner picture without the need to export and re-process the data. Here for example rMSSD post-exercise becomes 8 ms.
As per Stephen's research, easy training should show almost no change in rMSSD post-exercise with respect to pre-exercise. This can be a useful test to assess if your sessions are truly easy (below aerobic threshold). You want those bars to be really close or overlapping. Additionally, you can assess the impact of other stressors, such as the heat. Despite running very slowly and trying to keep intensity low when I recorded the data above, it is clear from the data change in autonomic activity that the heat for me is a large stressor, apparently as large (or larger) than high-intensity training. Enjoy. Comments are closed.
|


Register to the mailing list
and try the HRV4Training app! 
|