On the relation between training intensity & running performance in HRV4Training runners & triathletesBlog post by Marco Altini In this post we investigate the relation between training intensity and running performance in HRV4Training users. Quite some research in the past 15 years showed how elite runners (and not only runners) spend much of their time training at low intensities (see Seiler et al.). Following early research, interventions have been carried out to randomize runners in groups including a greater amount of low intensity training, and groups including more moderate intensity training. Results showed consistently improvements in running performance for groups training at lower intensities for most of the time, typically 80% of the overall training load. Many runners, coaches and authors have been preaching low intensity training for many years, under slightly different guidelines, but all following the same core principles (see for example heart monitor training by John Parker Jr, most of Phil Maffetone's work - the 180 formula, MAF test, etc. - and more recently 80/20 running by Matt Fitzgerald, who also wrote this nice piece on the topic on RunnersWorld). Many of the studies mentioned by Matt (see Seiler's work) start by observing what elite athletes were doing to try to capture underlying patterns (e.g. what's the optimal ratio of low and high intensity training). Following the same principle, we thought it would be interesting to look at similar relationships on our data as well. Similarly to our recent posts covering the relation between VO2max and running performance as well as HR, HRV at rest and running performance, we can use actual workouts data to analyze training intensity and how it relates to performance on our userbase. Do faster HRV4Training runners & triathletes train at lower intensities? DatasetThis analysis - as many other analysis we did in the past - requires some thinking and data cleaning, given the uncontrolled free living settings. Especially considering that this time we rely heavily on workouts data imported using the Strava link, we have some additional issues, for example getting correct pace information, as well as heart rate and maximal heart rate data while dealing with: missing data, noisy data, different elevation gains, our wrist watch not getting good heart rate data, our chest strap battery being down, Strava re-interpolating running distance from Garmin workouts, maximal heart rate being often off given noisy readings, etc. We'll show later how we dealt with some of these issues. In general, we can never guarantee the data quality that we normally have in a clinical study, however, sample size will help us. We have at our disposal between 10 and 100 times more data than regular clinical studies, and I believe we can read through the noise when we have much domain knowledge and know limitations of how the data has been acquired and how we can deal with some of the issues listed above. Having hundreds of trainings per person, will help us in identifying the relevant information. Additionally, what we aim at here is not to determine optimal workout patterns (for example the exact amount of low intensity training you should do), but to capture trends across different groups of individuals (do faster runners train more at low intensities?). Inclusion criteriaWe started with some basic cleaning to get to a trustworthy sample of users data. First, I included only entries related to running trainings acquired via Strava (this is not necessarily data acquired via the app, as most users use Garmin watches that automatically upload data to Strava - me included). Then I excluded all non-human speeds or anything above 6.5 m/s. Then I removed all entries not including heart rate data, as it is necessary to determine training intensity, and also removed all abnormal maximal heart rates (I'll show below how bad these data normally are). Interestingly, more than 82% of the activities collected from Strava included heart rate data (which is probably not a surprise on our dataset). Then we computed user-specific summaries, such as average heart rate during all trainings, maximal heart rate based on recorded data (more on this later), etc - for this procedure, I included only users with at least 15 trainings collected from Strava, which typically means a period between 2 and 4 weeks of minimum app usage. Anything less was discarded. Finally, for each user we grouped trainings around 10Km, 21Km and 42Km, determined the fastest times per person (removing again crazy outliers) and therefore obtained our user performance data. To sum up, the main inclusion criteria were the following:
After this procedure, we ended up with about 400 users (389 total, 256 runners & 130 triathletes) Below you can see age, BMI & gender, as well as main sport for the users included in this analysis. 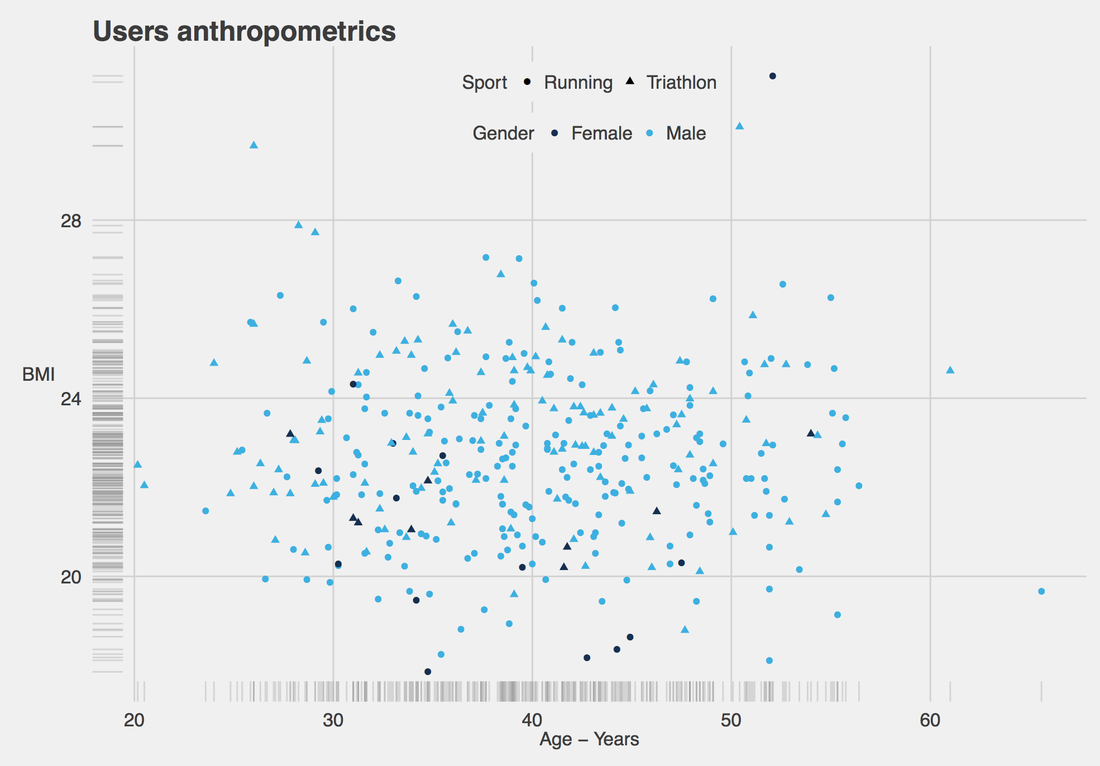 We can see that the average age is about 40 years old (more or less normally distributed between 20 and 60 years old), and average BMI around 22 kg/m^2. Running performanceThe best (fastest) activities per user were selected as the user best performance over the three distances selected for this analysis, so 10km, half and full marathons. We also split runners in three categories depending on their best times, for example, fast runners are defined as runners that can run a 10Km below 40 minutes or a half marathon below 1 hour and 30 minutes or a full marathon below 3 hours. Average runners get to 47 minute and 30 seconds for a 10Km and 1 hour and 45 for a half marathon and sub 4 hours for a marathon, while slow runners are the remaining ones. Longer distances were given priority, so if your 10 km run is above 40 minutes but your half marathon time is below 1 hour and 30 minutes, you are still considered a fast runner, mainly because you simply might not have raced a shorter distance over this period of time. Let's have a look at the times and categories for 10km, half and full marathons (click the figure to enlarge, as usual): 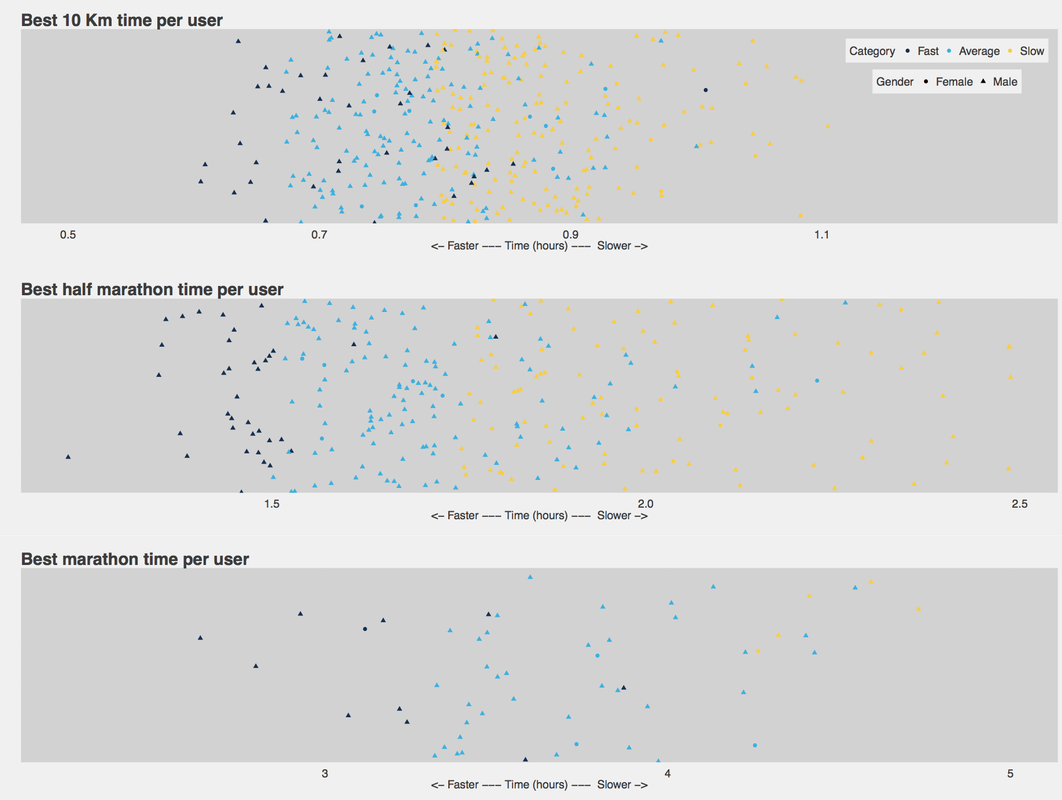 We have the fastest 10Km in 36 minutes (average 10Km in 49 minutes), fastest half marathon in 1 hour and 13 minutes (average 21Km in 1 hour and 46) and fastest full marathon in 2 hours and 38 minutes (average marathon time of 3 hours and 43 minutes), for a total of 44 fast runners, 163 average runners and 178 slow runners. Times provide quite a broad range on which we can analyze our data. Determining training intensityTraining intensity can be determined in different ways. In literature, researchers used mainly two methods: pace and heart rate. When we look at heart rate, we analyze our training heart rate with respect to our maximal heart rate, to determine how hard we are training. Intuitively, training close to our maximal heart rate means going at high intensity, while rates between 70 and 80% of our maximal are typically considered low intensities. Similarly for pace, we can analyze our training pace with respect to our maximal pace (see later for details), and determine how intense we are training. Both of these methods have their own limitations, and especially in unconstrained free-living settings there are quite a few challenges, for example; how do we determine maximal heart rate? how do we determine maximal pace? can we trust the data? We show below how we dealt with some of these issues. Then, we will combine both metrics to highlight possible patterns between performance categories (fast to slow users). Maximal heart rate and training intensityThe main challenge we have here is to determine a user maximal heart rate. Using age-predicted values is no option, as error at the individual level can easily reach 20 beats per minute, hence making our other computations fundamentally incorrect (see later for some examples). The best way to determine maximal heart rate is to measure it during an intense workout. As we have filtered out all users that did not compete in any race between the 10Km and the full marathon, and we are looking at data longitudinally for months (or at least 2-4 weeks as a minimum amount of data per person), the odds that some high intensity trainings (intervals or other) are included in each user dataset are quite high. Hence, we will try to extract maximal heart rate directly from trainings data. Strava does part of the job for us, as each training summary includes information on maximal heart rate for that specific training, however, as we can see from the data below, these data is extremely noisy: 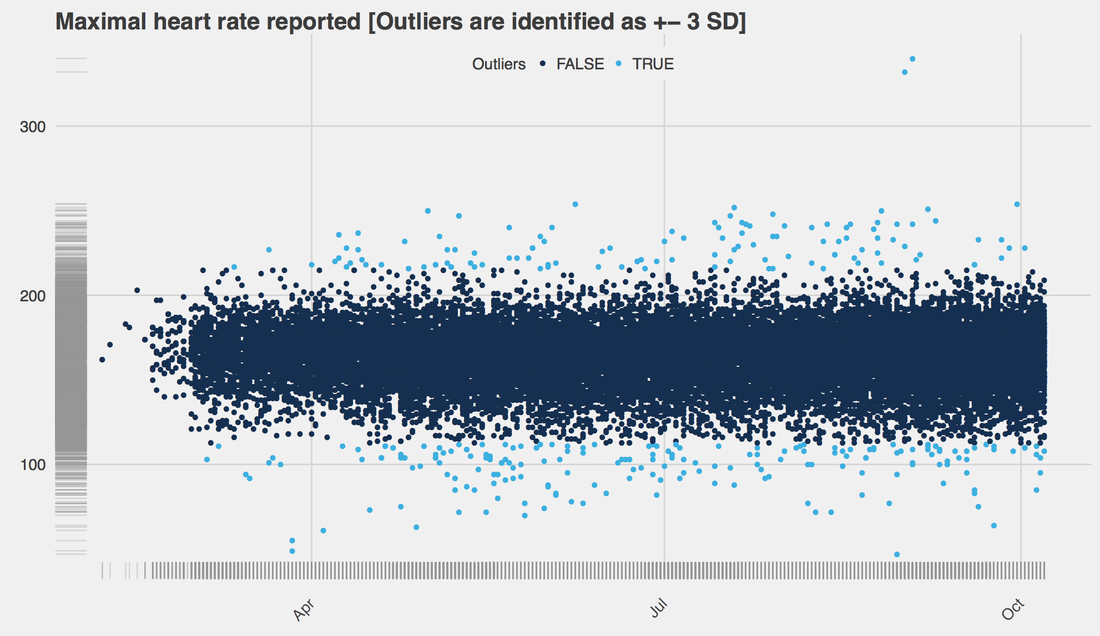 As we can see there are even values above 300 beats per minute. Here we cleaned the data by excluding all values that are further than 3 standard deviations from the mean (meaning that we include 99.7% of the data, and remove the rest, our outliers). All dark blue dots above are the ones we kept. Below is the same data for one individual, again there are clear outliers (some maximal heart rates below 100 bpm and above 300 bpm, probably the sensor malfunctioning), but the procedure just described seems to get rid of them quite well: 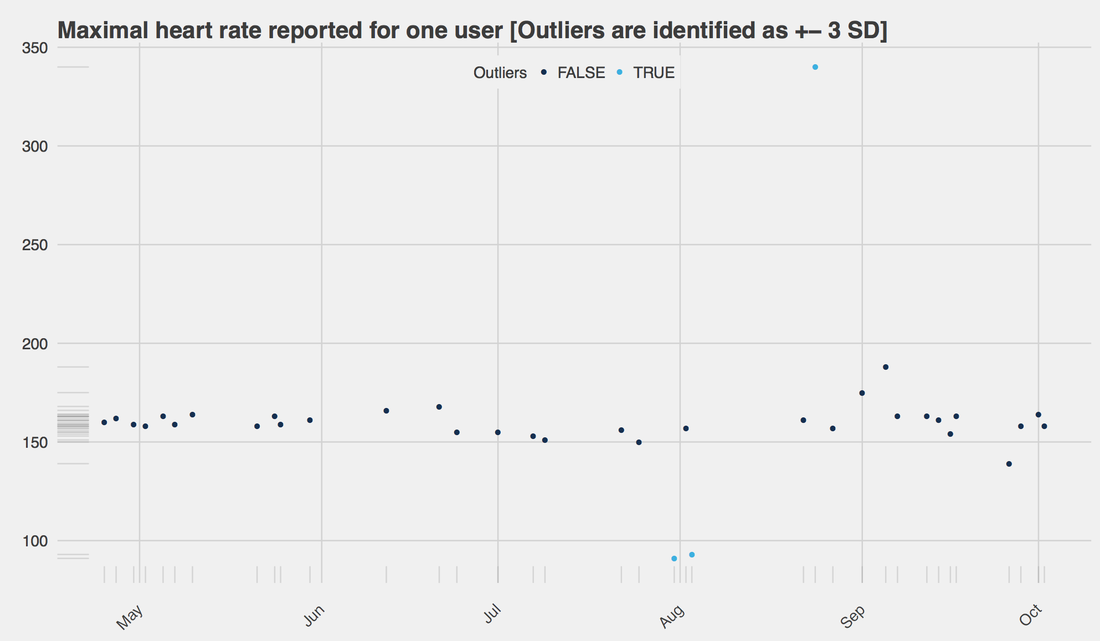 Removing big outliers using data pooled from all users was the first step. However, it is still not sufficient to get reliable maximal heart rate data. For example, a user with a maximal heart rate of 170 bpm, could occasionally get a wrong reading still within the acceptable range over the entire population, for example 210 bpm. We need to do more data cleaning at the individual level. To do so, I've used a similar technique to the one described above. First, I clustered data by user, then for each user we removed maximal heart rates above the 99th percentile. This choice assumes that over many weeks of recordings, very rarely we get a wrong reading, and in that case we discard them correctly. Let's look at one example: 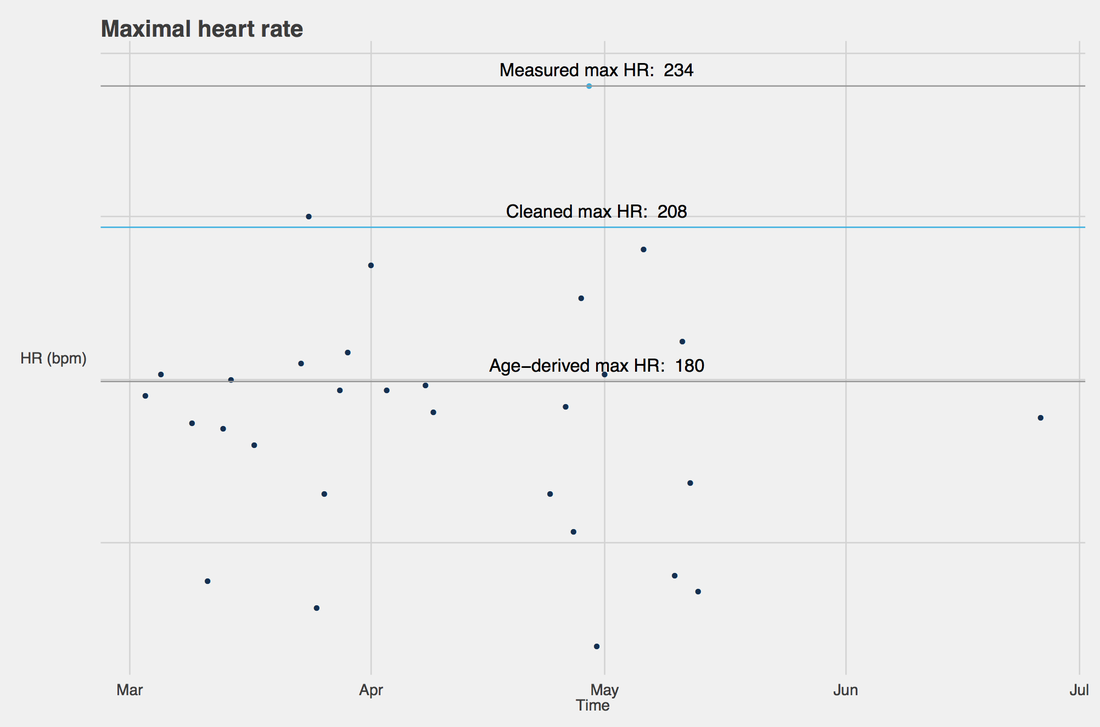 In the plot above we can see 1) age-derived max HR, clearly lower than this user maximal HR, as many times we are above the threshold 2) measured maximal HR, most likely an outlier as 234 bpm seems extremely high 3) our cleaned max HR, which takes into account all data and removes outliers based on the procedures described above. This is the maximal heart rate we will use to determine training intensity. Once the maximal heart rate has been determined, we compute training intensity as the averaged normalized heart rate over all trainings for each user, meaning that we take our average training heart rate, divide it by our max HR, and get a number between 0 and 1, where 1 means always training at our maximal, and anything lower means training at a lower intensity. Pace and training intensityHow do we determine training intensity using pace? Similarly to the heart rate case described above, we can normalized average training pace by maximal pace. However, how do we compute maximal pace? We could use again workouts summaries as average and maximal pace are both reported for each workout. However, as we use as a proxy to running performance a user's 10km to full marathon time, we could also use a user PR over these distances as a proxy to maximal pace. In this way we get a more standardized metric, as looking at half marathon pace will be better than just looking at pace without taking into account distance (as obviously you can keep a faster pace over the shorter distance). How hard do you train?At this point we determined 1) running performance, clustering users into three groups: fast, average and slow runners, for both runners and triathletes 2) training intensity based on maximal heart rate and average heart rate during training 3) training intensity based on PR pace and average pace during training. Time to look at the relation between all these parameters. Relation between heart rate based training intensity and running performanceBelow we can see the relation between normalized HR and running performance over the entire userbase selected for this analysis. Quite clearly, faster runners train at lower intensities: 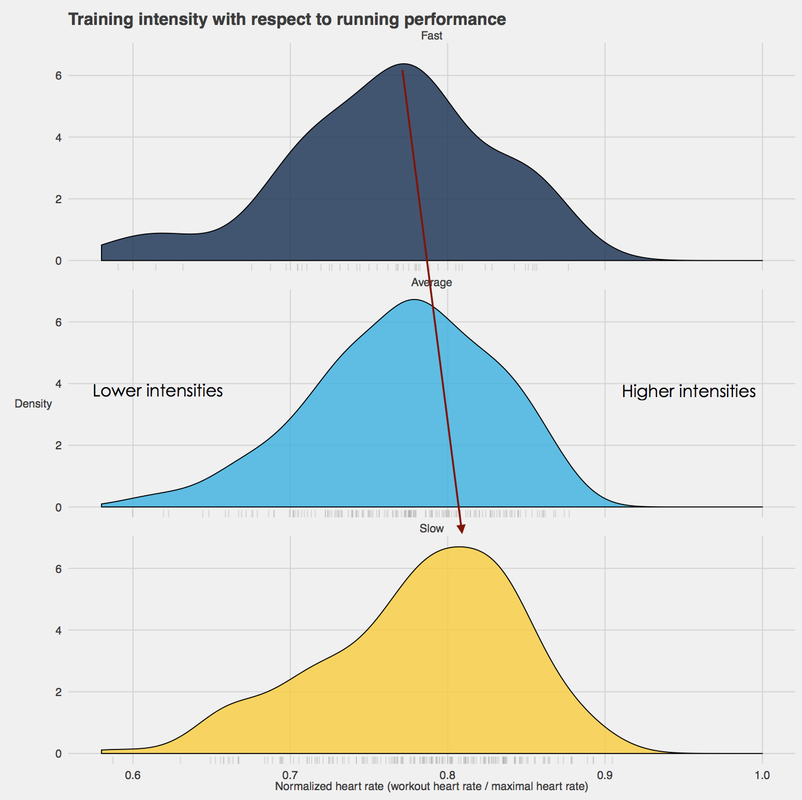 As we have a good sample of 400 users, we can also break down this analysis by sport. Below we can see on the left end side the relation between normalized HR and running performance for Runners, while on the right end side the same relation for Triathletes. We can see consistent patterns; faster users are training at lower normalized heart rates, i.e. at lower intensities: 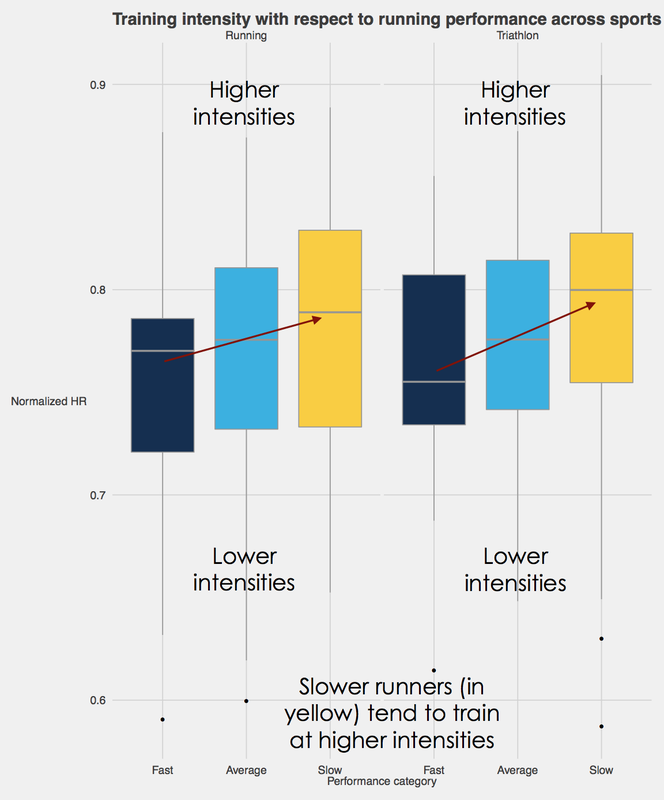 Relation between pace based training intensity and running performanceSimilarly, we can see how faster users tend to train at a much slower pace with respect to their PR pace, while slower users tend to train at faster relative pace (e.g. they might be stuck in "moderate intensity trainings"): 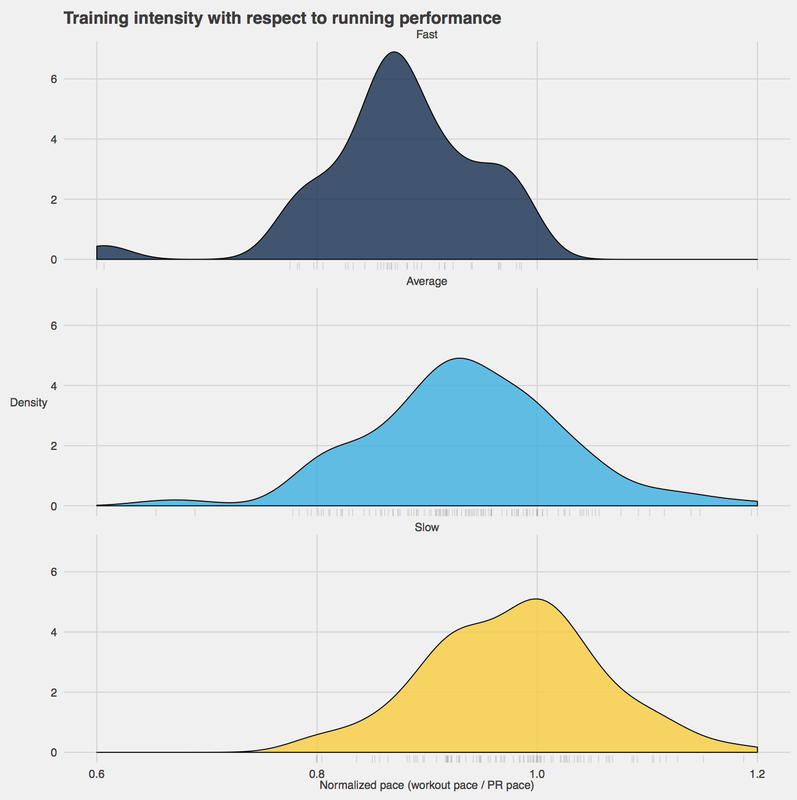 And again our breakdown by sport, for Runners and Triathletes: 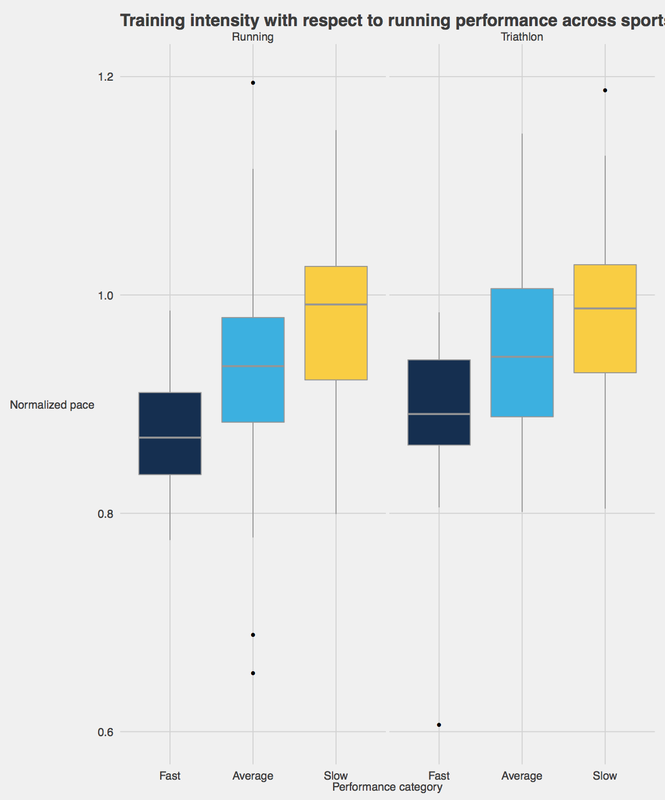 We see consistent patterns across sports for pace as well, with slower users training at faster relative pace. The relation seems more marked for pace with respect to heart rate, probably due to the additional challenges of dealing with heart rate data, which is often inaccurate. Putting it all togetherFinally, we can combine the information above to analyze the relation between running performance and training intensity as determined by both normalized heart rate and pace. To do so, I plotted the data using two-dimensional density plots. What we expect to see given the relations above, is the center of the distribution (the place where most of the data are for a given category) to be closer to the bottom left corner for faster users, as the bottom left corner is the low intensity spot: 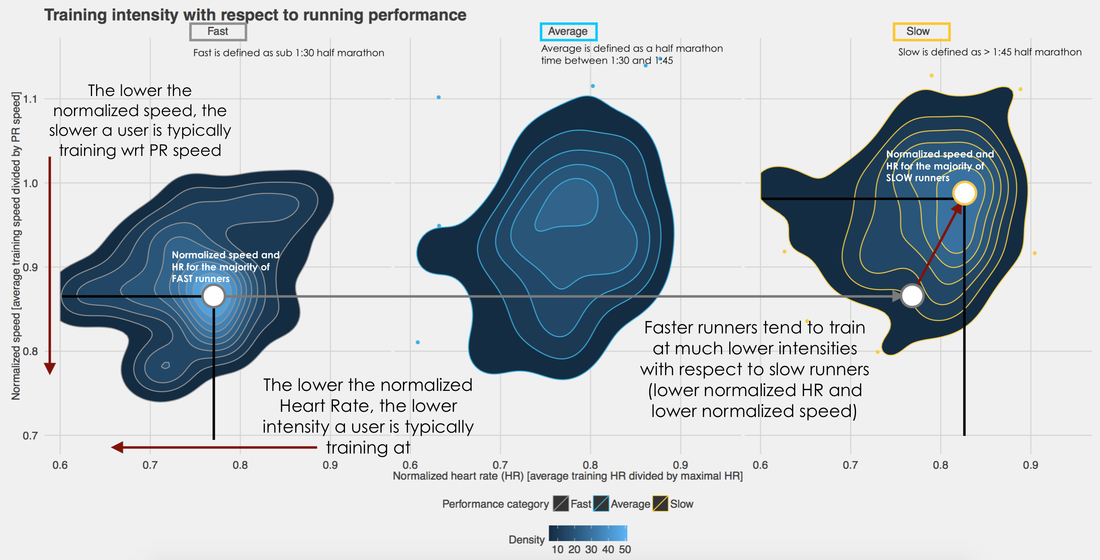 Now again the same relation but for different sports: 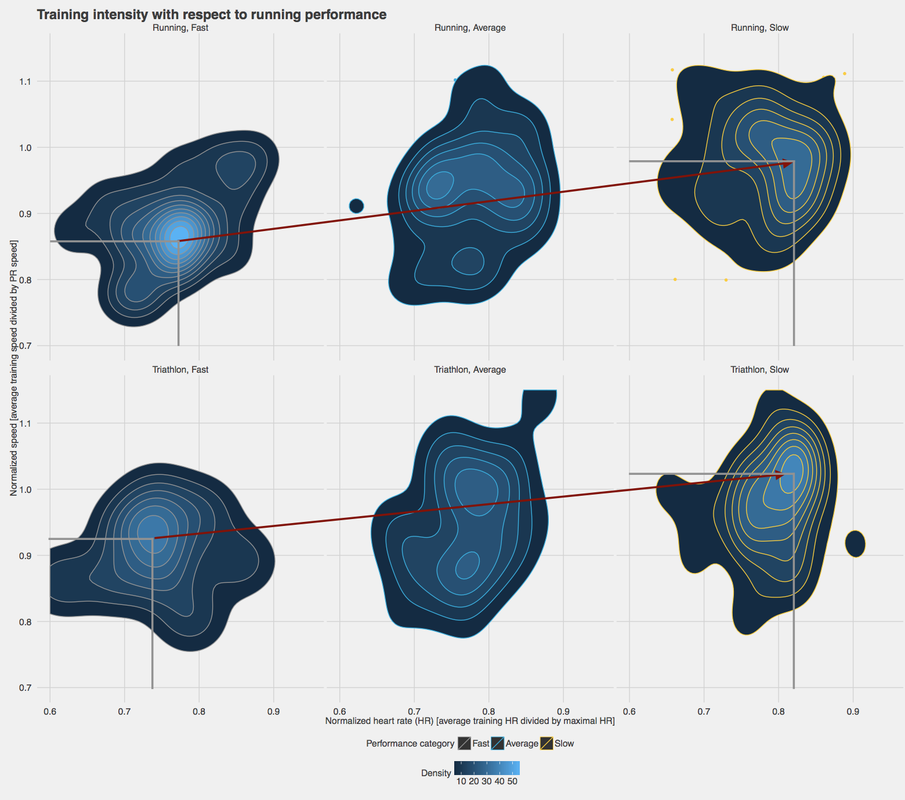 From the plot above we can see quite clearly how the center of the distribution shifts more towards the right (higher intensity training based on heart rate) as well as towards the top (higher intensity training based on pace) as we move from fast to slower users, for both Runners and Triathletes. ConsiderationsIn this post we investigated the relation between training intensity and running performance in HRV4Training users. Quite some research in the past 15 years showed how elite runners (and not only runners) spend much of their time training at low intensities (see Seiler et al.). We highlighted the same relations on our userbase, for both runners and triathletes (about 400 users in total). Faster runners consistently train at lower relative heart rate and pace with respect to slower runners, according to the data analyzed above.
This is an observational study which does not allow us to derive causal links between training patterns and performance - for example even if faster runners train slower most of the time, without a proper intervention we cannot claim that training at lower intensities is what makes them faster - however as this is real life data acquired in unsupervised conditions, we hope it can provide additional insights on the relation between training intensity and performance. As we gather more data, we will be looking at capturing changes in training patterns and performance for different individuals over time (longitudinally), and trying to determine if changes in training patterns, such as more low intensity training, can get you faster.
5 Comments
Geoff Hutchison
1/10/2017 08:41:28 pm
Any chance of the 2D density plot being added as an analysis option in HRV4Training? I'd be really curious to look at my personal data in this way...
Marco
1/10/2017 08:55:52 pm
hi Geoff, we are thinking to add a feature related to periodization or 80/20 running (or even in general for all aerobic sports), however the analysis might be more similar to what we have in the medium post (https://medium.com/@marco_alt/training-mostly-slow-to-race-kind-of-fast-e604b2f0a910) so mainly in terms of heart rate data, possibly with configurable thresholds. Work in progress :)
Alex
2/9/2017 05:02:07 am
Really interesting. I guess one reason for difference is muscle faitigue. Slower runners will likely be running less often as a rule and likely shorter distance. Faster runners will therefore have to limit intensity more deliberately and will also likely slow more (relative to their norm) as muscles are worked harder and more frequently. Like you say, you can't pinpoint causation, but some great pointers here, clear correlations and absolute reassurance that you don't have to train like a nutter every day.
Melker
3/2/2017 01:17:33 am
Nice post. Food for thought!
Marco
3/2/2017 08:03:30 am
Thanks! I use R indeed, ggplot is the library. Your comment will be posted after it is approved.
Leave a Reply. |


Register to the mailing list
and try the HRV4Training app! 
|