|
Blog post by Marco Altini.
In this post I will look at the data more from a user perspective, showing how the iPhone camera data processed by HRV4Training is as good as what you get using a chest strap. In particular, I'll cover the following:
Data acquisition
I acquired the data used in this post with a "special app" I made. The app is basically a combination of the Camera HRV and HRV Logger apps, and lets me connect to a Bluetooth SMART sensor and simultaneously collect and process PPG data using the iPhone's camera. The complete PPG raw data is also stored by the app. I used a Polar H7 as reference, since it's the most reliable heart rate monitor I've found so far.
I will first show RR intervals for the three conditions I'm comparing (rest, paced breathing and recovery post-exercise) and then look at HR and time and frequency domain HRV features computed on 60 seconds windows. A note on data collection and synchronization: The two systems (H7 and camera) recorded data simultaneously, however data is not really timestamped. For example when I get data from the H7, RR intervals are appended to the HR sample every second, however RR intervals are not timestamped and I need to reconstruct the absolute time by summing up RR intervals. In case an interval is not detected or there is noise, the absolute timestamps won't be correct and could get out of synch. This issue explains some of the delays seen between the two data streams. When computing features, these delays are a minor problem, since we compute features using bigger windows (e.g. 60 seconds), and therefore attenuate differences due to the fact that a couple of RR intervals might end up in different windows. RR intervals - comparisonRR intervals comparison - condition 1: rest
Here are three minutes of RR intervals recorded at rest (sitting):
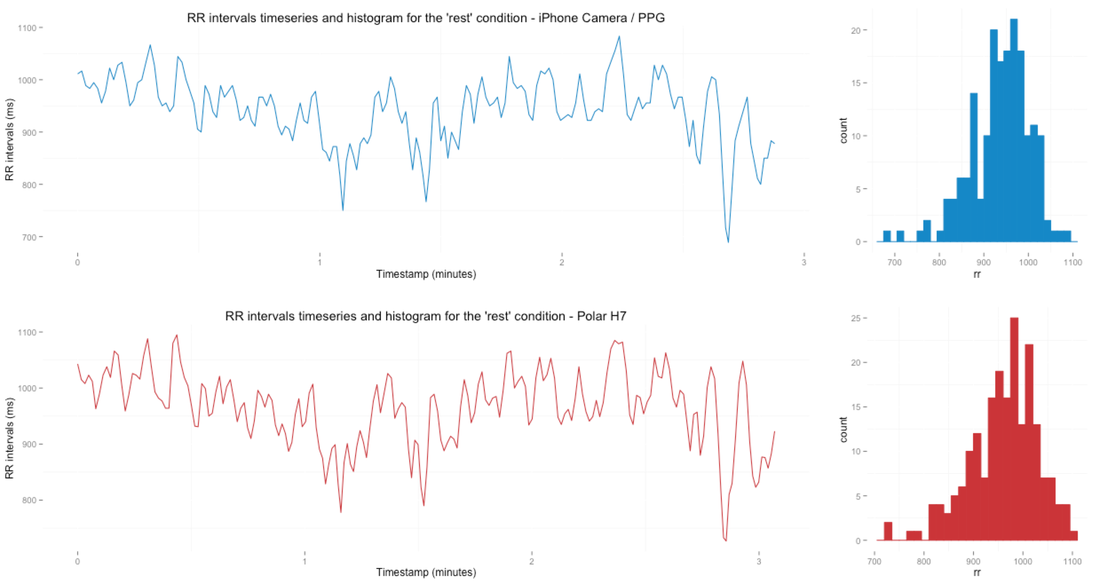
The time series and histograms look very similar, pointing out already that PPG data can provide high accuracy in beat to beat measurements. Let's have a look at the other two conditions, paced breathing - showing big swings in heart rate due to respiratory sinus arrhythmia - and recovery - showing lower values and variability - due to lower parasympathetic activity.
RR intervals comparison - condition 2: paced breathing
Here are 90 seconds of paced breathing data, as we can see it's deep breaths, about 6 per minute:
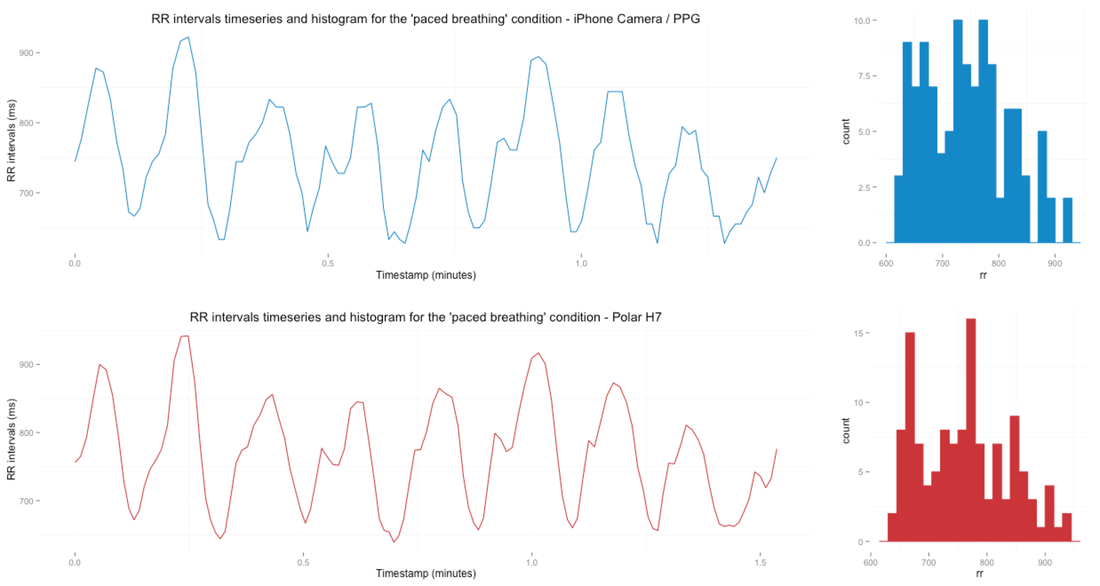
Again the PPG time series looks pretty good, following closely the pattern we see for the Polar H7.
RR intervals comparison - condition 3: recovery
Here we have about 2 minutes of RR intervals following a 20 minutes bike ride:
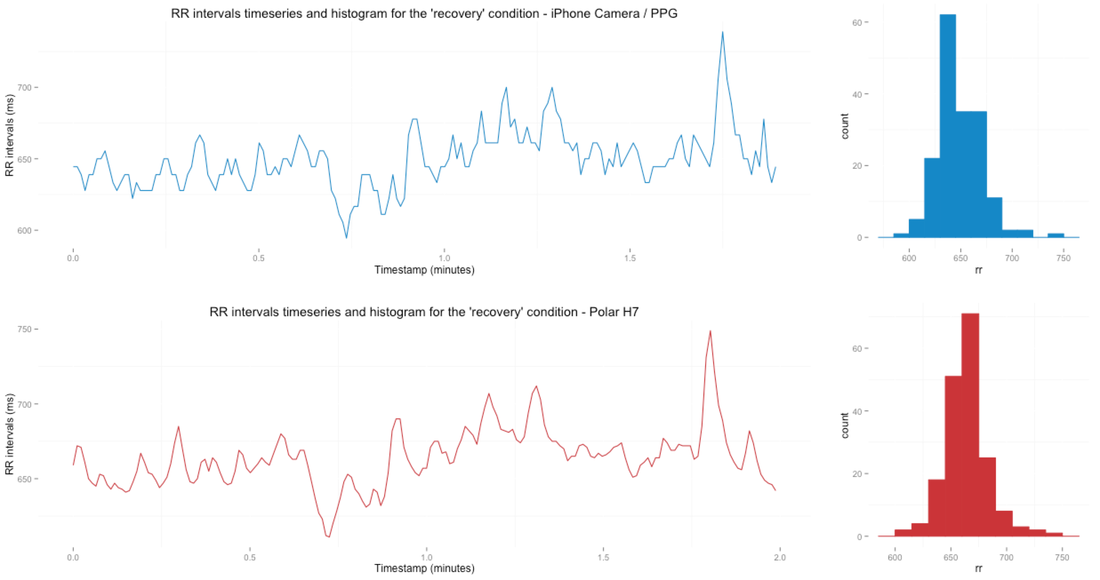
RR intervals are much shorter than in the other two plots (i.e. higher HR), and variability is also reduced (see histogram).
Heart rate
RR intervals seem promising, the time series look very similar. Let's now have a look at HR and HRV features to see if we can extract the same information for both the iPhone's camera and Polar H7. As I discussed in other posts, we are mainly interested in measuring rMSSD and HF, as they are good indicators of parasympathetic activity. Another interesting marker is LF, if we are interested in for example monitoring paced breathing/meditation. In this context we can do breathing exercises (i.e. deep breaths), at relatively low frequencies, that we can capture by analyzing LF. For example, breathing at 6 breaths per minute should result in a peak around 0.1 Hz, which is reflected in the LF feature since LF represent the frequency power in the 0.04 - 0.15 Hz band. Let's start the analysis by looking at HR.
Average HR should be easy to measure using optical methods. IPhone apps detecting HR have been out forever and wrist based sensors showing poor performance for HRV can still measure HR pretty accurately. Our comparison shows what we expect, HR computed using the camera matches very closely what we get with the Polar H7, for all three conditions: Heart rate comparison - condition 1: rest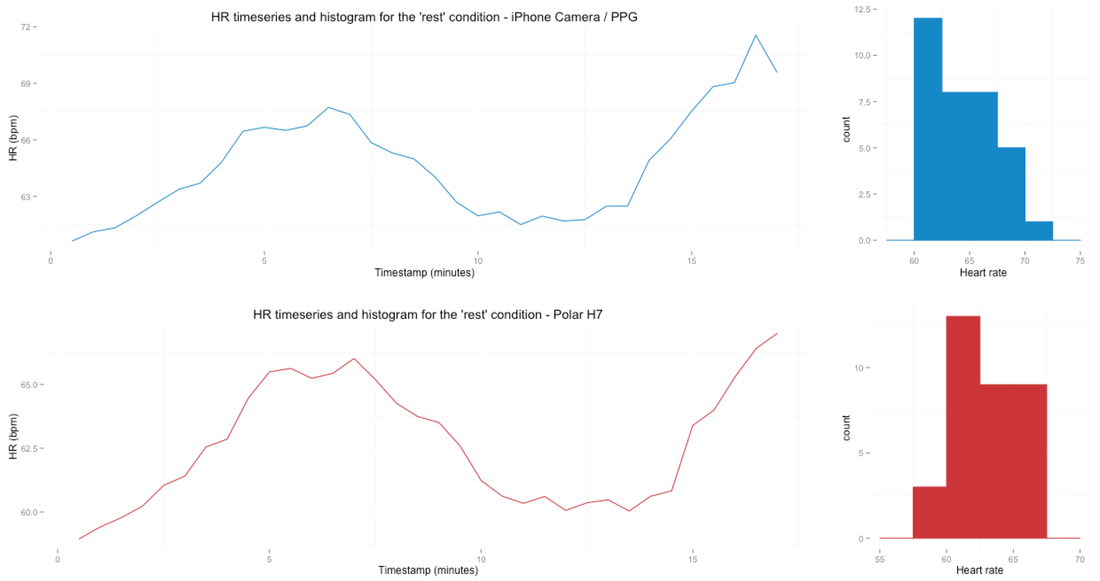
Heart rate comparison - condition 2: paced breathing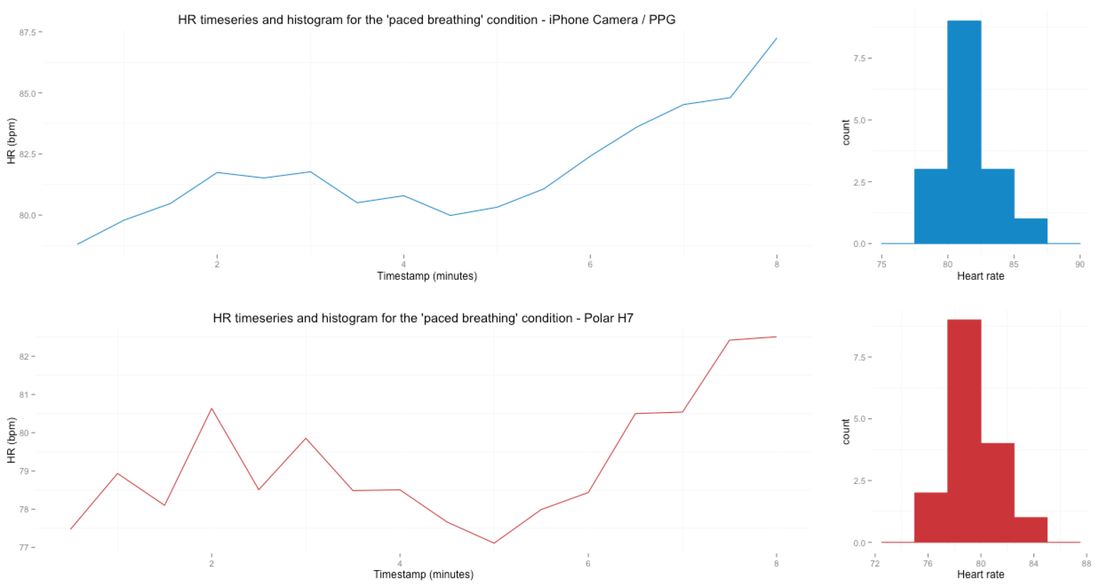
Heart rate comparison - condition 3: recovery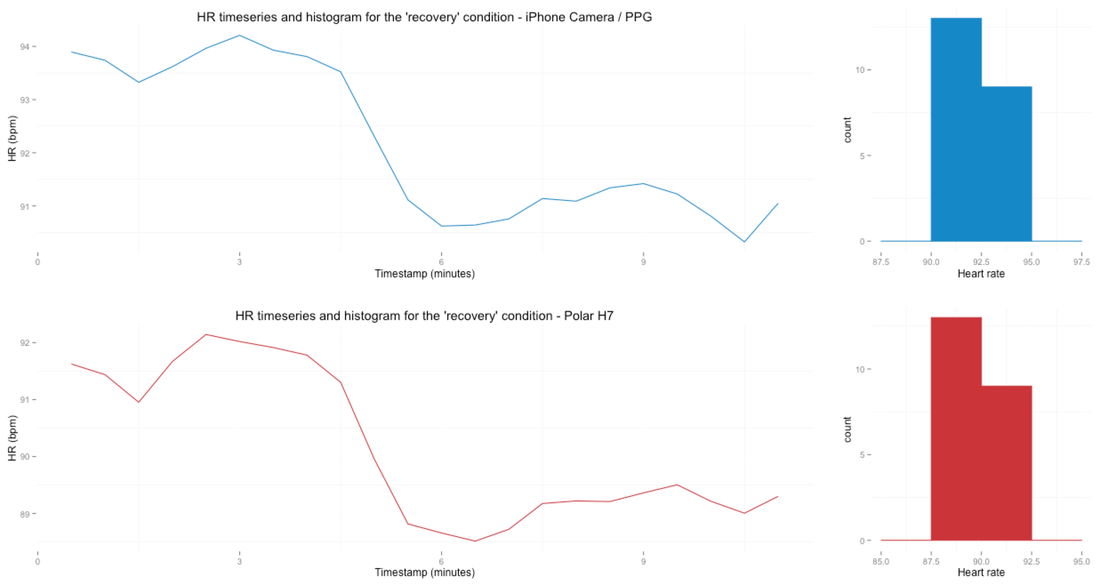
All HR plots were computed using features collected over 30 seconds and a sliding window of 5 seconds, so over a rather short timeframe. Next, we'll finally look into HRV features.
Heart rate variability features
The following plots show HRV features computed over 60 seconds windows. I plotted features derived using the iPhone camera side by side with features extracted using RR intervals collected with the Polar H7. The data is the same that was used for the plots above. I computed both time and frequency domain features according to the formulas I introduced in a previous post. The sliding window here is 15 seconds, and as usual we look at all three condition separately (rest, paced breathing and recovery).
HRV features comparison - condition 1: rest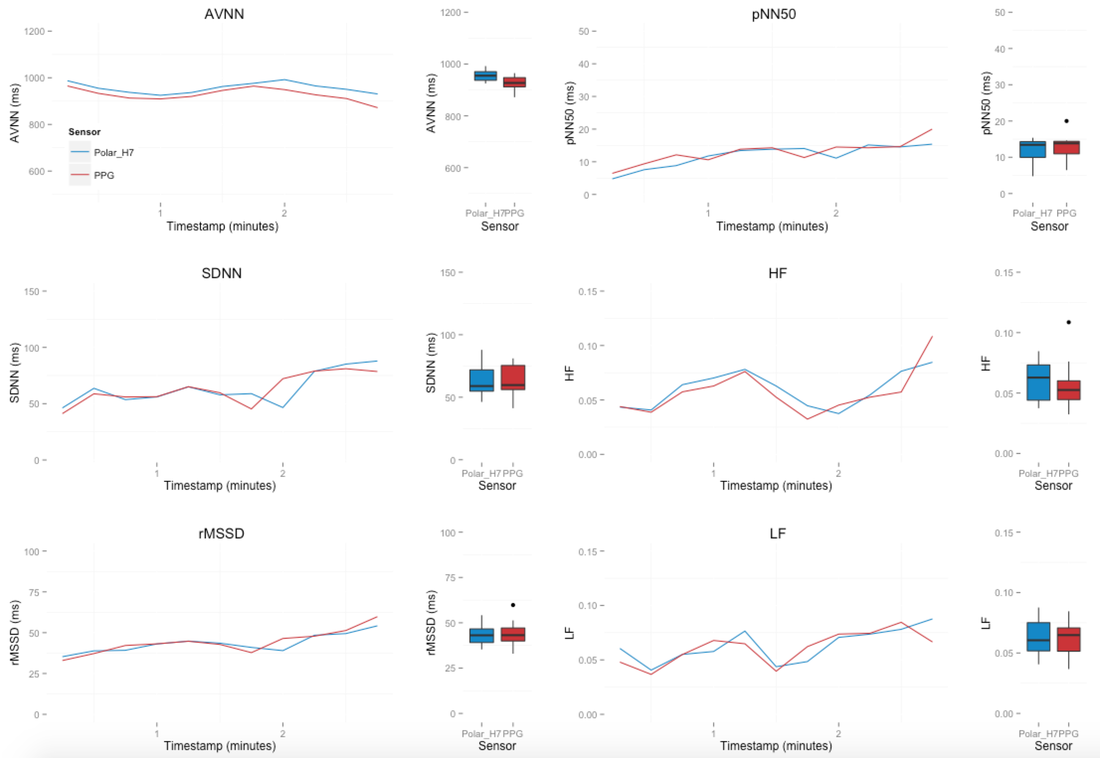
HRV features comparison - condition 2: paced breathing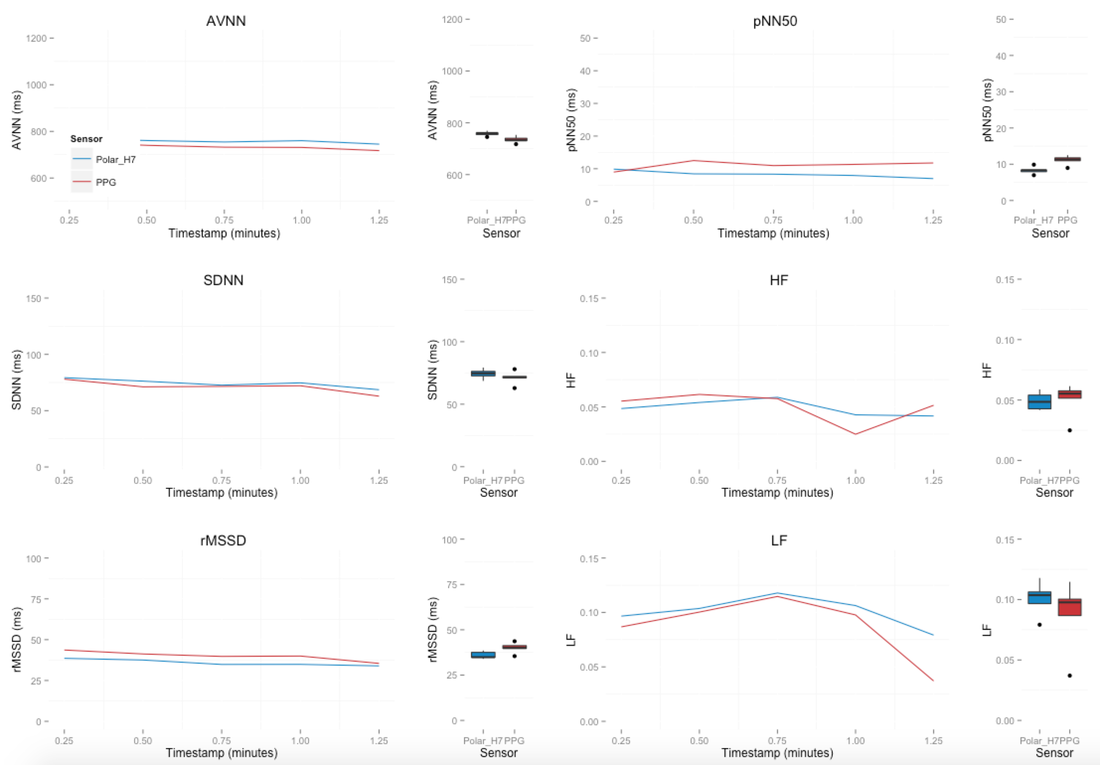
At this point we can start looking at a few interesting aspects. For example, as I introduced before, paced breathing at low frequency rates (e.g. 6 breaths/minute), are reflected in higher frequency power for the LF feature, which includes the 0.1Hz peak resulting from breathing at 6 breaths per minute (LF is defined as 0.04 to 0.15Hz). I'll show comparisons between conditions later on, but you can scroll up and see easily how the LF values are much higher in the paced breathing condition. Also, both conditions are actually recordings taken at rest, which might explain similar values in rMSSD and HF. The situation gets quite different for the recovery recording, shown next.
HRV features comparison - condition 3: Recovery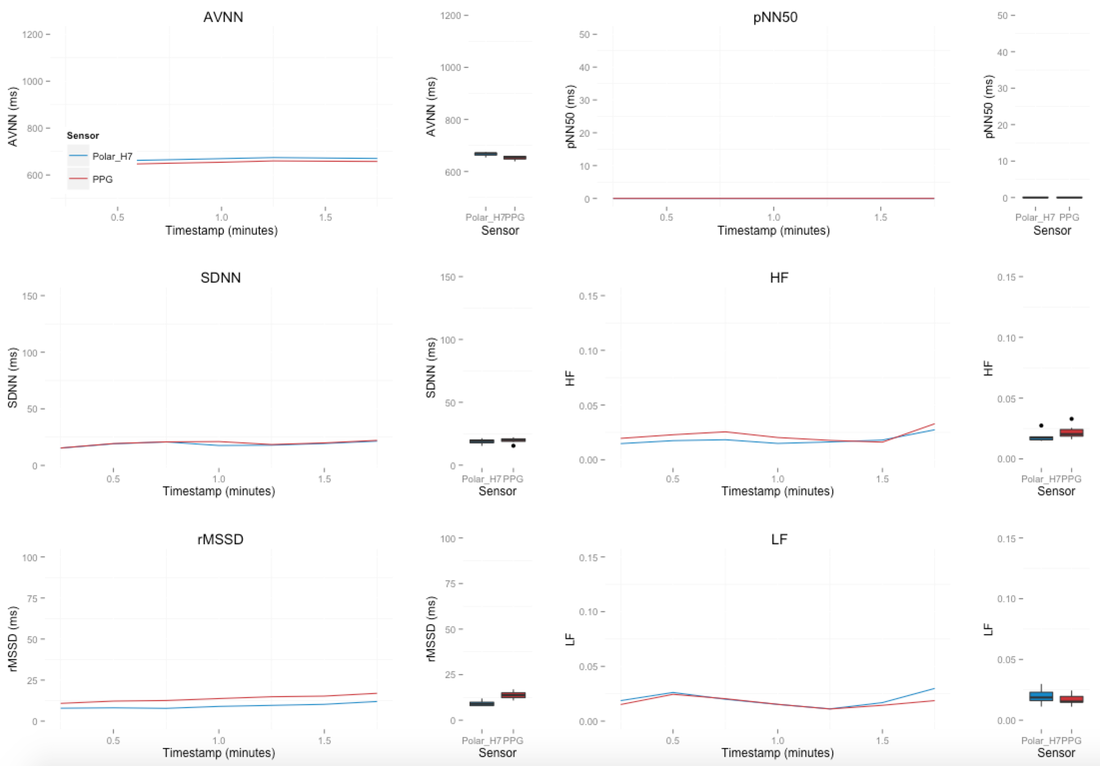
As expected, for the recovery conditions HRV is highly reduced, with pNN50 going down to zero (i.e. no consecutive RR intervals differ for more than 50 ms), and rMMSD, LF and HF also being much lower. Both the PPG from the iPhone camera and the Polar H7 show the same behavior across time and frequency domain features.
Now let's finally look at a comparison between conditions: 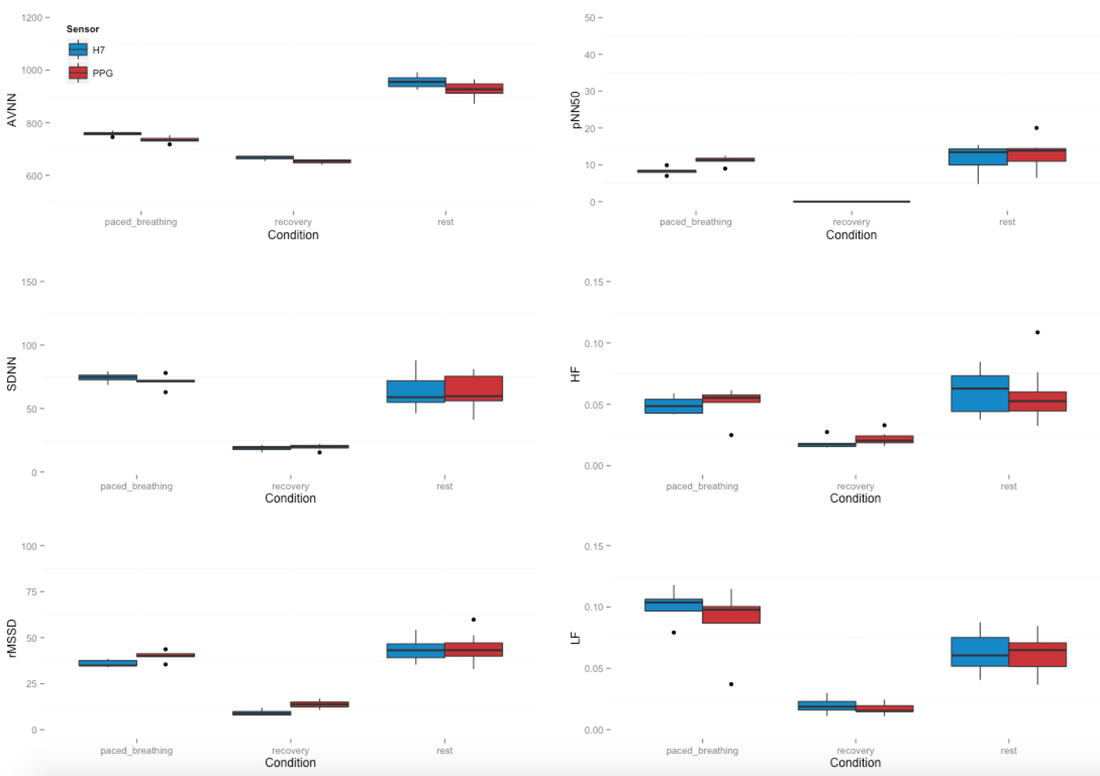
Just looking at the data, we can see that PPG data can discriminate between different conditions as good as the Polar H7 can, for both time and frequency domain features.
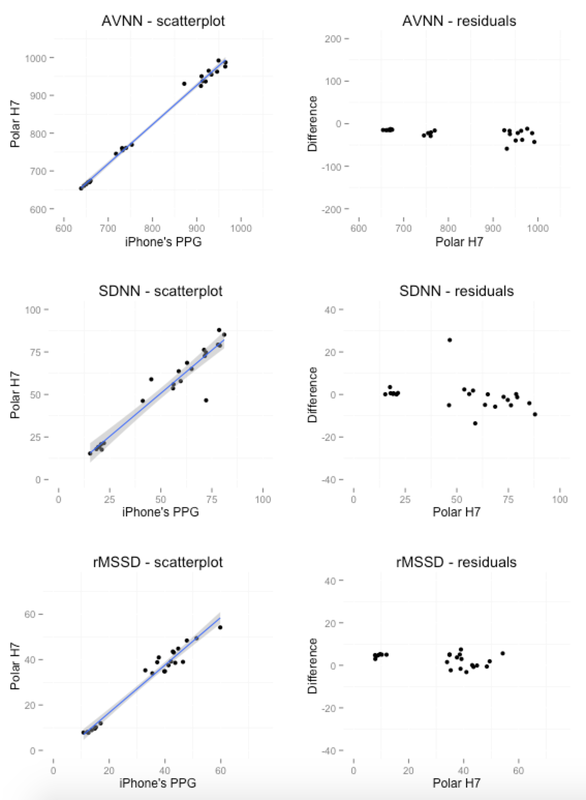
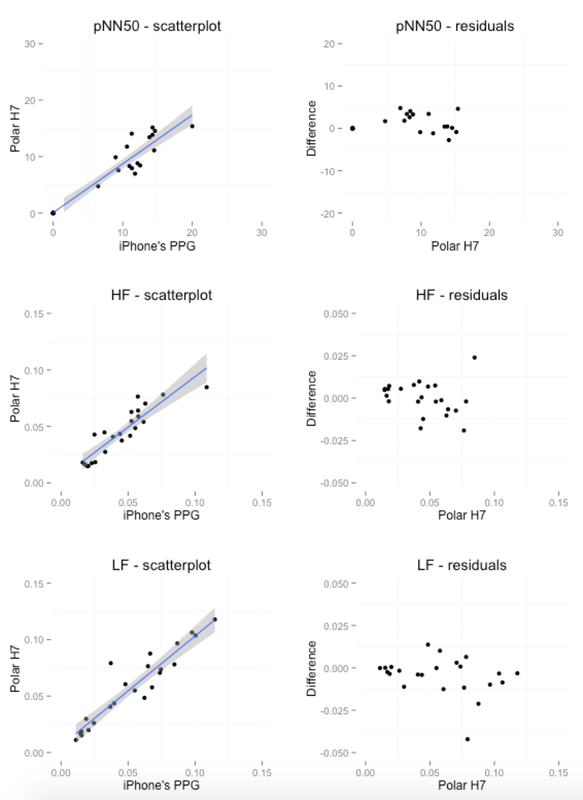
We can also look at the HRV features values computed using the iPhone camera and Polar H7 in a different way, plotted against each other for each time window, and all conditions together (plus residuals):
For the ones that believe in p-values, no statistically significant differences are found for any of the features, if we consider a standard alpha value of 0.05 (t-test for AVNN: p=0.56, SDNN: p=0.92, rMSSD: p=0.56, pNN50: p=0.55, HF: p=0.98, LF: p=0.63).
Summary and tips for the camera
I hope with this post I convinced you that the camera version of HRV4Training is as good as the Polar H7. I went through all time and frequency domain HRV features (+RR intervals and HR computed on shorter time windows), for three different conditions in which the sympathetic and parasympathetic systems interact differently. With both the camera and Polar H7 we could easily spot the differences in HRV features that we expected and for all conditions we couldn't find any statistically significant difference between the two sensor modalities.
For my recordings, I stopped using the H7 a long time ago, and went for the convenience of using the camera and not having to wear the sensor early in the morning. However, I realize there are trade offs and it might take a couple of measurements with the camera before you get familiar with it. Here are a few tips to speed up this process:
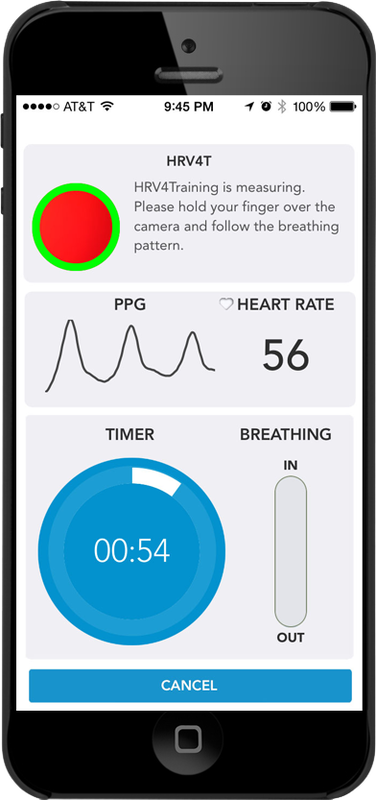
Since version 4.9.2 HRV4Training provides more guidance on how to place your finger as well as a view of the camera to make sure you properly cover it (see screenshots above).
3 Comments
9/9/2015 12:16:49 pm
I am really excited with your findings. As a therapist who uses various forms of bio-feedback to convince my clients of the effectiveness of breathing techniques to achieve coherence I have been waiting for a way to measure HR,HRV,HF,LF ect without having to expect my clients to put on a polar strap. ( too invasive). You have convinced me that that is now available. Thank you for all the creative, innovative and groundbreaking work that you are doing!
Monica
9/11/2015 03:33:12 pm
Impressive blog and ability to translate research into usable information. I am a fan! What apps do u recommend for android systems? 10/6/2015 09:22:56 pm
An artical was in JAMA. Psychiatry Oct 2015 about hiw low heart rate variability is associated with higher risk for PTSD in vets prospectively measured from just 5 minute samples. I have so many people in my peactice who struggle with vulnerability to reactivity. This kind of measuring could be useful in demtstifying their vulnerability. Thanks and keep it up. I will look into the apps and the training. Your comment will be posted after it is approved.
Leave a Reply. |


Register to the mailing list
and try the HRV4Training app! 
|