|
Blog post by Marco Altini In this post, we provide an overview of the main findings deriving from the past years of applied research in team settings. We’ve talked often about data analysis, looking at the big picture and the coefficient of variation as effective ways to monitor individual responses to training and lifestyle stressors, as highlighted for example in this case study. But what about team sports? In a team settings, a few questions pop up: can we derive anything meaningful from absolute values (for example assessments every few months instead of longitudinal monitoring)? How often should our team players monitor? When are the best days to do so? And most importantly: what are the main signs of positive and negative adaptation to training in different phases of the season? We all know each athlete responds differently, so how can we use measures of internal load such as HRV to adapt training based on individual responses? We’ll go over the main studies answering these questions and provide guidelines for you so that you can make the most of HRV4Training Pro with your team. I’ve broken up this post in two main sections, one covering the most important points to remember and a longer one covering quite a few studies for the ones that are more interested in the details. 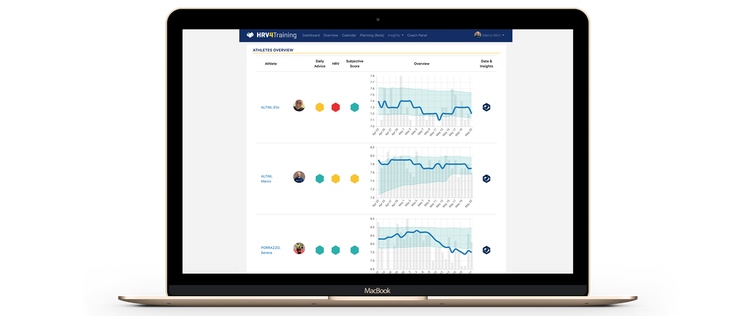 Studies selection criteriaIn the past 50 years an enormous amount of research has been published looking at physiological responses to training. In this (far from comprehensive) blog post, we limited our analysis to works that we believe are of practical interest for coaches and athletes working in teams settings. Considering the huge technological developments of the past few years, which brought a significant shift in the way data can be collected (no need for a lab, less costs, more measurements), we will focus on studies that use methods similar to the ones you might be using today. One of the great advantages of having a large amount of research on the topic is that more and more groups have covered the same aspects, replicating protocols, studies and results, and therefore we are more confident about metrics, procedures and outcome than we would be if this was a younger field. In this post our goal is to consolidate the results in an easy to understand overview showing the main findings and how you can use them in your own team relying on HRV4Training Pro. We tried to include studies that have been replicated or showed very similar outcomes across sports, technologies, measurement protocols, etc. - which normally is a good sign, meaning that we are reporting physiological responses that can be expected when going through certain training protocols (e.g. changes in HRV during pre-season). The short(er) readPublished literature on the use of HRV measurements in team settings repeatedly highlighted the following aspects for what concerns measurement protocol, metrics used, data analysis and practical actionability:
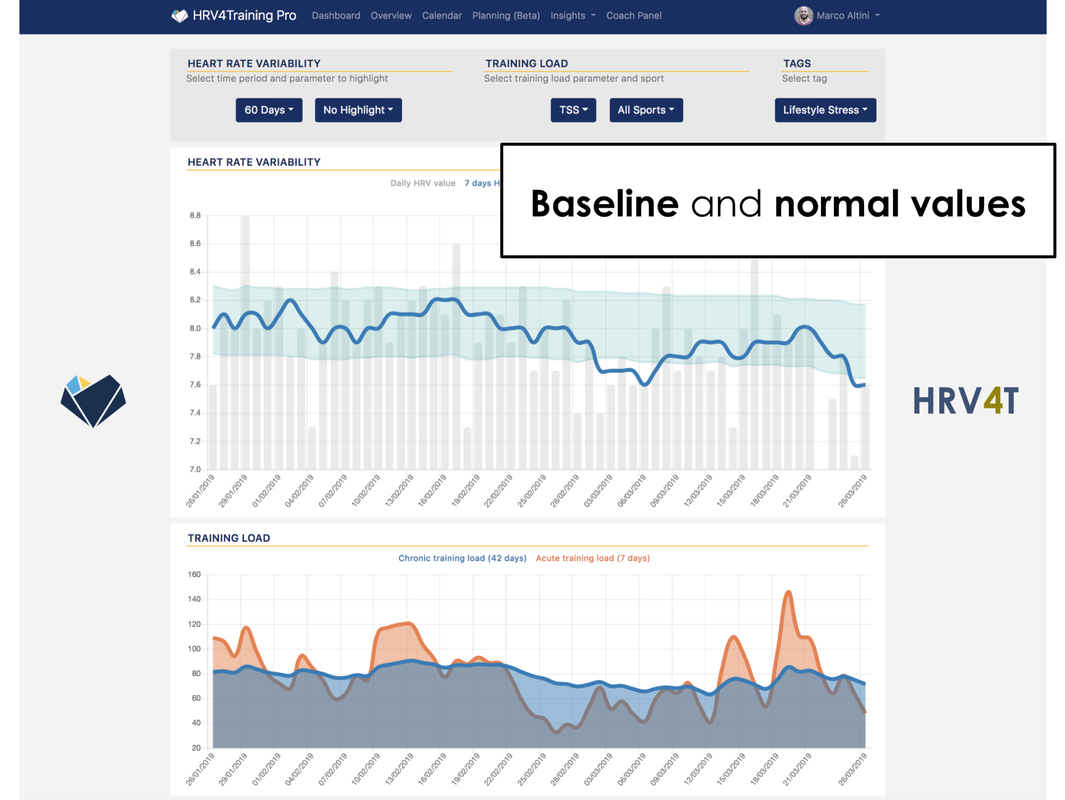
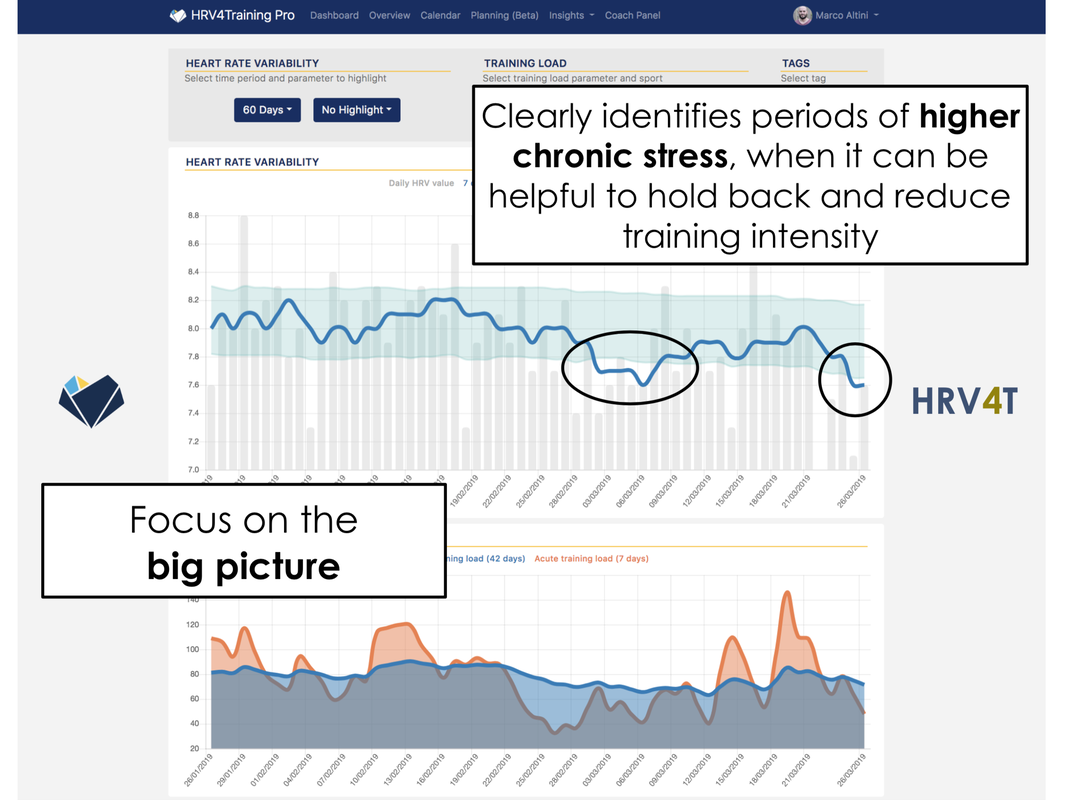
Getting practical: how do you analyze these parameters?HRV4Training Pro provides intuitive visualizations showing in a single screen baseline HRV with respect to normal values (so that you can understand if changes in HRV baseline are significant or if it’s all within normal) and coefficient of variation. Additionally, HRV4Training already combines HRV baseline, CV, resting heart rate and training load to determine how an athlete is coping with the current load, so that you do not have to do the math yourself. Here is an example of HRV baseline and normal values in Pro:
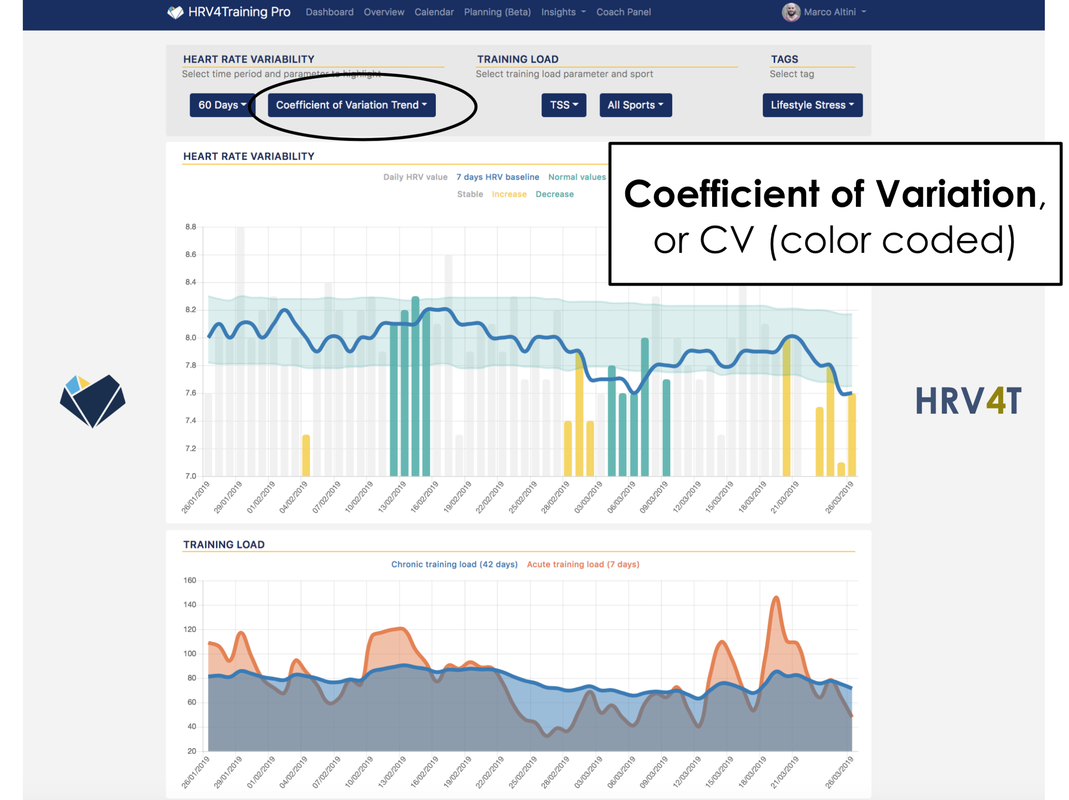
Coefficient of variation:
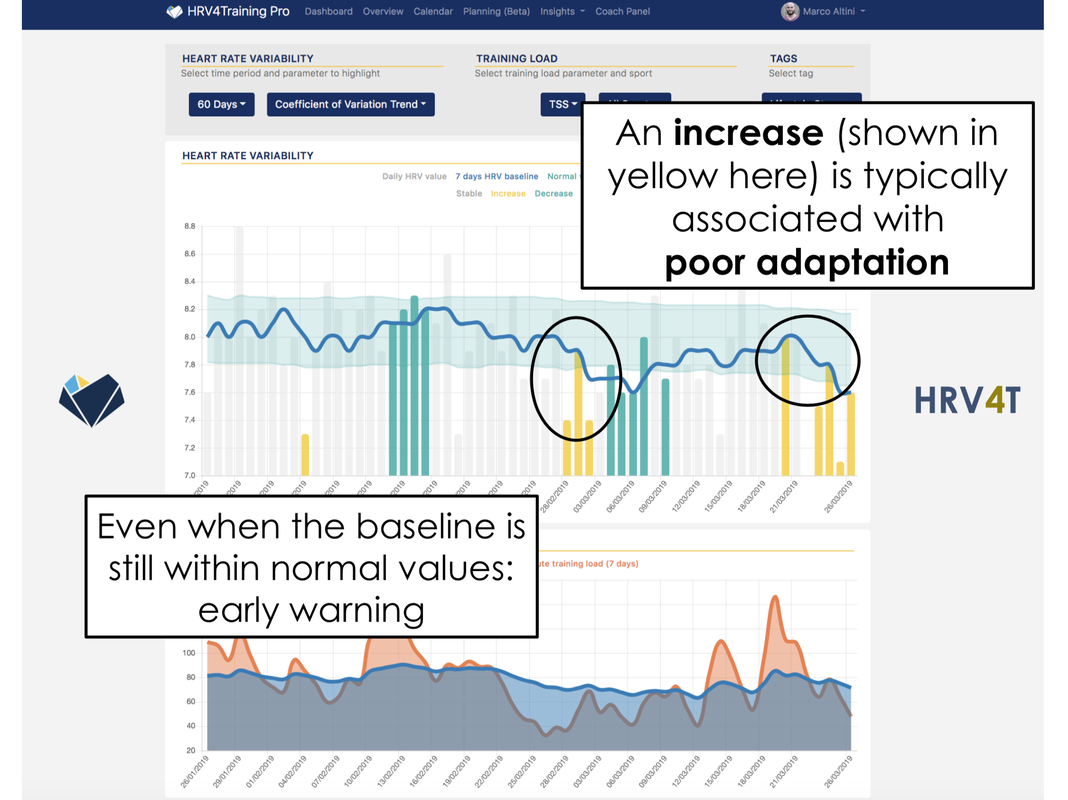
And automatically detected trend: 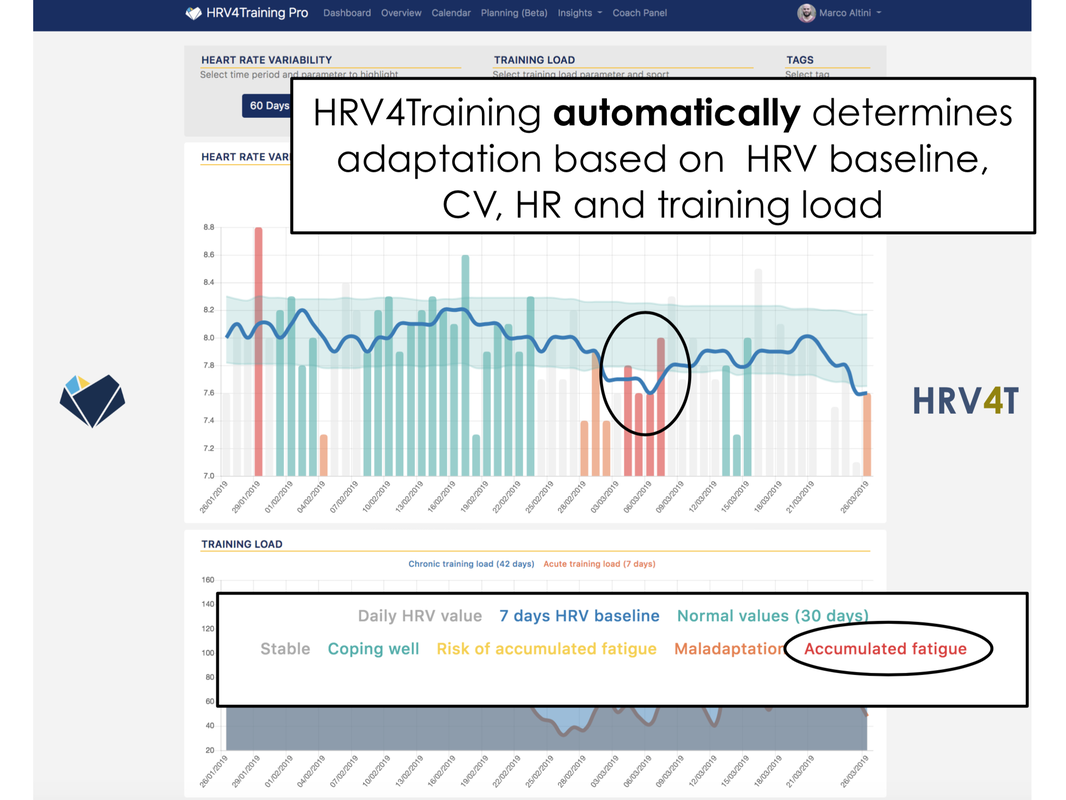 These trends and analytics are in line with what we have highlighted so far for endurance athletes, and if you are new to these metrics I would recommend looking at the following blog posts as well: The long readIn this section we cover in more detail the most relevant studies in the context of analyzing physiological responses to training in team sports, both at the group and individual level. Group level analysis If you have been reading about our work so far, it should be clear that the way we think HRV and other physiological measures should be used, is always in relative terms with respect to an athlete’s historical data. There is little to gain otherwise, as HRV data should be used in a continuous feedback loop, to adjust training based on an individual response. Yet, research often looks at differences between groups to determine if there is anything that can be still considered useful (for example as a screening tool). Differences between groups can become important also in the context of individual analysis, for example if in a certain group responses can differ based on other aspects (consider for example just the case of female and male athletes, and the importance of considering changes in physiology during the menstrual cycle, as we have covered here). Alright, in the context of group level differences Botek et al. [1] looked at 153 soccer players and split them based on age in four groups. In this study values of ln rMSSD (this metric is basically half the recovery points shown in HRV4Training, as our metric is also a logarithmic transformation of rMSSD, so that you can easily compare with published research) decreased significantly after age 25 (4.6 for the first two age groups, then 4.3 and 4.2 for older players). The authors conclude that significantly decreased basal vagal activity accompanied by a small increase in sympathetic activity was observed in players over 25 years of age. Note that heart rate was also lower for older players, making it quite obvious that HRV provides insights on different mechanisms, and the two parameters should be analyzed in conjunction, not one instead of the other. The authors motivated the reduction in HRV with age as a result of the psychological and physical stress contributing to the allostatic load experienced by players. The allostatic load is thought to result in detrimental physiological consequences and in this case thought to be linked to professional career length more than age, with psychological and physical stress considered co-factors that contribute to vagal cardiac deterioration. The authors propose specific interventions to reduce the allostatic load and the consequent detrimental effects on autonomic cardiac control in specific players e.g. a nutritional intervention to reduce %BF, or yoga to manage chronic stress. Yoga was shown by others (Patil et al.) to reduce mental stress associated with chronic training in cyclists and optimized autonomic cardiac function. Later on, in the context of individual training responses and adaptation we will show that reduced vagal activity (HRV) reflects a poor response to training, and therefore the authors propose the implementation of regular HRV monitoring during training in professional soccer players as it provides important diagnostic information about changes in autonomic cardiac regulation over their careers. Such information could be of benefit for adjusting training volume and/or recovery strategies, especially in players who exhibit lower cardiac vagal control. A second group-level analysis, carried out by Proietti et al. [2], looks at HRV differences between players of different teams (instead of within the same team), and in particular at the relation between competitive level and HRV. This work follows the work of others that looked at the same aspects in different sports, for example reporting higher HRV in professional futsal players with respect to younger non-professional counterparts. Three teams were analyzed in this study, champions league, european league and italian second division level. Both the champions and european league had higher ln rMSSD. The differences could be due to the more training typical of professional settings, as well as to genetics, according to the authors. While there were differences at the group level, in my opinion the practical applicability of these insights is very limited. For example, for the champions league players ln rMSSD was 4.45 +- 0.44, which means more or less a range of 3.13 to 5.77, while the second division player had ln rMSSD reported as 4.16 +- 0.30 which means a range of 3.26 to 5.06 (remember these are half what you’d see in HRV4Training’s recovery points). Needless to say, there is almost complete overlap between the groups, so screening players this way is far from a good assessment. Once again, HRV is a tool to be used for within individual feedback on internal load and making adjustments to training plans based on individual responses, more than anything else. Despite what is often reported, the fact that you can find a significant difference between groups does not mean you can discriminate individuals as belonging to one or the other group. In our own work we have shown for example how at the population level HRV is a poor predictor of VO2max [3] while it captures very well training intensity on a day to day basis within individuals [4]. [1] Botek, Michal, et al. "Somatic, endurance performance and heart rate variability profiles of professional soccer players grouped according to age." Journal of human kinetics 54.1 (2016): 65-74 [2] Proietti, Riccardo, et al. "Heart rate variability discriminates competitive levels in professional soccer players." The Journal of Strength & Conditioning Research 31.6 (2017): 1719-1725 [3] Altini, Marco, Chris Van Hoof, and Oliver Amft. "Relation between estimated cardiorespiratory fitness and running performance in free-living: an analysis of HRV4Training data." 2017 IEEE EMBS International Conference on Biomedical & Health Informatics (BHI). IEEE, 2017 [4] Altini, Marco, and Oliver Amft. "Hrv4training: Large-scale longitudinal training load analysis in unconstrained free-living settings using a smartphone application." 2016 38th Annual International Conference of the IEEE Engineering in Medicine and Biology Society (EMBC). IEEE, 2016 Individual level analysisLet’s move to individual level analysis, or in other words looking at how each player responds so that we can truly individualize training and aim for optimal performance. These are the aspects we normally focus on and believe are of most interest for practitioners working with athletes, as the whole point of HRV measurement is to gather more information on internal load and how we are responding to training and lifestyle stressors, so that we can make meaningful adjustments. Seasonal changesOliveira et al [5] looked at changes in HRV and performance (yo-yo test) in 15 futsal players after a pre-season and during the season. Note that while here we are looking at the same athletes over time, we still have a situation in which very little data is collected, more of an assessment than a longitudinal monitoring, as one data point was acquired for each phase of the season. The authors reported significant improvements in HRV during pre-season, and stable values during the season, concluding that team sports, athletes have a tendency to experience positive modifications of their autonomic regulation during the early phases of yearly training programs, and then maintain the indices afterwards due to attainment of threshold values above which adaptation responses cannot be further observed. While no further improvements in HRV were shown during the season’s assessments, I would consider these findings quite normal. What I mean is that during pre-season we take our athletes from a state of suboptimal form to a state of optimal conditioning (ideally), and therefore it can be expected to have improvements in chronic physiological stress and autonomic function. During the season, HRV should be used to balance load and the recovery cycle, not to aim for a higher value. In the long term, what you want to optimize is performance (by for example providing the right stressor at the right time), and not HRV itself. Boullosa et al. also looked at changes in HRV during pre-season in 8 professional soccer players evaluating them 8 weeks apart using night time HRV collected over 4 different days (data between midnight and three AM was used). Similarly to what was reported in [5], HRV increased after pre-season. Additionally, the authors looked also at CV ln rMSSD (the coefficient of variation), reporting lower CV for fitter players, and suggesting that such lower value could be mediated by their greater recovery capacity between efforts as reflected in a faster ultra-short-term heart rate recovery. We will cover in more details the CV later as we move into Flatt’s research, as we consider it a very useful parameter. Nakamura et al [13] looked at HRV changes in 24 elite futsal players pre and post-three or four weeks preseason training, reporting significant increases in HRV again. Finally, in [7] Soares-Caldeira also looked at changes in HRV after a 4-week preseason, reporting significant increases. In this study, additional repeated sprints training resulted in positive changes of HRV (i.e., SDNN, rMSSD, HF, LF, and SD1 indices) which might be due to a higher training volume. The major changes observed in vagal-related indices with additional repeated sprints training may well be due to the greater training intensity needed for HRV change in healthy young and fit participants, according to the authors. Vesterinen reported similar changes in runners with increased HRV only when intensity was added to their training program. The authors conclude noting how possible positive changes for vagal-related indices assessed by HRV indicated a major physiological improvement of athletes to assess training-induced effects. In this way, HRV monitoring may be a critical tool during routine training to identify important physiological adaptations in athletes. [5] Oliveira, R. S., et al. "Seasonal changes in physical performance and heart rate variability in high level futsal players." International journal of sports medicine 34.05 (2013): 424-430 [6] Boullosa, Daniel A., et al. "Cardiac autonomic adaptations in elite Spanish soccer players during preseason." International journal of sports physiology and performance 8.4 (2013): 400-409 [7] Soares-Caldeira, Lúcio F., et al. "Effects of additional repeated sprint training during preseason on performance, heart rate variability, and stress symptoms in futsal players: a randomized controlled trial." The Journal of Strength & Conditioning Research 28.10 (2014): 2815-2826 [13] Nakamura, Fabio Y., et al. "Ultra-short-term heart rate variability is sensitive to training effects in team sports players." Journal of sports science & medicine 14.3 (2015): 602 Training loadIn the previous section we have seen how pre-season triggers changes in fitness which are reflected as positive adaptations (HRV increase). We have also seen how very sporadic measurements (2 times over an entire season) highlighted a stable value after pre-season. Flatt et al [8] looked in more detail at HRV changes in response to varying training load in 9 women from a college soccer team. The authors reported that the CV was the most sensitive marker to changes in training load as daily fluctuations in HRV appeared to be greater during a week of high training load than a week of low training load, while the weekly mean values only demonstrated small changes (with decreases corresponding to higher load). This is in line with what we have covered in our previous posts on the coefficient of variation, as lower training load likely results in less physiological stress and therefore facilitates a more stable HRV profile. In particular, Flatt reports that a lower CV possibly represents reduced perturbation in homeostasis. Buchheit et al. also reported higher CV in less fit athletes throughout a 3-week training camp in young soccer players. Needless to say, the CV needs to be interpreted in the context of HRV baseline and normal values. In another study, Flatt et al [11] looked at changes in training load and HRV throughout a 2-week preseason. The main finding was that weekly changes in training load showed very large relationships with the weekly changes in HRV. Increased training load was associated with decreased HRV while decreased training load was associated with increased HRV and unchanged training load resulted in no substantial changes in HRV. Flatt comments that reducing training load for individual athletes who demonstrate unfavorable psychometric and HRV changes (e.g., reduced HRV and increased CV) in response to intense training may help prevent excess fatigue accumulation. Finally, as subjective data was also collected and was in good agreement with HRV, the authors speculate that increases in HRV may indicate that higher training loads would be well tolerated by certain athletes. In another study, Flatt at el [12] evaluated group and individual changes in resting HRV across a two-week training period in female soccer players and the relation between changes in HRV and fitness. Higher training loads during week 1 resulted in greater reductions in HRV compared to week 2, which involved a reduced training load and smaller HRV reductions. Individual CV was best explained by fitness level and perceived fatigue, in that lower day-to-day variation in HRV was associated with higher levels of fitness and lower perceived fatigue. This is a finding that was reported in a few other studies, showing how in general we expect a lower CV following increased load for more fit individuals, while less fit individuals tend to have more trouble adapting to the load, which is reflected by higher CV (more day to day variability, or being “physiologically all over the place”). [8] Flatt, Andrew A., and Michael R. Esco. "Smartphone-derived heart-rate variability and training load in a women’s soccer team." International journal of sports physiology and performance 10.8 (2015): 994-1000 [11] Flatt, Andrew A., Michael R. Esco, and Fábio Y. Nakamura. "Individual heart rate variability responses to preseason training in high level female soccer players." The Journal of Strength & Conditioning Research 31.2 (2017): 531-538 [12] Flatt, Andrew A., et al. "Interpreting daily heart rate variability changes in collegiate female soccer players." J. Sports Med. Phys. Fitness 57 (2017): 907-915 Training adaptationIn the previous section we have looked at markers of training load, showing how a higher training load block is typically reflected in a higher CV and lower HRV. This is certainly interesting at the group level and gives us some ground to start our own analysis, as we have expected patterns when going through certain training blocks. On the other hand, what really makes things more interesting is how at the individual level certain patterns are associated to performance, and not only training load. For example, how changes in resting physiology are related to subsequent performance adaptation in team sport athletes so that we can determine if early HRV responses help discriminate athletes who are coping well with training and those who are not. This is the focus on Flatt et al [9] who reported a very large relationship between Yo-Yo test performance and changes in CV, which indicated that the players who showed a decrease in CV from weeks 1 to 3 experienced a greater improvement in Yo-Yo performance post-training, hence a reduction in CV seems a clear indicator of positive adaptation to training. This is in line with what was reported by Schmitt et al in endurance athletes, where fatigued elite endurance athletes displayed lower HRV and higher interindividual variation in HRV parameters (CV) compared with those who were non-fatigued. Flatt concludes that the decrease in CV indicates adequate recovery, appropriate training loads, and positive adaptation. In contrast, the athletes characterized with an increased CV were possibly experiencing higher fatigue and inadequate recovery. These results are in line with what was found in Boullosa’s study. Esco et al. analyzed individual responses in weekly measures of HRV and their relation to the eventual change in VO2max following an off-season training program of 11 weeks in female soccer athletes. Interestingly, the change in HRV between week 1 and 3 was almost perfectly correlated with the change in VO2max at the end of the 11 weeks, hence identifying that the initial change in weekly mean HRV from weeks 1 to 3 of a conditioning protocol was strongly associated with the eventual adaptation of VO2max (80% of the change in VO2max was explained by the change in HRV during the first 3 weeks). These are interesting findings in the context of determining “trainability” for an athlete (or who is a responder), note also that HRV and CV values at week 1 had weaker or non-existent relationships with future changes in VO2max, hence once again highlighting how an “assessment” of these metrics is of much less value than longitudinal monitoring. While this study is quite unique, the author’s interpretation is in line with other research in the field. In particular, Esco highlights how increases in the weekly mean HRV during normal, non-overload training are typically related to positive adaptation while decreases in the weekly mean during normal training are typically associated with fatigue. Based on previous interpretations of weekly or even daily mean changes, it appears that increases in weekly mean HRV were indicative of a positive training response where training loads were well tolerated by select individuals. In contrast, athletes characterized with a decrease in weekly mean values were likely not coping well to the training program. This is generally accompanied by increased psychological stress, which is an independent predictor of reduced responsiveness of VO2max to exercise training. [9] Flatt, Andrew A., and Michael R. Esco. "Evaluating individual training adaptation with smartphone-derived heart rate variability in a collegiate female soccer team." The Journal of Strength & Conditioning Research 30.2 (2016): 378-385. [14] Esco, M. R., A. A. Flatt, and F. Y. Nakamura. "Initial weekly HRV response is related to the prospective change in VO2max in female soccer players." International journal of sports medicine 37.06 (2016): 436-441 ContactI hope you found this write up useful. If you are interested in using HRV4Training and Pro with your team, drop us a line here.
Comments are closed.
|


Register to the mailing list
and try the HRV4Training app! 
|