|
Blog post by Marco Altini Alejandro Javaloyes and co-authors have been working for quite some time already on HRV-guided training, which we have discussed earlier with Alejandro himself. In this study, the authors put to the test standard block periodization vs HRV-guided training, showing better results for the HRV-guided approach. Let's look at the details of this study, before we cover how you can use the same approach in your own training.  What's HRV-guided training about?The principleHRV helps us to quantify individual responses to stress (you can find plenty of case studies here). The hypothesis for HRV-guided training is therefore that by providing the most appropriate training stimuli in a timely manner, when your body is ready to take it, positive adaptations will occur and you will be able to improve performance. Normally a timely manner means when your daily HRV or baseline HRV is not suppressed, with respect to your historical data. In their previous paper Alejandro and co-authors already showed how HRV-guided training could lead to better performance, and reported: "hypothesis for this greater adaptation to training for the HRV guided group is in line with the idea of performing high intensity training when the athlete is in optimal conditions to perform it. Therefore, these differences in PPO changes may be due to a better timing in the programming of high intensity training”. Needless to say, our capacity to handle stress is limited, and while periodization is possibly an important starting point, we need to be able to add flexibility and provide the right stimulus at the right time, which is what HRV allows us to do. The protocolFor this study, the authors used the HRV4Training app to collect data first thing in the morning. 20 well trained cyclists were split into two groups, an HRV-guided group and a control group. The HRV-guided group used our app to collect rMSSD data, which was then transformed (taking the logarithm, this is the same transformation we have when we report you Recovery Points, with the only difference that we also multiply it by 2 to make it a bit more user friendly, as it ends up in a 6 to 10 range for most people). The data was used as follows: when the HRV baseline fell outside the normal values for an athlete, training intensity changed from high intensity training to low-intensity training or rest. The resultsThere's a lot in this paper that is worth mentioning, in terms of two aspects
While it is obvious that the main goal here is to improve performance, looking at physiological changes between the baseline and load periods paints a clear picture that we have seen over and over also in team sports: athletes that cope better with the load, or struggle less to adapt, have a physiological profile that typically results in stable baseline HRV and reduced coefficient of variation (CV) . The interesting bit here is that by using HRV-guided training, we are able to avoid those periods in which the athlete struggles more (and indeed the data in the paper shows reduced CV and stable HRV only for the HRV-guided group, since high intensity training was not performed when things were not looking great). As a result, we'll see below that performance benefits too. This is something that came up also recently in my research on elite triathletes going to an altitude training camp, where the athletes that adapted better to the new stressor (in my case altitude), did not experience an abrupt change in the CV, while athletes that struggled to adapt, had a much higher CV at the beginning of the camp (hopefully I'll be able to share more on this later on). Back to the study, in terms of performance measures: cyclists performed: (a) a graded exercise test to assess VO2max, peak power output (PPO), and ventilatory thresholds with their corresponding power output (VT1, VT2, WVT1, and WVT2, respectively) and (b) a 40-minute simulated time-trial (40 TT). The HRV-guided group improved VO2max, PPO, WVT2, WVT1 and 40 TT, while the regular block periodization group improved only WVT2. As mentioned by the authors in their discussion: "Despite the beneficial effects reported by block periodization models, concentrated workloads without valid and reliable measures of the response to training could lead to an overreached state that limits training adaptation. In this study, HRV was used to determine whether athletes were able to perform high-intensity training" and concluding: "The evidence from this study gives further supports to the notion that HRV is a valid and reliable tool to detect the daily recovery/fatigue and subsequently prescribed training in well trained cyclists. Thus, the implementation of daily HRV measurements and practical methodologies to change the training prescription on a daily basis could lead to better timing in prescription, thereby giving greater insight into the programming puzzle and optimizing training regimes to enhance both fitness and performance" How can you use the same approach?This approach has shown to be effective in a few studies already: The good news is that it can be easily implemented for you and your athletes, as all you have to do is to scale down the planned intensity when your HRV is suppressed. For example in the figure below, you would reduce intensity starting around the days where you see the baseline going below the athlete's normal values, as shown in HRV4Training Pro: 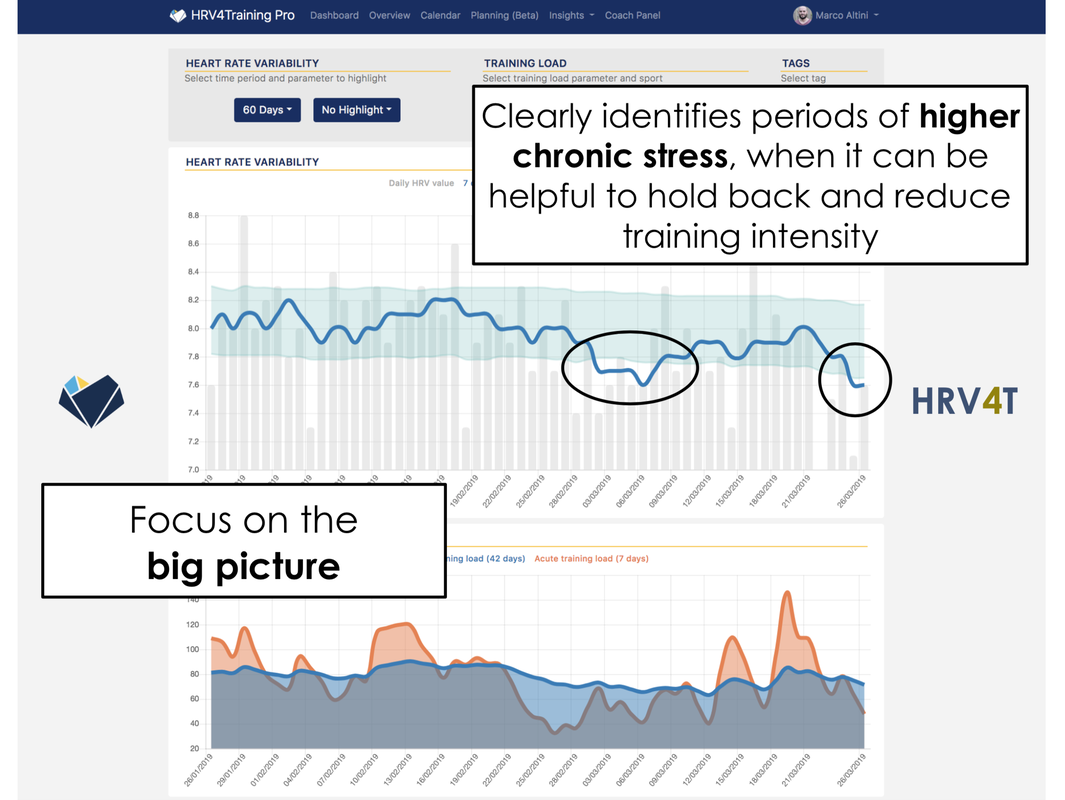 This method makes intuitive sense, as our capacity to handle stress is limited, you do not what to go really hard when your body is already struggling to manage stress (and remember, stress means both training and non-training related stressors, which is why HRV data is particularly relevant, and monitoring training load alone is insufficient - check out this case study for a clear case of psychological stress). Monitoring individual responsesThe HRV baseline is the first parameter that we should be looking at, as it clearly captures overall stress on the body. However, as we have discussed above, the coefficient of variation (or CV) is a very useful parameter to detect potential issues. In particular, an increase in the CV is typically representative of poor adaptation or difficulties in coping with training (and other stressors). Using Pro, you can also easily check the coefficient of variation, which again should not increase much in periods in which we are responding well to the load. Additionally, the coefficient of variation can show us early warnings of poor adaptation even when the baseline is still within normal values, as this is a sign of disrupted homeostasis and difficulty in coping with the stressors present in a given moment, as shown below:  Closing the loopPersonally, I believe this paper is what I've been working for in the past decade. It doesn't take much to understand that our capacity to handle stress is limited, and that stressors (training as well as lifestyle) can be better balanced by most of us. It is however far from straightforward to develop valid, reliable and easy to use instruments that can enable this process, to the point that new research and practical insights can be derived consistently by the use of such an instrument. For years, the belief was that it was impossible to measure HRV accurately using a phone camera, which is something now pretty much everyone takes for granted. Similarly, there was a lot of confusion on metrics and how to interpret them, and hopefully visualizations such as the ones we have provided showing daily scores, baseline and normal values, as well as our guides and case studies, are finally making this process much clearer too. These methods, are the same adopted in the study above. I hope our tools and these studies will help you making the most of something as simple and as powerful as measurements of resting physiology. Other useful resourcesWe recently put together a series of posts that cover many aspects of HRV measurement, data interpretation as well as plenty of examples that you can look at to better understand how to make use of the data, and how HRV relates to training and lifestyle stressors.
Check them out at these links:
Comments are closed.
|


Register to the mailing list
and try the HRV4Training app! 
|