|
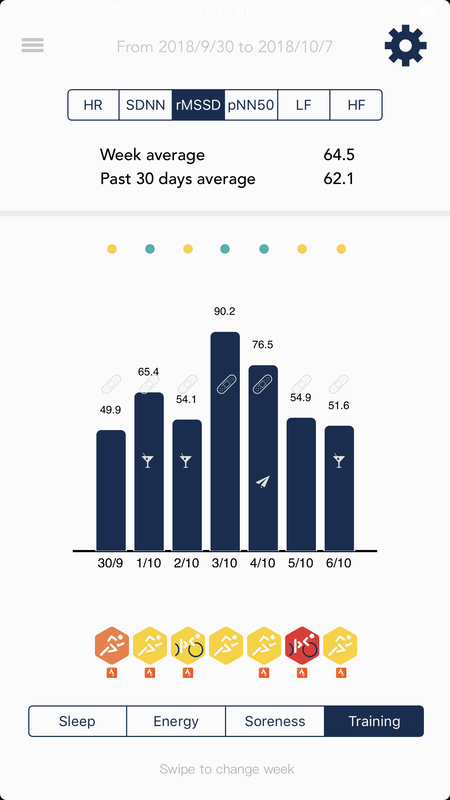
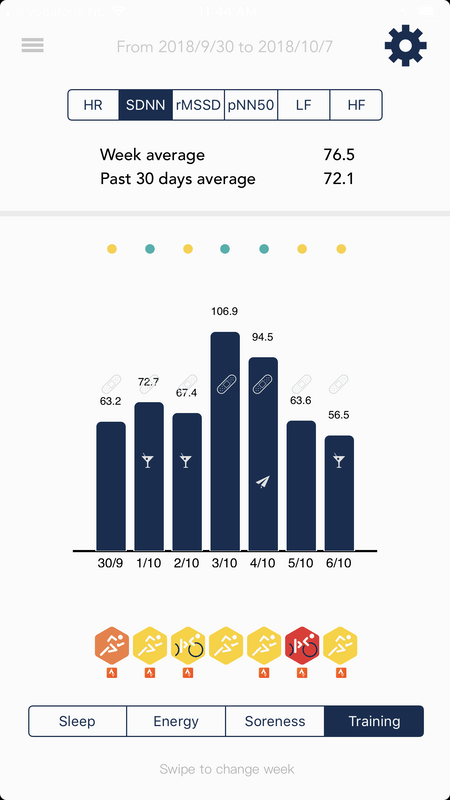
Blog post by Marco Altini One really good thing about the sports science community, is that we have settled on what feature to use when we talk about heart rate variability (HRV). As many of you know, HRV can be computed in many different ways, starting from our basic unit of information, the RR intervals (beat to beat differences in instantaneous heart rate). The sports science community through the work of many, including Martin Buchheit, Daniel Plews, Paul Laursen, Andrew Flatt, Martin Esco, Fabio Nakamura and a few others, in the past 10-15 years, settled on rMSSD as the most meaningful and practical feature to use in applied research and real life, when working with athletes. Why rMSSD? Well, first of all, most sports scientists are physiologists, they know what they are talking about when considering physiological processes in the human body, and it turns out what also came up from all these studies, is that there is mainly one thing that can be measured using short term HRV features: parasympathetic activity. Without going into another primer on HRV (see this post if you are looking for one), parasympathetic activity represents our body's rest & recovery system, and can be captured in terms of HRV: a stressor might for example induce a physiological response in terms of reduced parasympathetic activity, which translates into lower HRV as the nervous system modulates heart rhythm in response to such stressor. Parasympathetic activity acts quite fast, in the matter of seconds. How do we capture these fast changes? rMSSD, due to how it is computed (just math), captures fast changes in instantaneous heart rate, hence it reflects very well parasympathetic activity. It's also easy to compute and standardized, hence we can be certain we all talk about the same thing, which is a good starting point. Wonderful, we have a feature that everybody agrees on, and has also a clear link to how physiology works. All problems are solved and we can use HRV4Training or our favorite HRV app to gather data, compare results, and learn a bit more about how our body responds to training and life stress. Well, not so fast. Apple, the Health app and SDNNUnfortunately, Apple decided to provide no access to raw PPG data in the Apple Watch and no access to RR intervals either (like a Polar strap would do), as well as not to implement standard communication protocols (e.g. the bluetooth smart heart rate profile). This means we cannot compute rMSSD or any other feature ourselves, as we'd do with another sensor. Additionally, they decided to limit communication between the Watch and any app just via the Health app, and use only one HRV feature in the Health app: SDNN. The reasons are of course unknown and undocumented. There is no access for developers, and no possibility to communicate with anyone involved in this work at Apple. Anyhow, now that we got as far as understanding what is used in Health (SDNN), and we know all the limitations around it, the problem remains, how do we deal with it? Normally, this would be none of our concern, but as Apple has almost a monopoly on mobile platforms today, what they decide to do, affects all of us that rely on their platform. Right now, we at HRV4Training write the SDNN value to health when you measure. However, the whole point of the Health app, is that we can all happily exchange data. So, if you use an Apple Watch or another device that reliably writes to Health when you take a measurement first thing in the morning (never forget that context is key), shall we read that value and use it to compute your Recovery Points and all our analytics? Can we rely on SDNN or shall we keep 'forcing' users to measure via our app and ignore the Health app? I believe it's time to have a look at the data, and try to understand from a practical point of view, what are the implications of using SDNN, and what use can we make of this parameter. In particular, can we determine by looking at years of contextualised physiological measurements taken using HRV4Training if SDNN can be a valid alternative to rMSSD? Read on to find out. AssumptionsHaving worked in this space for the past six years, obviously I have some assumptions to start from. In particular, anyone that has measured HRV in the morning using one of the available apps, and has gone back and forth between rMSSD and SDNN, as certainly noticed that the day to day variability is extremely similar (see images below). Absolute values here are irrelevant, as what we care about is how physiological stress is changing over time, in relation to your historical values. We also know that both measures capture variability (by definition) and I would speculate that for 'real world measurements', which means mostly 60 second ones, and in the best case 5 minutes ones, variability is indeed the keyword. What do I mean by that? I mean that any way to capture variability, would provide useful feedback. What we are interested in, is how stress modulates heart rhythm, higher stress reduces variability, no matter how you capture that variability (in my opinion!). Think it this way: in the past, we used just heart rate for this same purpose, as huge stressors would increase heart rate. However we have shown (and we'll show also later in this post) that heart rate changes are typically very small (less than 1%), while changes in HRV are greater and therefore more useful to better understand the impact of training and life stressors. How can we use data to evaluate rMSSD and SDNN?
Power to the dataIn order to understand if we can use SDNN as a valid alternative to rMSSD, we will perform three different analysis:
First, we can look at what is the relation at the population level, between individuals. If the two metrics are similar, we expect a similar distribution of values (similarly shaped, again the absolute values do not matter here), as well as a very high correlation between the two. Secondly, we should also look at how things change within individuals, as that's really what we care about. Can we see similar trends over time? What about other features, not only our HRV baseline, but for example the HRV Coefficient of Variation, typically used in sports science to better understand adaptation to a specific training block? If we pass these two first checks, then there is one more we can do which is really interesting. In particular, by analyzing longitudinal data for many individuals, and their daily tags (annotations), we can see how good these features are in the context of capturing acute stressors, always a good check to do. For example, we can look at the change in HRV when someone reports being sick, as well as the change in HRV on a day to day basis after a rest day or a hard workout. In this case we expect a consistent reduction in HRV, as we have shown in this paper in the past. Population level analysisFor this analysis, we look at the average HRV (rMSSD and SDNN) for 15 000 individuals as captured in 2016 and 2017 using the HRV4Training app. That's about a thousand times more people than the average sports science study. Distribution of the dataBoth distributions look highly skewed, with a long tail, as expected. This is one of the reasons why we typically use / report the logarithm of rMSSD, a transformation that makes the data more normally distributed, and should probably be done also when looking at SDNN. 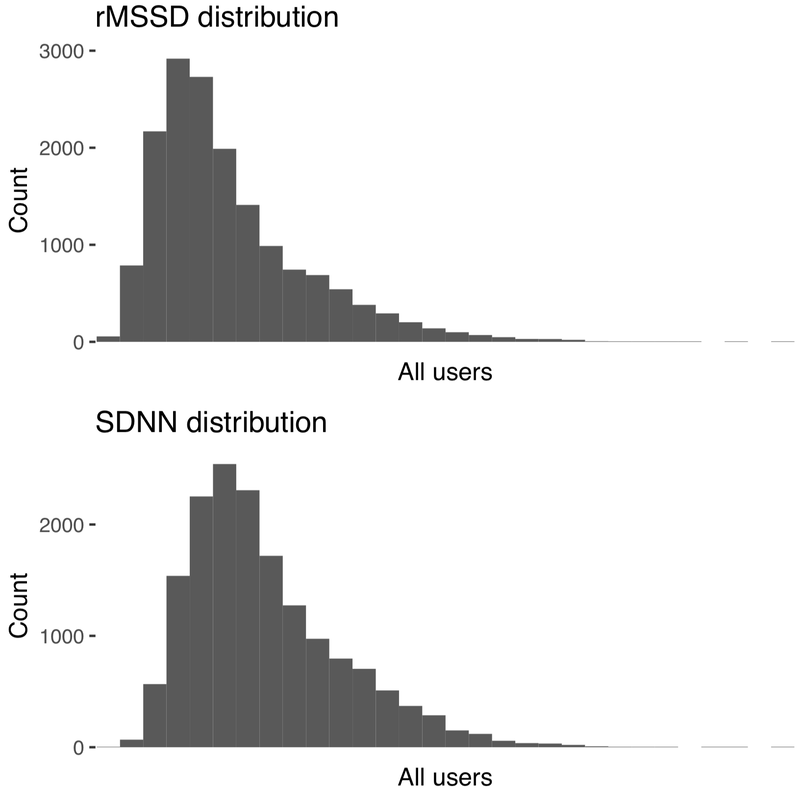 CorrelationWe have computed the correlation matrix of all standard HRV features (heart rate, rMSSD, SDNN but also pNN50, LF and HF). We can see from the plot below that the features with the highest correlation coefficient, are indeed rMSSD and SDNN (0.93). Another good sign if we want to rely on SDNN: 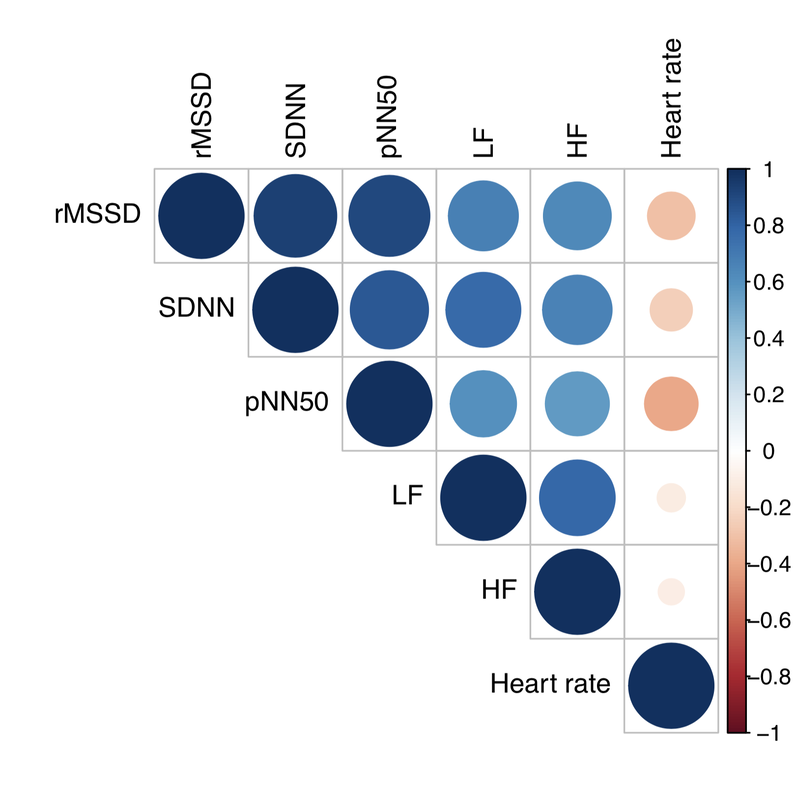 From SDNN to Recovery PointsIn the next analysis, I am using Recovery Points, the metric we derive from rMSSD in HRV4Training, which is nothing more than a logarithmic transformation. I wanted to show exactly what the data would look like in HRV4Training if we were to read SDNN from Health, hence I proceeded as follows: first, I've created a model to estimate rMSSD from SDNN, based on data from 15 000 individuals. Then, once I could estimate rMSSD fairly accurately (given the high correlation show above, this is an easy task), I have applied the usual formula to go from estimated rMSSD to estimated Recovery Points (shown with an * in the plots below). We can see how the distributions are really similar, this time also in terms of absolute values, and more 'normal' than what we had before: 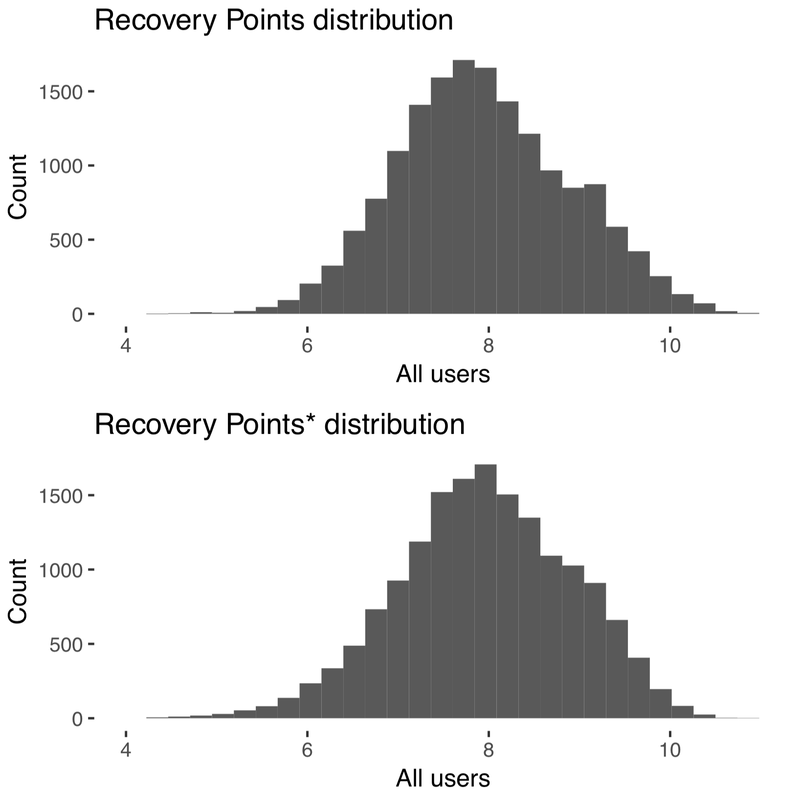 Within individual analysisFor the individual level analysis, I will show two case studies. Can we see similar trends over time? What about other features, not only our HRV baseline, but for example the HRV Coefficient of Variation, typically used in sports science to better understand adaptation to a specific training block? This analysis will be more qualitative. Recovery PointsFirst user: 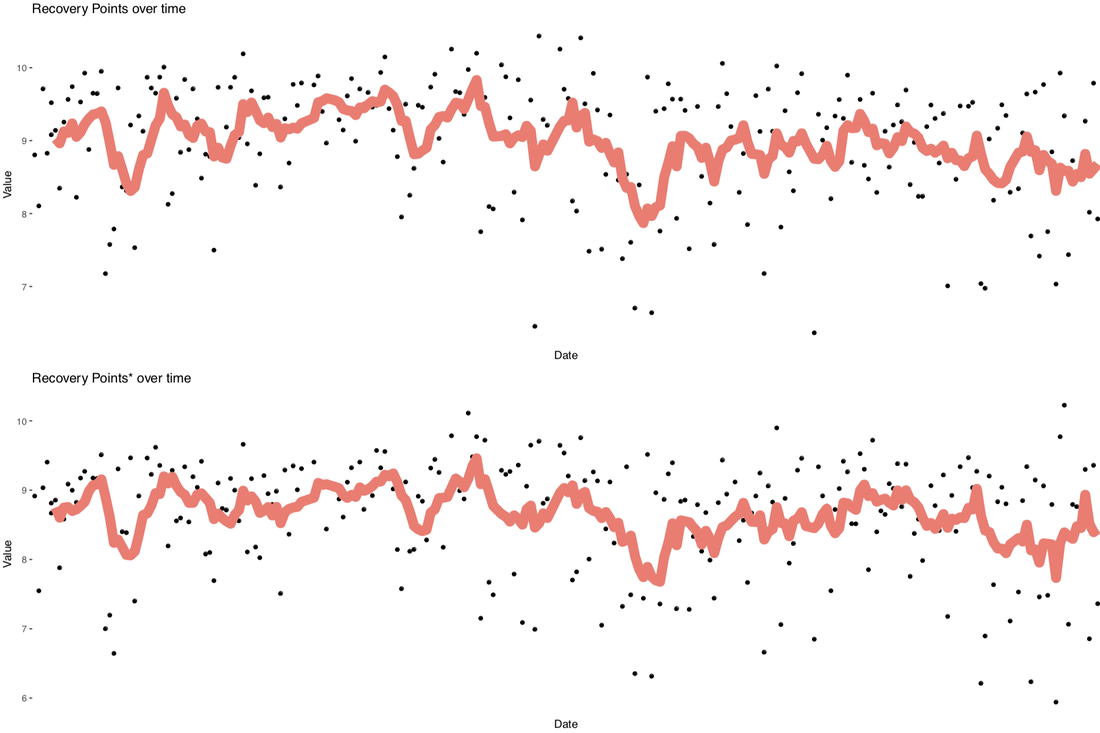 Second user: 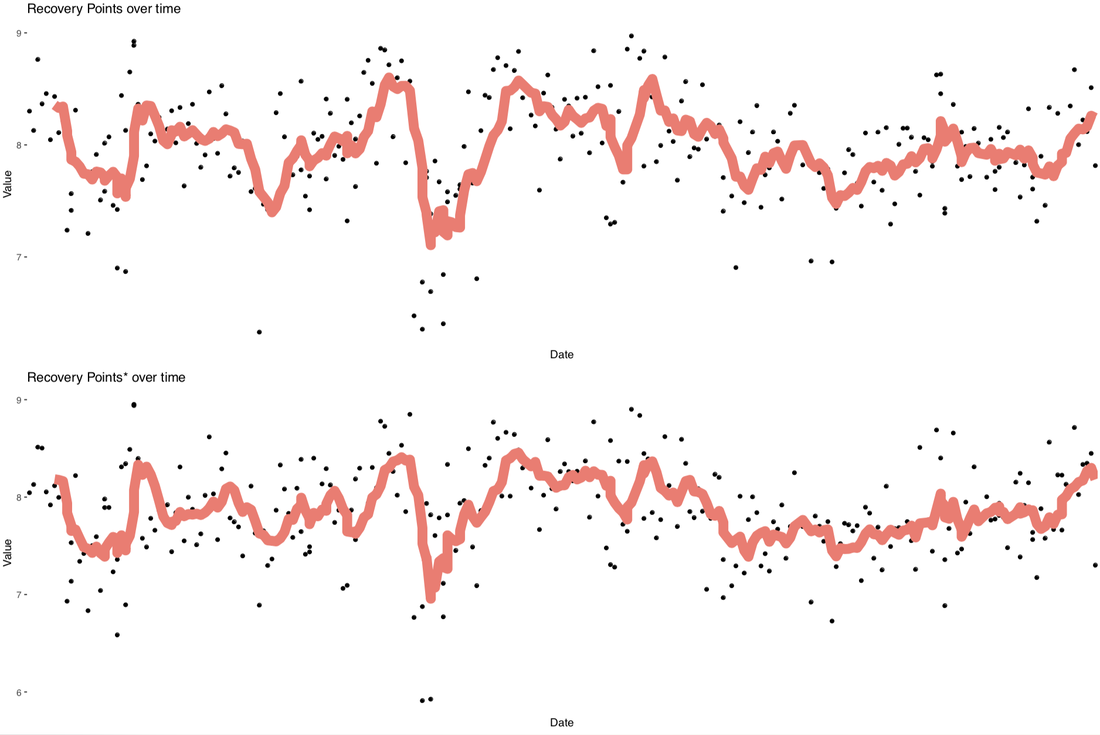 In both cases we can see quite clearly very similar trends for Recovery Points computed using rMSSD (top plot) and computed using SDNN (bottom plot). The red line is a 7-days moving average, what in the app we call 'baseline'. Coefficient of VariationFirst user: 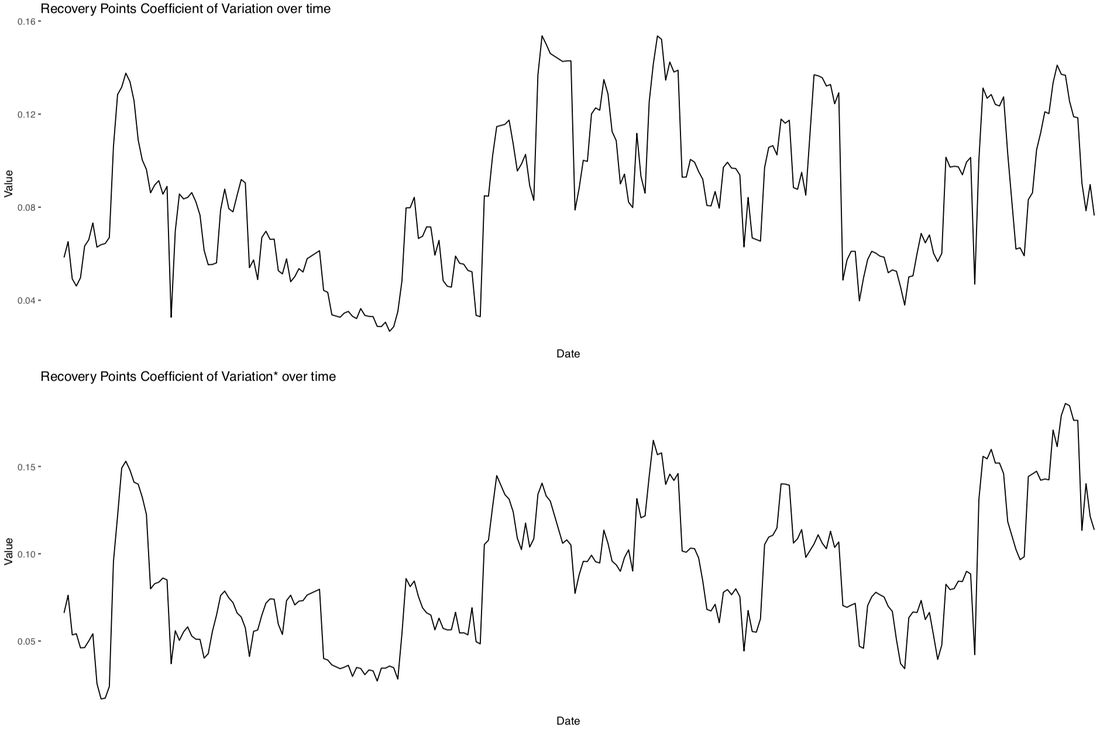 Second user: 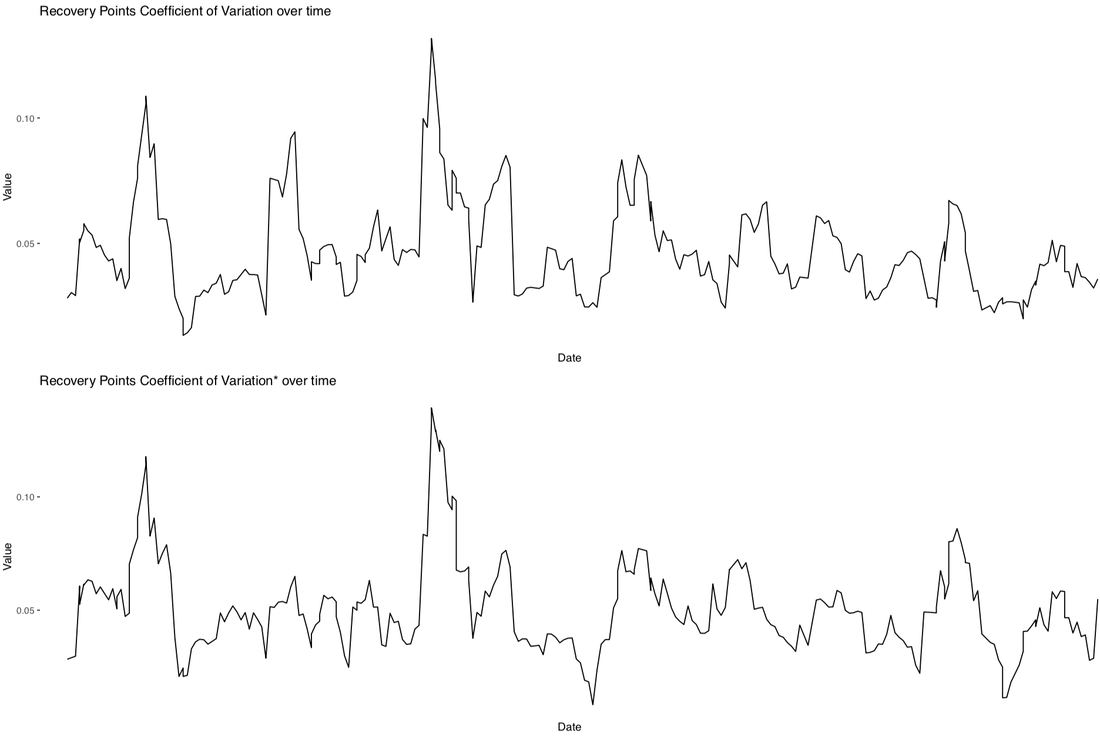 Again, in both cases we can see quite clearly very similar trends for the coefficient of variation of Recovery Points computed using rMSSD (top plot) and computed using SDNN (bottom plot). So far it looks like rMSSD and SDNN behave in a very similar manner, let's now have a look at how well we can capture the effect of strong, acute stressors on physiology. Effect of acute stressors on HRV: training and getting sickThere is one more analysis we can perform which is really interesting. In particular, by analyzing longitudinal data for many individuals, and their daily tags (annotations), we can see how good these features are in the context of capturing acute stressors, always a good check to do. For example, we can look at the change in HRV when someone reports being sick, as well as the change in HRV on a day to day basis after a rest day or a hard workout. In this case we expect a consistent reduction in HRV, as we have shown in this paper in the past. The following plots are also generated from data collected in 2016 and 2017 from about 15000 individuals. Training intensityThe relation between physiological data and training can be analyzed by first computing day to day differences in HR and HRV (e.g. the difference between today's score and yesterday's) for each user. Subsequently, we can analyze the change in HR and HRV on days following trainings of different intensities for each user, answering the question: how did your HRV change between yesterday and today, considering that you trained hard (or rested)? I clustered training intensities in two groups first, using self reported intensities, and then also broke this down into 4 categories (rest, easy, average and hard). I additionally analyzed the relation between HR, HRV and training by age group and gender.  What we can see from the plot above is that SDNN is sensitive to the change in training intensity, definitely a better marker than heart rate, but possibly not quite as good as rMSSD. Note that this analysis captures macro stressors (training), but fails to consider the fact that all stressors are acting at the same time (diet, sleep, alcohol intake, getting sick, mental stress, etc.) hence isolating only one stressor and seeing such strong changes in an unsupervised analysis, is definitely a positive highlight of how effective these metrics are in capturing increased physiological stress when workouts are self reported as high intensity. Training intensity: by gender Same considerations as above, the relationship holds across genders. Training intensity: by age group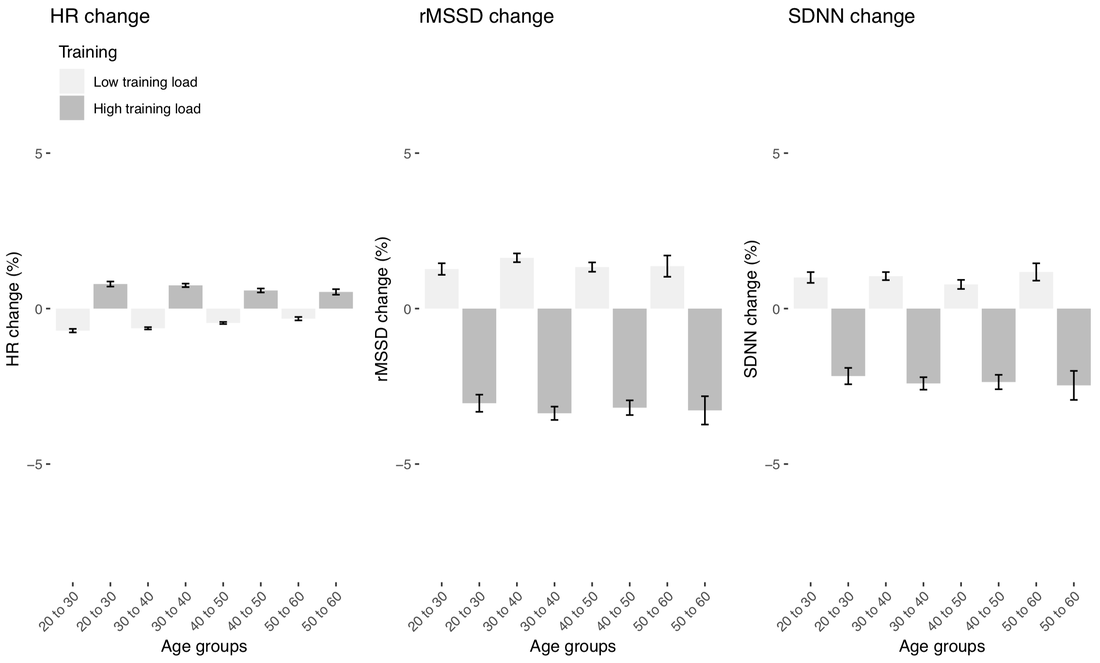 Again, the same considerations, the relationship holds across age groups, meaning that these metrics can be used at any age and gender to measure physiological stress in response to training. Training intensity: more categories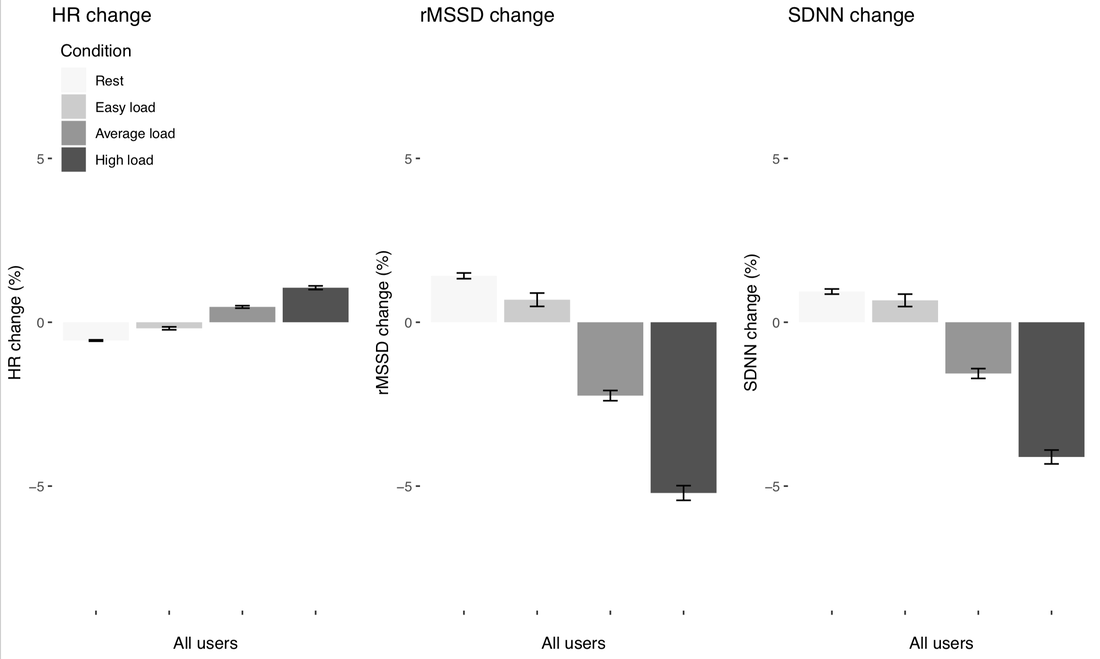 Given the positive results above, we took things one step further, and looked at changes in HRV for a more fine grained input metric, training intensity self reported as rest, easy, average or high. We can see how HRV decreases the greatest for high intensity, a bit less for average trainings, and increases for rest and easy ones, by a lesser extent. Again really interesting data and very consistent for different metrics. Getting sick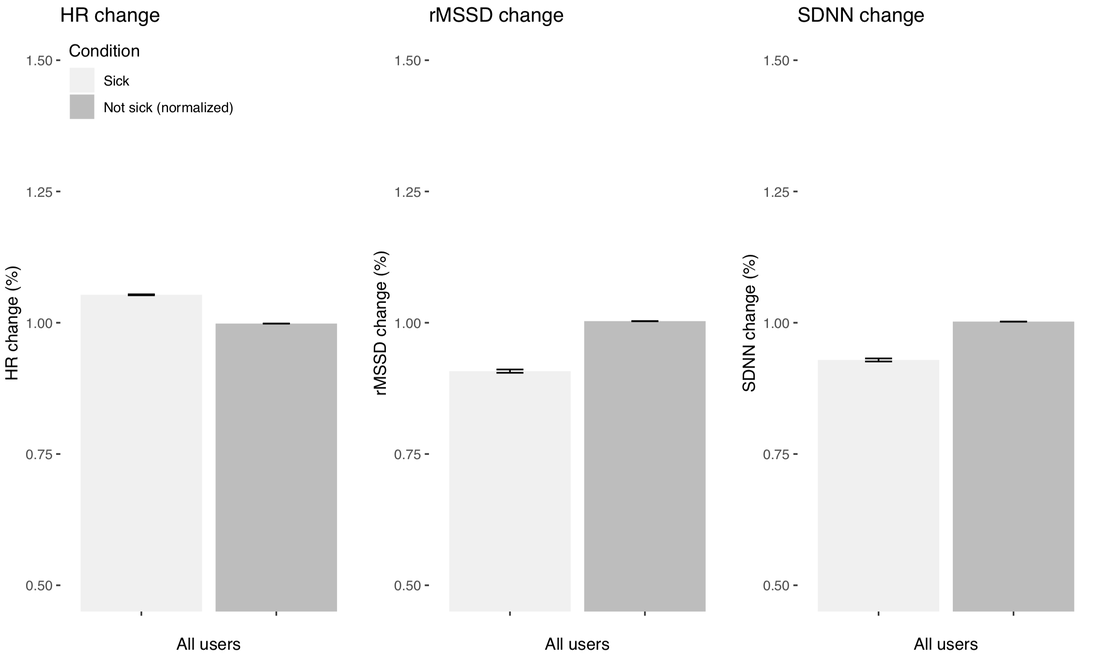 In the plots above, we look at things a bit differently. When getting sick, it's not really the day to day difference that matters, but it's more interesting to look at the difference between the two conditions, so 'not sick' and 'sick'. Hence above we considered 'not sick' the normal, and normalized the data with respect to that 'not sick' value, which is why the bars are at 1.00 - then we look at how much things change within an individual when sick, for example rMSSD is about 85% of a person's normal when sick. Again these changes are consistent for all metrics, with the largest change shown for rMSSD, followed by SDNN. Summary and practical implicationsIn this post, I analyzed the relation between the two most commonly used HRV features: rMSSD and SDNN. I've shown how for short measurements taken under known conditions (reproducible context, the most important thing when analyzing physiological data: first thing in the morning), what really matters is variability, and both measures can capture such variability. I've shown also that the two metrics are similarly distributed, highly correlated, and that Recovery Points, our human-friendly HRV metric, can be estimated from both. SDNN can therefore be used to track physiological stress over time, as it is capturing differences in cardiac variability both at the population level (as known from years of research) as well as within individuals, for example with respect to external stressors (training, getting sick). While the physiological underpinnings of using rMSSD as HRV marker have stronger links to how the autonomic nervous system works, the fact remains that in practice, higher stress reduces cardiac variability no matter how you measure it, and these changes can be captured with short 60 seconds tests using an app. Note that the differences in response to acute stressors for rMSSD were still slightly higher, hence rMSSD would remain my preferred feature when available. To me, the main challenge for today's practitioners is not using one feature or the other, but proper testing. What I mean is that educating your clients on the importance of context and the morning routine is by far more important than using one feature or the other. Unfortunately, devices that claim to do HRV all day, often simply reporting random data points (e.g. the Apple Watch), are really making it harder to properly communicate these aspects. Hopefully this post provides some clarity to the many that are a bit confused by the different metrics, and also can get us started on some common ground between people 'loyal' to one metric or the other: it's mainly about variability. What’s next for HRV4Training?We are working on an updated version of HRV4Training, which will compute Recovery Points based on SDNN data present in Health, should you prefer to do so instead of taking your measurement with our app. We are doing so only now because there is finally evidence that the Apple Watch can measure SDNN as good as a Polar chest strap, when a measurement is triggered using the Breathe app. You can find the validation by Hernando et al. "Validation of the Apple Watch for Heart Rate Variability Measurements during Relax and Mental Stress in Healthy Subjects", which was just published, here.
Please remember that measurements must still be collected first thing in the morning, because there is nothing to learn from data points that are collected at random times of the day or night (which is what the Apple Watch does automatically if you do not use the Breathe app to trigger a measurement). Context is key, and we’ll keep repeating it until exhaustion. In practical terms, you will simply have to use the Breathe app first thing in the morning, from your watch, so that an HRV measurement is forced and pushed to Health. Then you will be able to open HRV4Training and read from Health instead of measuring, fill in your tags as usual, and let the app compute significant changes, and provide you with advice. Coming soon. Comments are closed.
|


Register to the mailing list
and try the HRV4Training app! 
|