|
Blog post by Marco Altini In this post, we cover a few insights derived from recent research on HRV and the menstrual cycle, including a journal paper just published by Patricia Doyle-Baker and her group at the human performance lab, University of Calgary, using HRV4Training. This is the first study to monitor HRV daily during the menstrual cycle to understand the impact of different phases of the cycle on autonomic activity. We are glad HRV4Training made it possible to finally collect real life data with high compliance and I hope this write up will be useful to better analyze your own data or your athlete's data, so that you can include an additional piece of information in the decision making process.  In literature, the relation between menstrual cycle and HRV is investigated to understand if the menstrual cycle can act as a confounding factor when analyzing HRV data, for example because of changes during the different phases of the cycle that would require to interpret the data differently. The first potential confounding effect of the menstrual cycle brought up in literature is at the population level, so for analysis that look at sex differences in HRV features. This is not really something too relevant in our case, as we always stress that data should be analyzed at the individual level, with respect to your historical data, and not compared to others (Aubert et al, heart rate variability in athletes). Many studies in literature have shown that regulation of the ANS is modified during the menstrual cycle, hence the need to further investigate the relationship with our marker of parasympathetic activity, rMSSD. A second and more relevant aspect, tightly coupled with what just discussed, is that if different phases of the cycle have an influence on autonomic activity, then even at the individual level HRV data might be affected by the cycle phase, which should be accounted for when we look at our data. HRV analysis in women may be inconsistent if HRV cannot be considered stable across the menstrual cycle or if the expected differences are not accounted for. This can be an issue as interpretation may lead to inappropriate conclusions. What do we know?
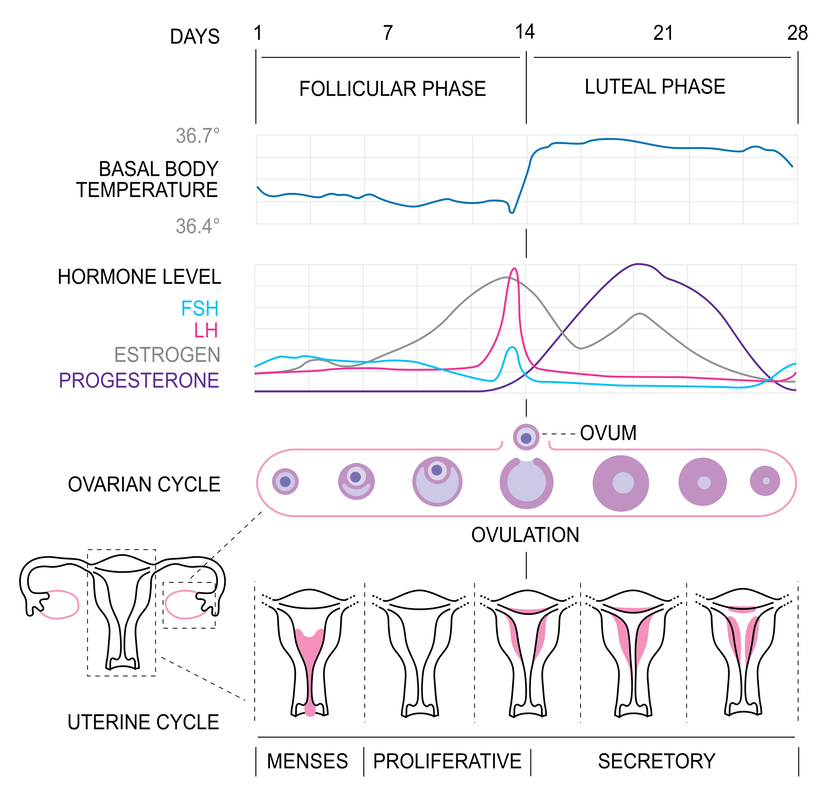
This relationship has been shown in most studies in literature, despite the fact that we do have some inconsistencies (studies showing the opposite relationship or a lack of relationship - we will discuss this in the next section). We can derive the following high level view:
This means that most studies have also shown a consistent increase in heart rate and reduction in HRV across the cycle (different metrics reported in various papers, for example rMSSD and HF, both representative of parasympathetic activity). Older studies limitationsThe great majority of studies looking at HRV and the menstrual cycle collected one single data point during the follicular phase and one single data point during the luteal phase. I don't have to tell you how little sense that makes, considering the high day to day variability in these parameters. However, as we all know, only recently technology allowed for a much easier way to capture data longitudinally, and collecting a single data point was pretty much regular practice in clinical studies up to a few years ago. Why is this a problem? If you have used any app or system to track your HRV, I am sure you are familiar with the high day to day variability, which is why your tool of choice should process data in a way that accounts for such variability to identify periods of significantly higher or lower stress (if this is new to you, learn more here and here). This issue is clearly recognized by the scientists carrying out the research, for example I quote Bai et al. "One possible shortcoming of our study would be that we only examined HRV twice across the menstrual cycle: once during the follicular phase (day 10– 14) and once during the luteal phase (day 20 –24)". Let's see an example: 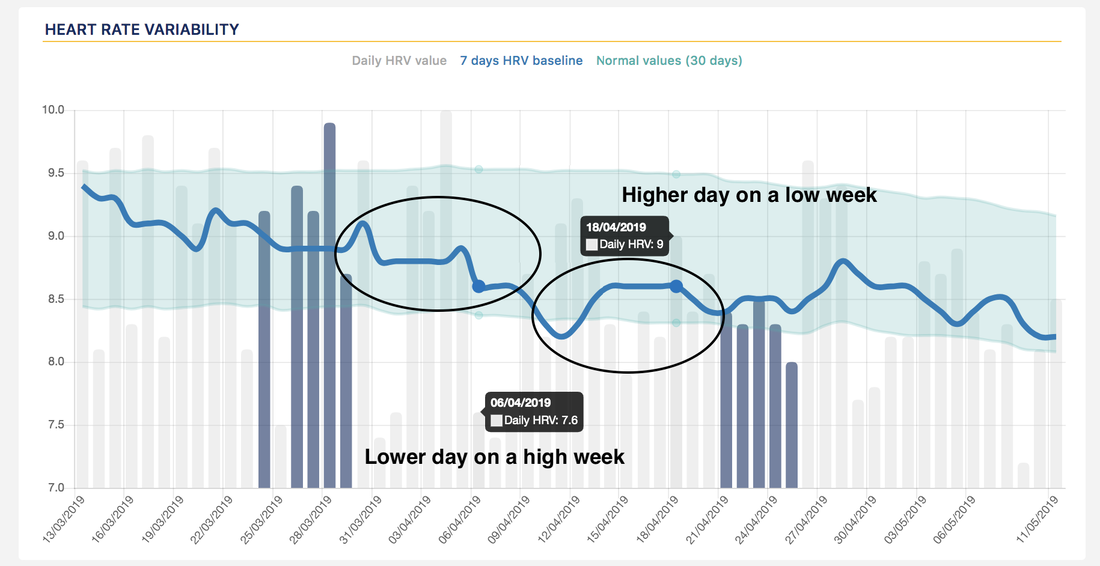 In the figure above we can see how taking a single data point during the two different phases of the cycle could cause the opposite relationship to show up, despite the fact that we have a decrease across the cycle, as reported by most studies in literature. The times are (finally) changingAs we have just shown, most previous studies examining HRV across the menstrual cycle have utilized only two or three data points. Two or three data points are certainly an oversimplification of the menstrual cycle, which exhibits a number of hormonal periodicities, and is in general insufficient to capture any reliable HRV baseline. How often should you measure? Given all that we have discussed so far, including issues such as day to day variability, normal values and the SWC and repeated measures, it should be clear that the more data the better, and measuring daily is best to obtain useful data. On the other hand, a single measurement or a measurement per week, is unlikely to be of any use. Where do these extremes meet? What is the minimum number of measurements per week that we can get away with, when collecting data with athletes that might have some compliance issues? Plews et al. answered these questions in 2013, showing that 3 to 5 recordings are required for an accurate baseline, which is why we settled on 4 in HRV4Training. Obviously, the more the better. Back to the study mentioned at the beginning of this post. Patricia's group (Kokts-Porietis et al. The Effect of the Menstrual Cycle on Daily Measures of Heart Rate Variability in Athletic Women), used HRV4Training to collect data daily and properly analyze the relationship between HRV and menstrual cycle. The results reported in the paper, are consistent with what most literature has shown, quoting the abstract: "daily HRV associated with the parasympathetic nervous system was observed to decrease nonlinearly across the menstrual cycle". The authors report also additional insights on day to day variability during the two phases, something that of course can be investigated only if data is collected daily (this is basically an increase in the coefficient of variation or CV, that we discussed here). Greater variance in the luteal phase according to the authors may relate to different hormonal regulation between phases or the presence of progesterone not experienced in the follicular phase, as these hormones have been shown to have antagonistic effects in the cardiovascular system. How to analyze your own dataI'f you'd like to analyze your own data in the same way, with respect not only to menstrual cycle but also to all other available annotations, you can do so using HRV4Training Pro, our web platform, that you can find here. 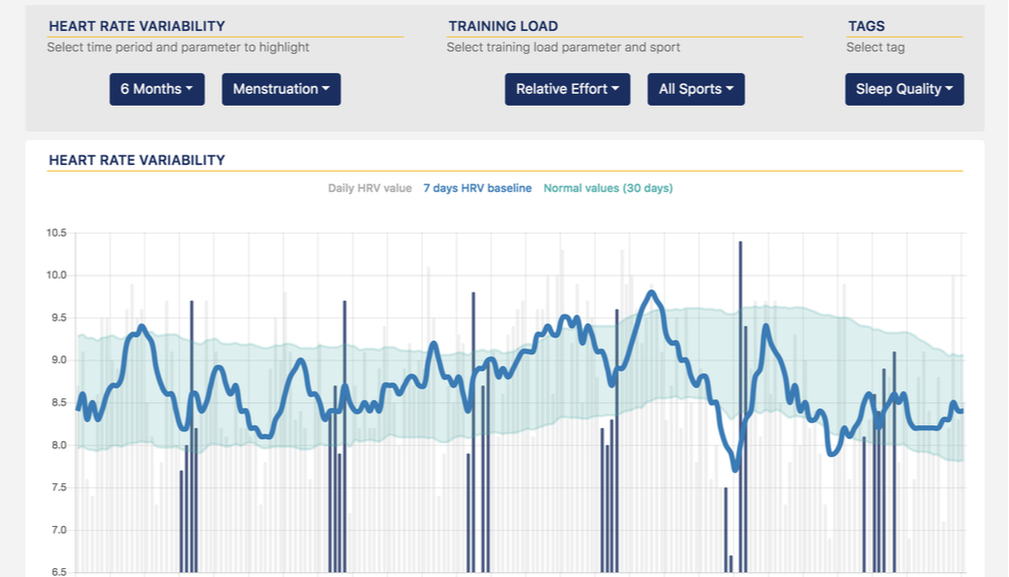 Above you can see a few months of data with annotations corresponding to menstruation days. Note that dips and lower scores during menstruation and reductions during the luteal phase are not always low points at the absolute level, but still lower the current baseline, which might be higher than a month earlier, hence the importance to measure every day and always analyze data with respect to your current baseline and normal values.
Most importantly, remember that no stressor acts in isolation, there’s always something going on with our lifestyle, training, health, and so on - keep this in mind as you look at your data, it can very well be that other stressors have a larger impact. Finally, as you can expect a small cyclical pattern with HRV reducing across the cycle, you can use this information as part of your decision making process. For example, should your HRV being particularly low during the follicular phase (when you are supposed to be more parasympathetic), then it might be a good idea to slow down. I hope you've found the write-up useful, and you can take some good practical insights from the published research. Looking forward to seeing more studies published using HRV4Training as an effective way to collect longitudinal data. Try HRV4Training Pro, here. Comments are closed.
|


Register to the mailing list
and try the HRV4Training app! 
|