|
Blog post by Marco Altini 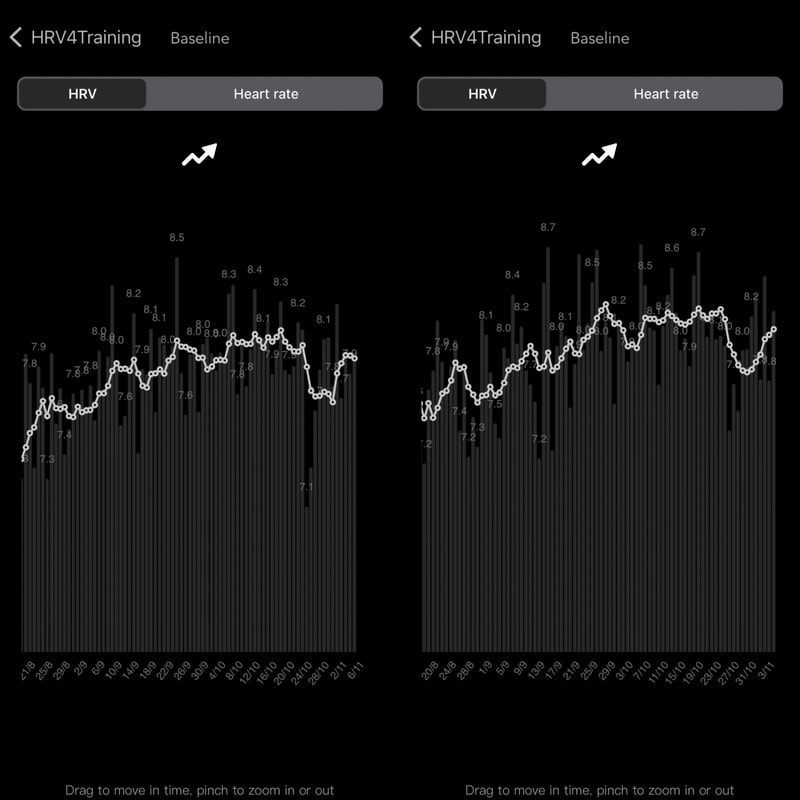 Daily measurements and 7-days moving average for lying down (left) and sitting (right) measurements A few months ago after an interesting chat with an elite team and Andrew Flatt, I started measuring my HRV in the morning while both 1) lying down and 2) sitting. Normally, I have always been measuring while lying down in bed, but Andrew brought up some interesting points which I thought were worth investigating further, at least in my own data. In particular, the reason for doing so, is the following: adding a little stress (e.g. sitting or standing instead of lying down), might better capture your physiological response (or capacity to deal with stress for the day). It's a physiological challenge (more on this later). In terms of the protocol, i would up and measure while lying down in bed, using HRV4Training (phone camera for one minute). At that point, I would sit, and after a few seconds, I'd measure also while sitting (another minute with the camera). Between measurement, the time would be rather short, something like 30 seconds. Let's look at the data. First of all, I'd like to stress how simple measures of agreement might be inadequate, e.g. correlation (often reported) does not tell us anything about deviations from normality. 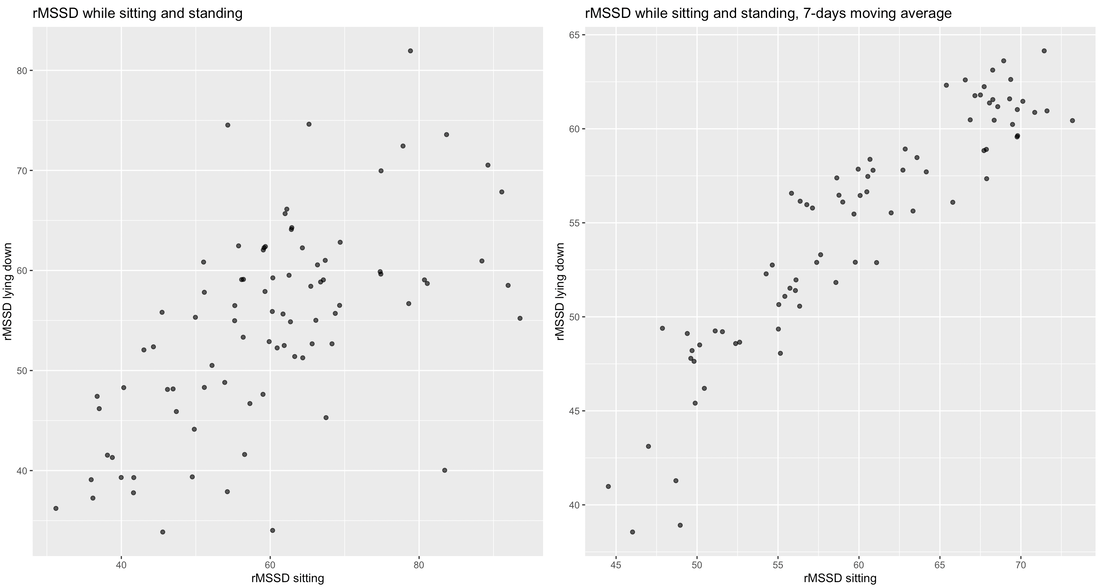 Correlation between daily measurements (left) and 7-days moving averages (right) for lying down and sitting data While we can have a look at day-to-day correlation and baseline correlations, as shown above, a better way to understand if we are capturing the same information is to use the data the way it should be used for decision making: monitoring deviations from our historical data and normal values (acute drops, etc.). How do we do that? We can use part of the data to compute the normal values (40-60 days), then look at baseline and acute drops. Here both measures show very similar responses: highly suppressed HRV on the same days, baseline reaching the bottom of the normal range the same period, etc. - it is quite clear that both lying down and sitting are capturing the same trends (which would result in the same advice, especially for acute drops and baseline changes, the two key factors in HRV-guided training): 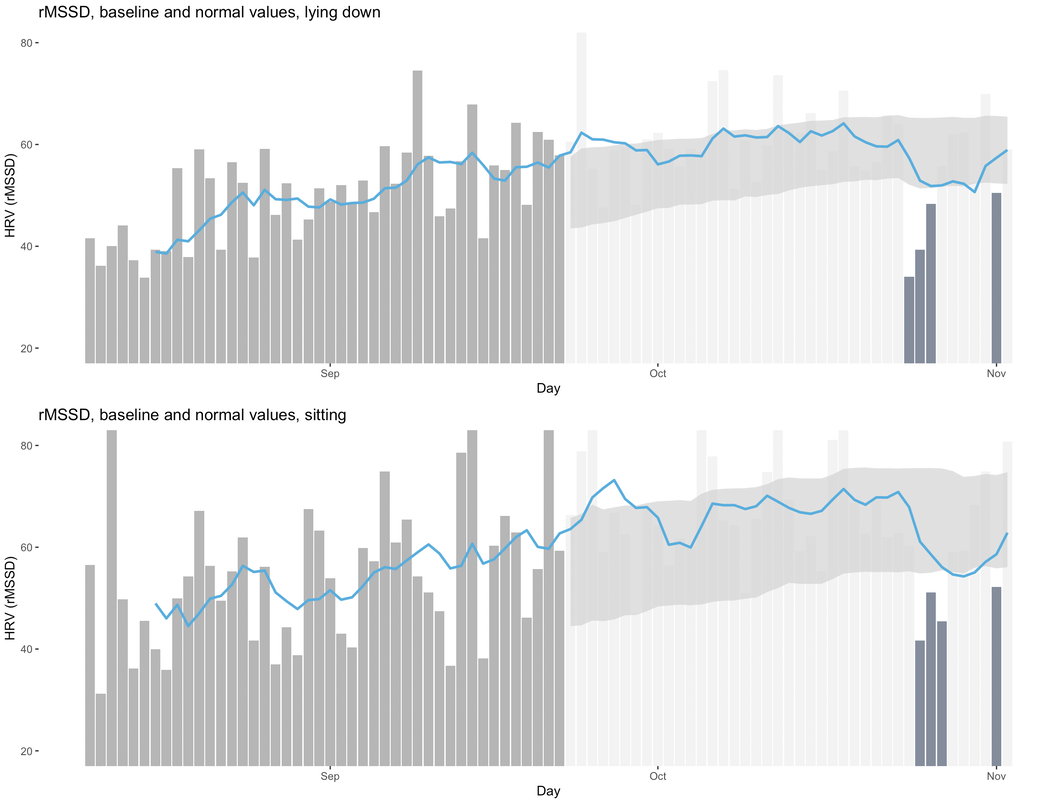 To sum up: in my data, both measures are very similar, especially in the longer term (baseline correlation) as well as in terms of acute drops (single days below the normal range, highlighted in blue in the previous image). What differed? Lying down seems like a squeezed version of sitting. Paraphrasing Andrew, applying a little stress (e.g. sitting) might better uncover the physiological response response, and this in turn, might explain the higher day to day variability when sitting. Note that this doesn't mean HRV will be lower (quite the contrary). Anecdotally I've heard from quite a few people that "when switching to night data, my physiology never changes" (unless sick, or drinking too much, e.g. very large stressors) Do measurements while lying down, and in particular night measurements simply lead to less day-to-day variability or is this associated to the measurement being less responsive to stressors, due to lack of a physiological challenge? In my opinion, both positions are valid and rather similar, as shown by the data here. While some have quite a dogmatic approach ("never measure in this or that position"), it is clear that the same processes are captured. However, there are also differences, and it is important to think it through and consider potential mechanisms and what could be best in an individual case. Most likely, the level of the athlete, baseline HRV (e.g. on the low vs high side of population values), type of sport practiced by the athlete (e.g. endurance or not), as well as other factors such as the application of interest (daily guidance or monitoring long term trends, performance or health oriented) and practical considerations (what modality makes it easier for the athlete to collect daily measurements consistently) should play a role in this decision. One minute of your time might be worth the insights after all. I hope you have found this blog useful, feel free to follow up here on Twitter.  Lying down (left) and sitting (right), including HRV4Training's detected trend
Comments are closed.
|


Register to the mailing list
and try the HRV4Training app! 
|