|
Blog post by Marco Altini One of the most interesting ways to analyze heart rate variability (HRV) data is to look at the amount of day-to-day variability in your HRV scores. That's what we call the Coefficient of Variation (CV HRV) The CV HRV is different from your baseline, which is simply the average of your scores over a week. In simple terms, the CV HRV reflects how much your scores jump around on a day to day basis.
 Why do we care?Normally, the most important aspect to analyze is how your baseline is going with respect to your normal values. A baseline within normal values shows a stable physiological condition and good adaptation (check out this blog for more information about the normal range) 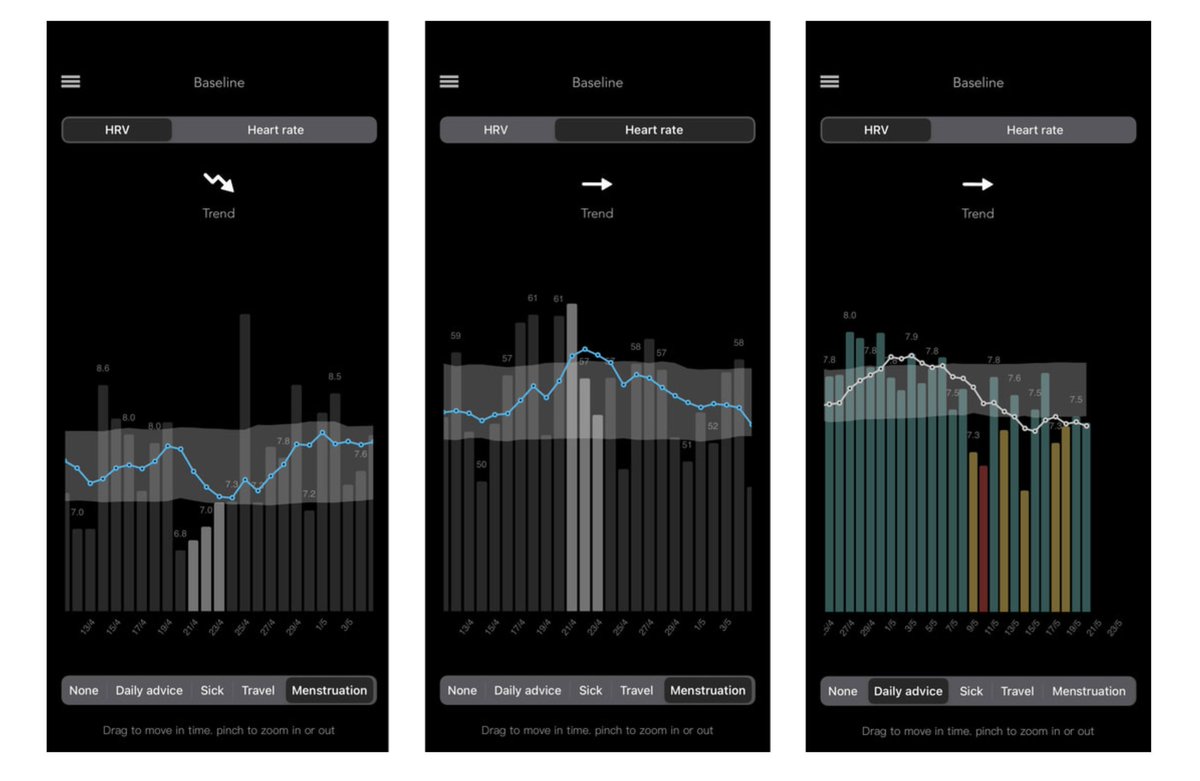 However, the amount of day to day variability (the CV HRV), combined with baseline changes with respect to normal values, can provide additional insights on adaptation to training and other stressors. The CV HRV can flag issues in response to stress, before a baseline reduction. Quoting Andrew Flatt ”the preservation of autonomic activity and less fluctuations (reduced CV HRV) seem to reflect a positive coping response ... In fact, individuals who demonstrated the lowest CV HRV during increased load showed the most favorable changes in performance" A reduced CV HRV is often associated with coping well with training. This means also that larger fluctuations in CV HRV are signs of poor adaptation and might reflect issues in maintaining homeostatic control. How do you use the CV HRV?Let's look at one example. I've discussed before how "work stress" is what drives changes in HRV for me (that's where I need to "perform"). Below you can see two similarly stable HRV trends (in the boxes), as well as my increasing subjective stress. What about the CV HRV? Was it capturing anything differently? 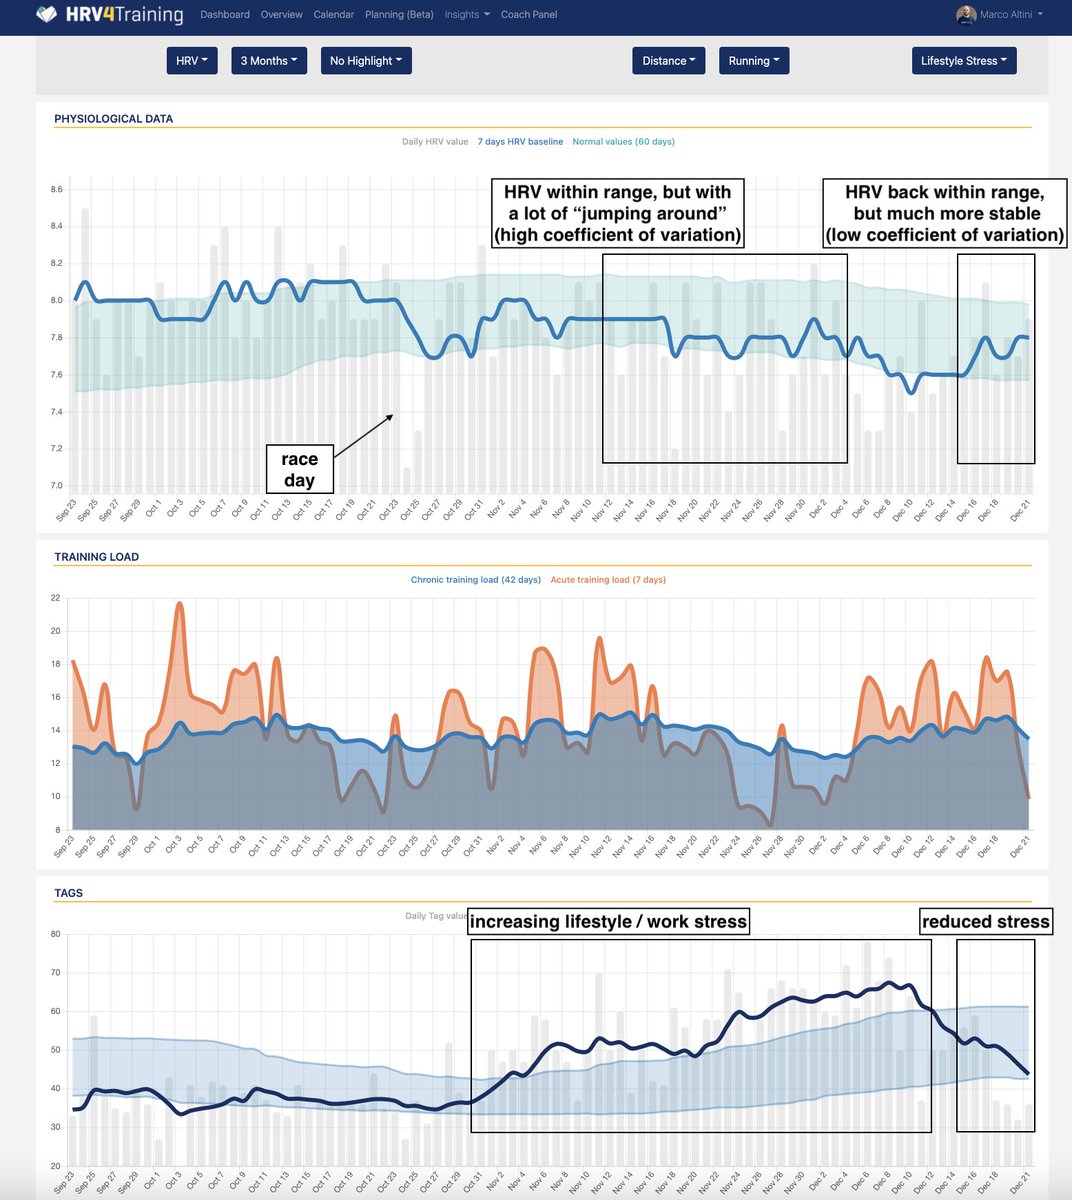 Let's look at the data. We can see how the HRV response to increased stress was still within my normal range but included a lot of jumping around (high CV), which represents a poor response, eventually leading to suppressed HRV. Only reducing the stressor finally caused a rebound to normal. 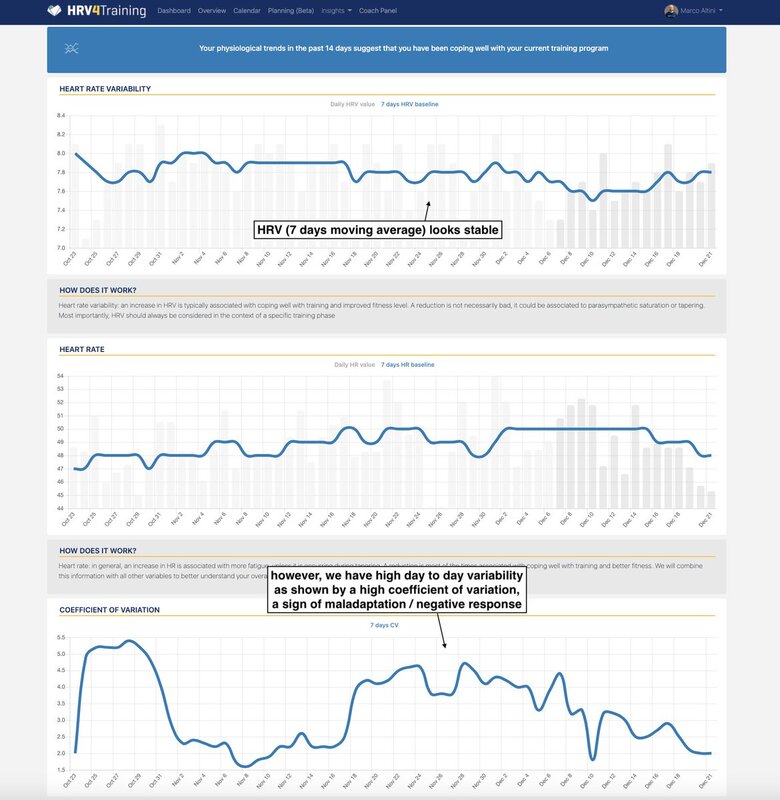 The CV HRV had captured very well the poor response. Learning what drives big changes in stress is probably the first step to do something about it, whenever it's possible. Short recapIdeally, in the medium term, these are good trends we should hope to see if we are responding well to the various stressors in our lives:
Pay attention to deviations from these trends to spot potential issues in advance, which is easy to do in the HRV4Training app. You can learn more about trends in resting physiology, in this blog post. I hope you have found this blog informative! Comments are closed.
|


Register to the mailing list
and try the HRV4Training app! 
|