|
As part of our "big picture" posts, today we cover the relationship between HRV and training load. In particular, this post is inspired by a recent study by Flatt and Howells, that you can find on Andrew's blog here. This is an important topic as it can be a little confusing to the ones approaching HRV measurements and trying to better understand physiological stress in response to training and lifestyle.  The view that training should cause a dip in HRV is somewhat simplistic in my opinion. HRV is a measure of physiological stress, and periods of higher cumulative stress are typically highlighted by a reduction in HRV, but acute (day to day) changes are hardly simply linked to TSS or training intensity, let alone the fact that in a situation of positive adaptation to training, your HRV should increase (or at least be stable) when consistently increasing training load (more on this later). So what is the relation between HRV and training load? Do we expect HRV to decrease after hard efforts? How does this relationship change when we look at elite athletes, with respect to the rest of us? Study findingsThe authors started with the following hypothesis, as Andrew wrote in his blog: "Based on previous studies, we’d expect the weekly LnRMSSD mean (LnRMSSDm) to decrease and the coefficient of variation (LnRMSSDcv) to increase relative to baseline. We’ve observed this in collegiate soccer players and sprint-swimmers." - however, this is not what they found. In untrained and recreational athletes, day to day changes in HRV reflect training load quite well, on average, as we have described and published in the past. However, as we become more fit and more used to training stressors, our ability to cope with them changes, and our physiological responses change accordingly. This means we expect less acute drops. The extreme case here is elite athletes, which are used to high levels of volume and intensity, most likely already for years, and therefore physiological responses at the acute level are often less interesting, which is why baseline changes with respect to normal values should be analyzed instead, so that periods of higher stress or good adaptation can be captured, and changes can be made when necessary. This is also what happened in the study mentioned above, as the players showed no change in HRV throughout two weeks of intensified training load. Even the CV, a measure of how well we are adapting to training, with lower values typically meaning better adaptation (HRV is not jumping around as much on a day to day basis), increased during the first few days, but then went back down while load kept increasing. These are changes normally associated with reduced load, so what happened here? As Andrew states "The discrepancy here appears to be related to how players are tolerating and adapting to the training load. We often assume that increased loads will result in fatigue accumulation and temporary negative responses. However, these elite players demonstrated no reductions in subjective indicators of recovery status during the weeks of increased load. Additionally, there was no significant decrement in running performance (maximum aerobic speed) mid-way through the intensified microcycles. Thus, the preservation of autonomic activity (no change in LnRMSSDm) and less fluctuations (reduced LnRMSSDcv) seem to reflect a postive coping response to the training. In fact, individuals who demonstrated the lowest LnRMSSDcv during week 1 of increased load showed the most favorable changes in running performance (r = -0.74)." 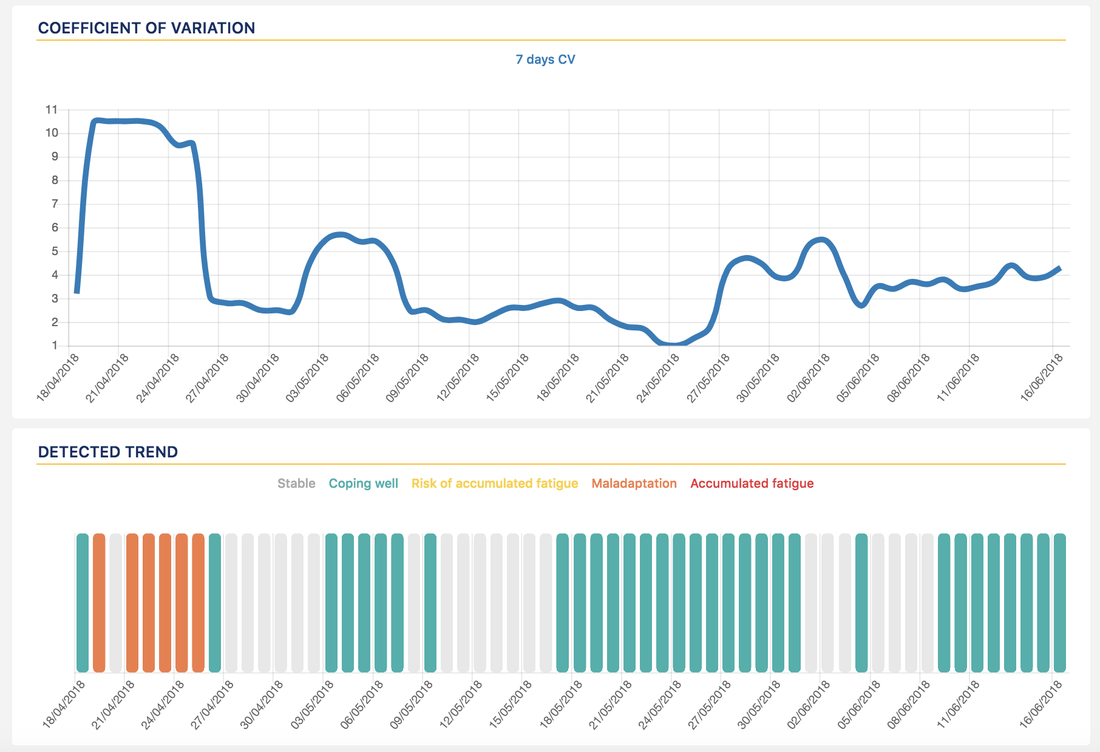 CV and detected trend in HRV4Training Pro. How are you coping with your training load?What we can derive from this study, similarly also to what was shown in the recent study by Javaloyes and co-authors (covered here), is that a reduced CV is often associated with coping well with training, and the relation we expect to see is not between training load and HRV, but between HRV and adaptation, which is why these metrics are so important. After all if all HRV was telling us was the intensity of our workout, there would be no need to measure it, but what we are measuring is how we are responding to that workout or block of workouts, with certain trends (stable or upwards HRV, reduced CV) being indicative of good adaptation, even in periods of very high load. This means also that the opposite trends, reductions in HRV or larger fluctuations in CV are signs of poor adaptation and should trigger changes in training. To learn more about these aspects, check out two of our recent blog posts, one on the big picture, and one on how to use HRV to guide training. This is in line also with what Dan Plews argues in his analysis of HRV data pre-ironman, that you can find here. If you are into podcasts, we discuss some of these aspects at the Scientific Triathlon podcast. While acute changes are informative and can help us make small adjustments following a bad night of sleep, a particularly hard workout, or early sign of sickness, what you should be focusing on is certainly the big picture, aiming for your HRV to be within normal range, and making adjustment aiming at prioritizing recovery should your HRV baseline go below normal values, so that performance can be optimized in the long term, as shown in multiple studies. 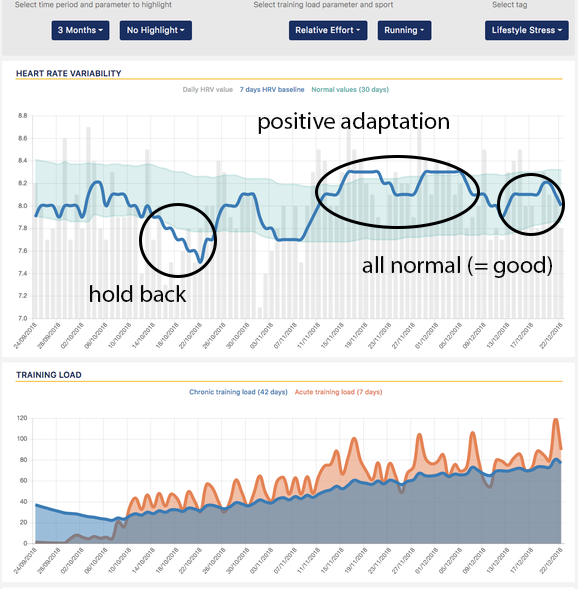 Comments are closed.
|


Register to the mailing list
and try the HRV4Training app! 
|