|
Blog post by Marco Altini The aim of this post is to assess the ability of the PulseOn wristband in measuring heart rate variability (HRV) at the wrist. We previously wrote another summary of different PPG devices (most sensors that are not chest straps) to determine if they could be used for HRV analysis, you can find the blog post here as well as the data and code on Github here. As I've explained elsewhere, while there many PPG sensors right now, we cannot use most of them because they either do not comply to standard Bluetooth heart rate profiles or do not provide any standard HRV feature. The PulseOn wristband stands out for a couple of reasons: 1) the company implemented the standard bluetooth low energy heart rate profile, therefore allowing any app to communicate with the sensor pretty much like a Polar H7 would do 2) the company put also some effort in providing reliable beat to beat data and not only averaged heart rate as output. I've been in contact with Ilkka Korhonen, CTO & founder of the company, for a few years as we worked on similar topics during my PhD. Ilkka sent me some additional white papers showing pretty good agreement between RR intervals at rest for the PulseOn and ECG, and therefore this seemed a viable option for our users. Note that the average HRV4Training user typically has higher HRV than the average person, hence it is important to spend some time collecting data for relatively higher rMSSD values, to make sure these bigger variations can be accurately captured. Hence, I grabbed one on Amazon and ran a similar analysis to the one we've documented previously. In particular, in this post we compare the following sensors:
This post does not aim to be a comprehensive validation, however a small dataset collected under the proper conditions can be sufficient to understand if a device can do the job or not. If a device works well, then additional measurements would be a good idea, to make sure a broader range of values and individuals result in the same outcome, as we did last spring when we validated HRV4Training algorithms at the Sports Performance Research Institute in New Zealand. Data acquisition setup & measurement protocolData was acquired using the sensors mentioned above all connected to a different phone running the HRV Logger app, which is an app that simply records everything coming from the sensor plus additional features. Polar data and HRV4Training PPG data were acquired using a custom app that I developed for our clinical validations at the Sports Performance Research Institute in New Zealand. This app is not commercially available and can record simultaneously data from the two sensing devices, making it easier to synchronize data. During data acquisition, we collected data a few minutes while breathing freely, and a few minutes while deep breathing, to elicitate higher HRV due to RSA. You will see in the plots below visually the effect of deeper breathing as we get greater swings in RR intervals. The recording used in the analysis below is about 25 minutes of continuous measurement while lying down. A final note on data synchronization: data cannot be perfectly synchronized because it is not timestamped by the sensors. What we can do is either to log real time and then to split data in windows based on when data was collected, then compute HRV features on these windows or to sum up RR intervals over time. For this analysis we went with the first option, meaning that for each minute we grouped all RR intervals coming from a sensor and used that data to compute HRV (rMSSD). We will see below there is typically less data coming from PPG sensors as they have to deal with more artifacts and some data is often discarded. 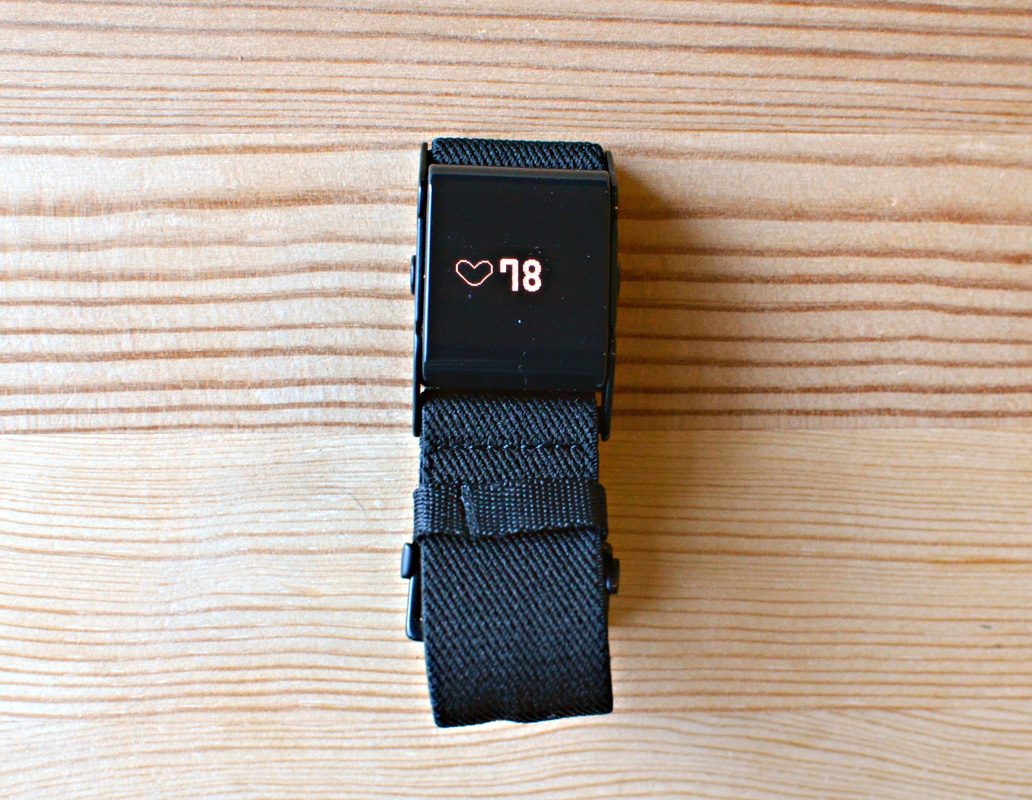 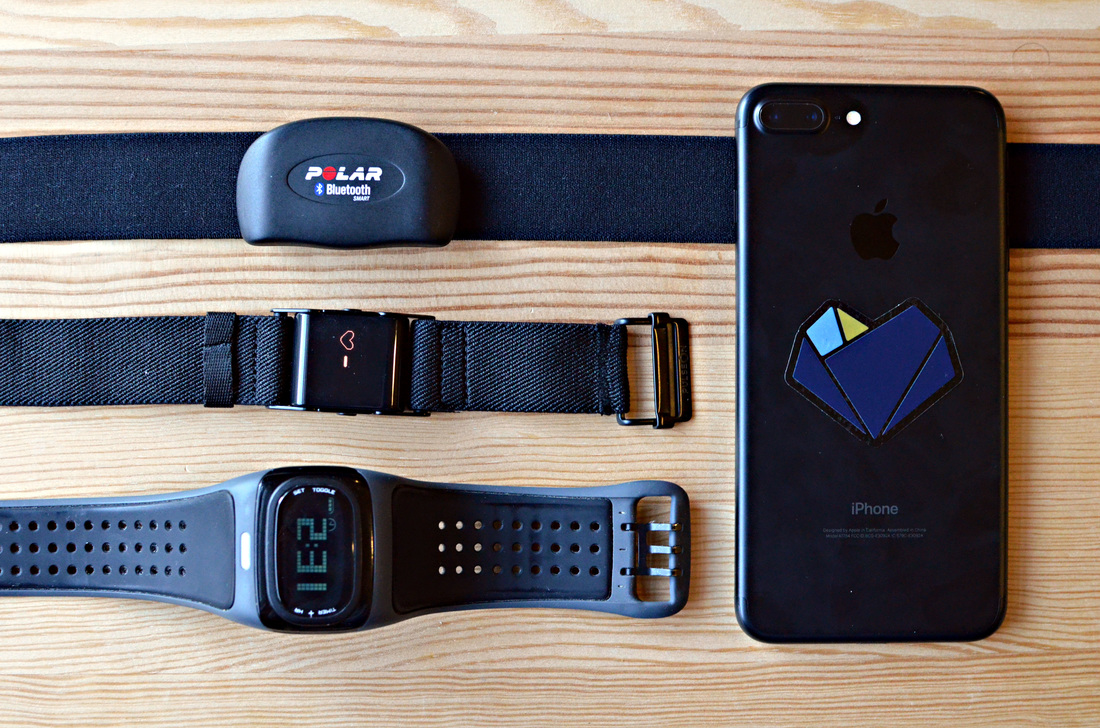 Data analysisRR intervalsWe will start by looking at RR intervals, the basic unit we need to compute HRV features. RR intervals (peak to peak differences in consecutive heart beats) are provided by all these sensors, so we don't really need to do much to collect them, apart from linking the sensor to the HRV Logger app. For the camera based algorithms, RR intervals are also computed directly in the app and can be exported as csv files (you can do this using the Camera HRV app - which we are happy to provide for free to all HRV4Training users, just email us -, in HRV4Training we do not store RR intervals but only features). 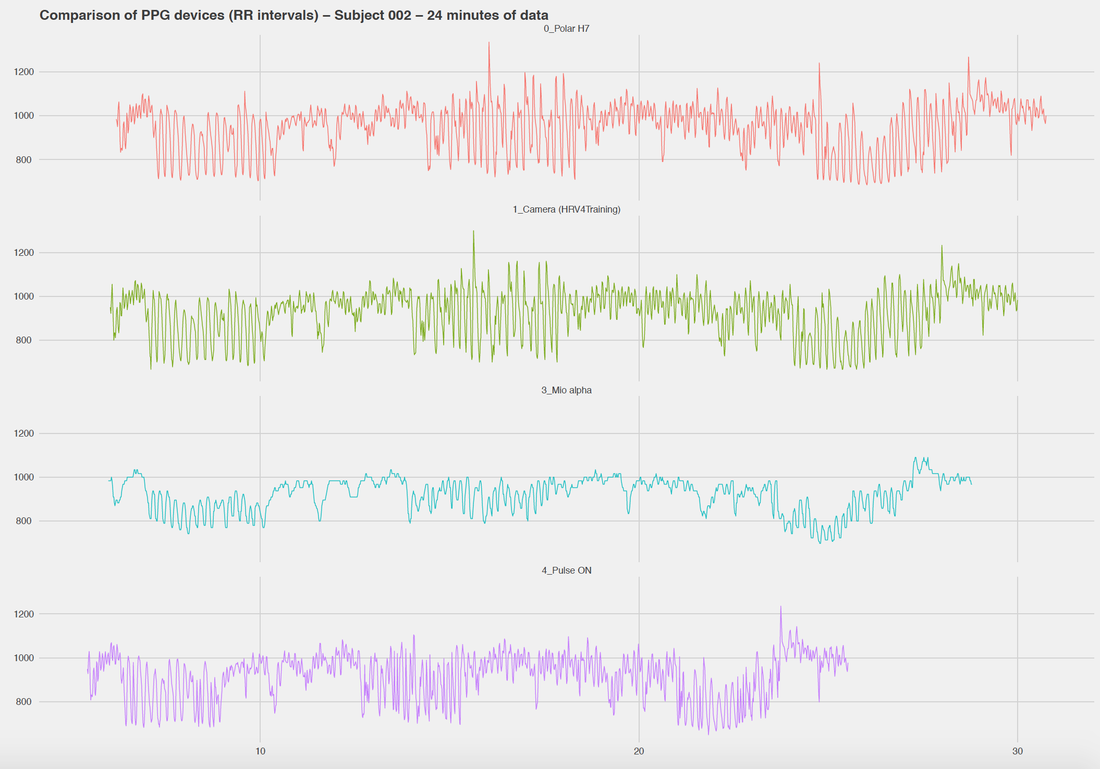 What can we derive from these data? You can see clearly three periods of deeper breathing with greater swings in RR intervals. As reported several times, and included once again here just for comparison, the Mio alpha heavily filters the signal and as a result we have an almost flat RR intervals time series. This means these devices cannot be used for HRV analysis as they would provide extremely low values artificially (we will see later the actual HRV data). Note that this sensor can still be used reliably for heart rate tracking, just not for HRV, as it was developed with a different application in mind (i.e. measuring HR from the wrist reliably during physical exercise, which is still something problematic for many sensors). On the other hand, we see almost perfect correlation between Polar H7 and HRV4Training for all conditions (first two rows), while we see that the PulseOn sensors performs much better than the mio alpha, but quite some data seems to be missing. We can see swings in RR intervals close to what is reported by Polar and HRV4Training camera based algorithms, highlighting much less / no filtering, however the parts of the signal where we have greater variability seem to be problematic to capture accurately. We will see later what is the impact of this on HRV (rMSSD). In the figure above we plotted data incrementally, not when it was received (challenges of not having properly timestamped data). We can also plot timestamped data based on when RR intervals are received, this method will give data a weird look as these are not the times in which the events happened (RR intervals are detected) but are the times in which packets are received from the Bluetooth radio. The point of this plot is simply to show that all sensors obviously sent data for the entire recording, and the fact that we have less data for some sensors, is because here and there samples are missing: 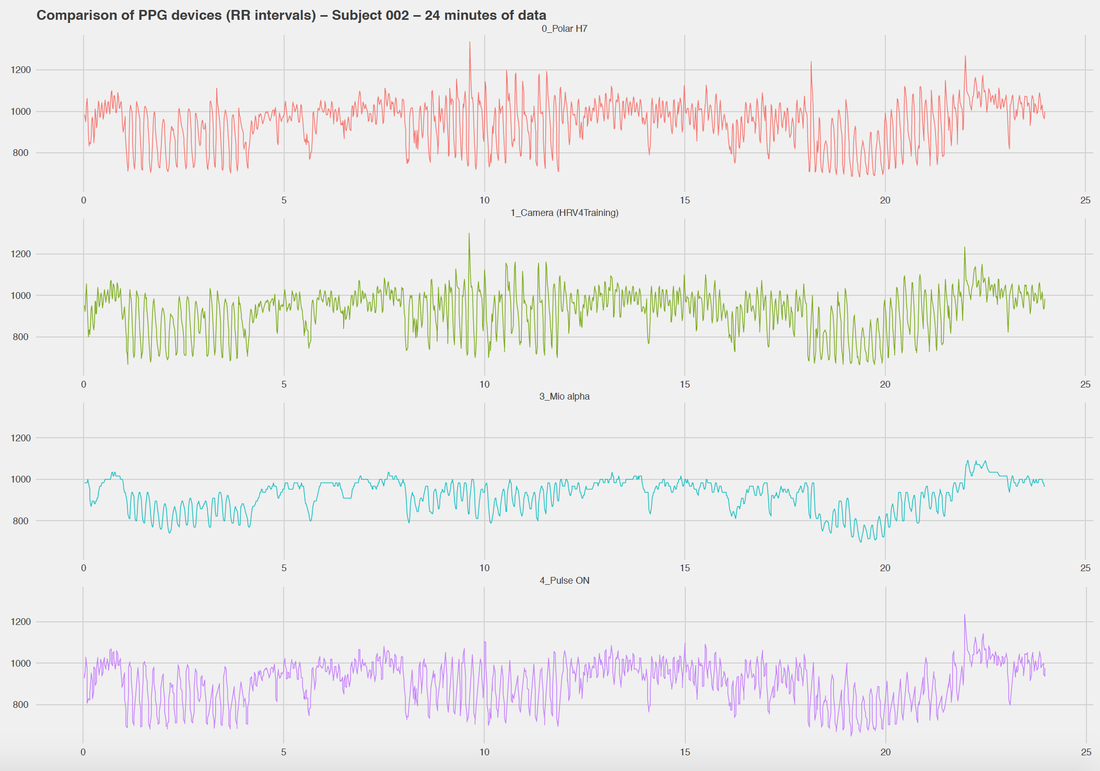 To compute HRV features, we need to align the streams regardless of missing data and lack of timestamps. As mentioned above, what we do is to group all RR intervals received in a given minute, and use those to compute HRV. To highlight this technique, below we plotted each data stream split in 1 minute windows which clearly represent the same segments of data (i.e. they were acquired at the same moment from all sensors), as you can see the signal shapes are highly correlated for periods of different color-coded 1 minute windows: 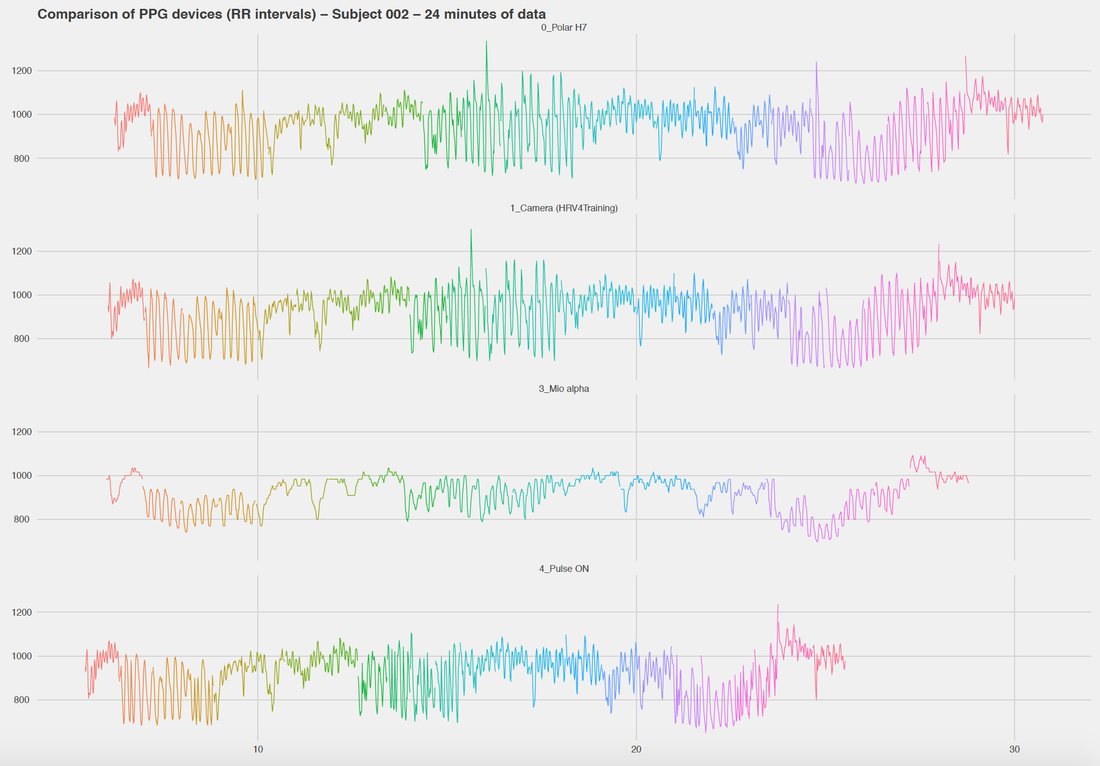 This is our input for HRV analysis. HRV features (rMSSD)As features, we will look only at rMSSD, the only feature we really care about. rMSSD is a clear marker of parasympathetic activity and the main feature we use for our analysis in HRV4Training, similarly to what other apps do as well. Additionally, the sports science community seems to have settled on this feature for several reasons (practical as well as it is easy to acquire, compute and reliable over short time windows and less controlled conditions), and therefore we'll stick to it. First we can look at rMSSD values for 1 minute windows over the entire recording. As expected the mio alpha reports much lower variability, while the other sensors behave similarly, even though the PulseOn covers a smaller range: 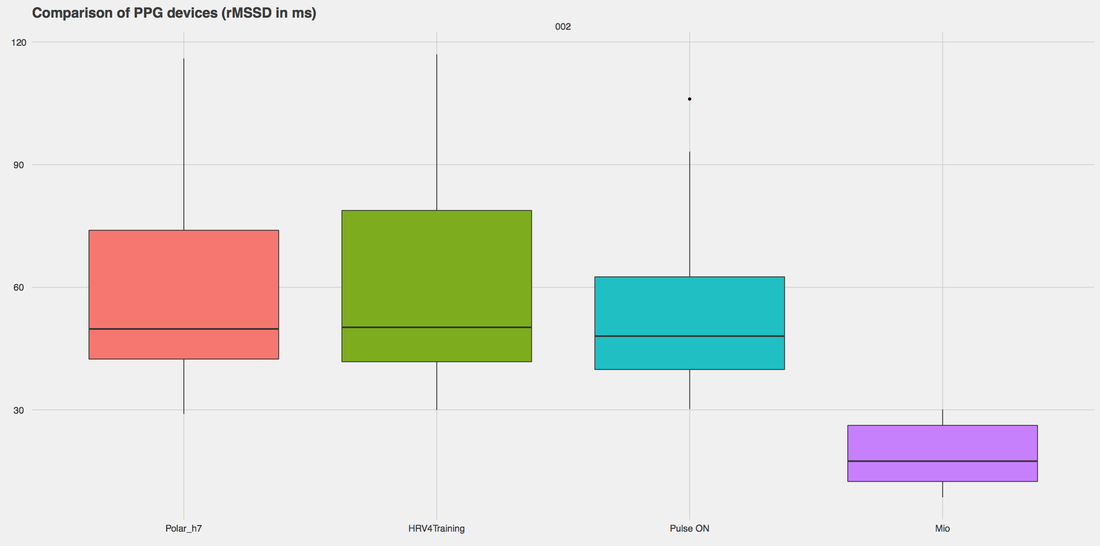 The plot above does not tell us much about what happens on a minute by minute basis, and if there are specific issues with for example with chunks of data with higher heart rate variability, which seems to be one of the main challenges of other PPG systems compared in the past. Let's now look at minute by minute data over the entire 25 minutes recording: 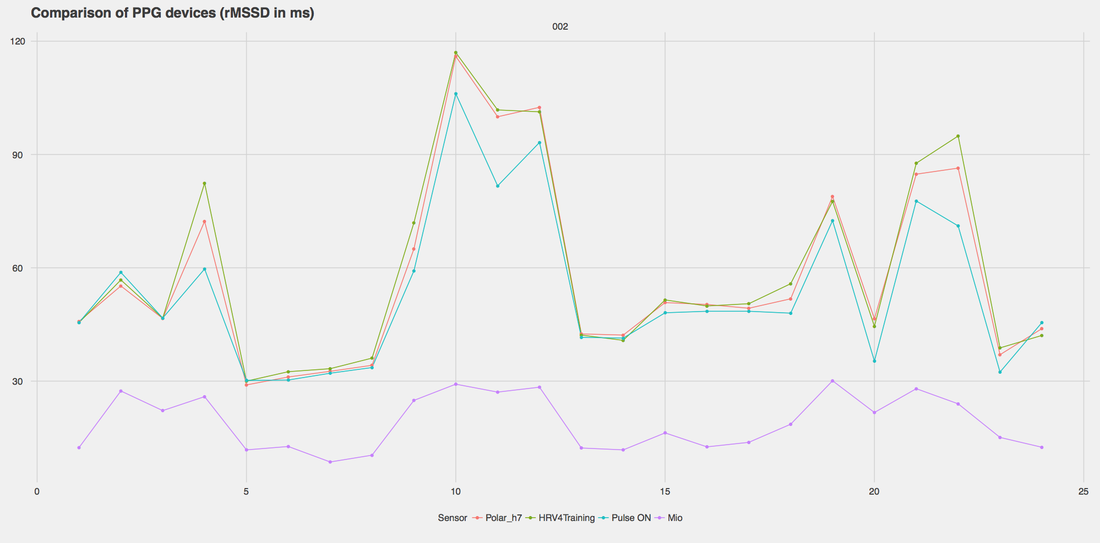 In the plot above we can see Polar H7 and HRV4Training camera based algorithms being very close over all windows, and the PulseOn behaving very well on many time windows where rMSSD values are in the 30-80ms range, while possibly underestimating HRV for higher (~100 ms rMSSD) values. TakeawaysIn this post we looked at the PulseOn wristband ability to capture RR intervals and compared HRV (rMSSD) as derived from this sensor with Polar H7 data. The PulseOn is the best wristband we tested so far, it does not filter heavily RR intervals, and seems reliable when measuring at rest, at least for a certain range of rMSSD values. However, we also encountered some issues for higher HRV values, in particular rMSSD values above the 80-100ms range. While I would not normally consider this limited sample of data sufficient to label this sensor "not good enough" for HRV analysis, there are a couple of consistent issues that make me think there are actual limitations and this was not just bad luck of this specific measurement. For example, RR interval timeseries show problems during periods with bigger oscillations, which consistently result in lower HRV being detected as well as much missing data. The cumulative timeseries plotted above shows almost 25% of data missing, which is not a good sign and highlights a potential inability of the current sensor hardware/firmware to deal with such higher oscillations.
For now, as HRV4Training users tend to have higher rMSSD values compared to the average person, it might be that our user base is a bit borderline for the PulseOn sensor, and I would still recommend using either a chest strap or the camera based algorithms we developed and validated over a broader range of rMSSD. If you come across another sensor that complies to the bluetooth low energy heart rate protocol and sends RR intervals, let us know and we might be able to add it to this analysis. I hope this post provides some clarity on some of the devices out there as well as on the limitations around many other sensors that cannot be tested simply because they do not comply to standard protocols or do not compute standard features (e.g. Fitbit, Garmin, Whoop, etc.). Ilkka tells me the second generation of the PulseOn wristband is in the works, and hopefully some of the issues that came up with this analysis will be resolved.
2 Comments
Ricardo Moisés Rodriguez Oceda
5/9/2017 03:21:10 pm
I found this comparison really helpful, Your comment will be posted after it is approved.
Leave a Reply. |


Register to the mailing list
and try the HRV4Training app! 
|