|
Blog post by Marco Altini
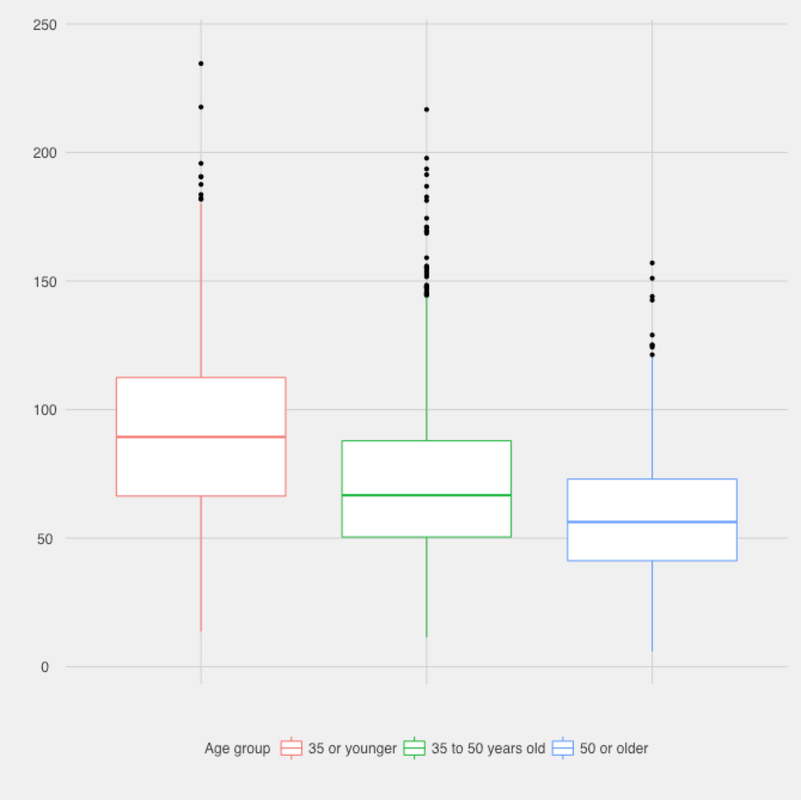
What are population values and what can we use them for?For many parameters we are often dealing with, such as body weight, temperature, blood pressure, we typically have in mind some range reference values that are supposedly normal or indicative of a good health condition. For example, a healthy heart rate is somewhat between 40 and 80 beats per minute, systolic and diastolic blood pressure should be around 90-120 and 60-80 respectively, etc. Typically, we know these values because they were derived from some sample of the population in past epidemiological research. Simply put, population (or normal) values are summary statistics from a big number of people (our sample). If we collect data properly, they will be representative of the values in our population of interest. However, a simple average HRV of the entire population might not be the most insightful summary to look at (as it isn't for blood pressure or heart rate either). What we can do to get a bit more insightful data, is to start stratifying and creating subsets of the population with different characteristics (e.g. age, gender, etc.) and try to understand what factors influence HRV, and what are population values for people similar to us. Unfortunately, when it comes to HRV and normal values, things get a bit difficult to extrapolate. This is due to many reasons, one being that there is no single HRV number, and therefore before we start talking about normal values we should be talking about what feature we want to consider and why. Secondly, the protocol used to acquire HRV data differs between studies, with supine tests, tilt tests, nocturnal HRV recordings, all frequently used. Finally, acquiring HRV data was not that easy until a couple of years ago, therefore making it difficult just to acquire representative data on a decent amount of people. Do normal values matter?In the context of HRV analysis, we always stress the importance of looking at your own baseline and monitor deviations from the baseline. Our baseline HRV is probably affected by some factors that we cannot easily measure (genetics, for example, as reported once again recently), other factors that change but we have no control on (e.g. age), and factors we can probably influence (lifestyle). Hence, we highly recommend to focus only on relative changes, which is the most powerful way to make sense of your data, as shown in these articles:  An example of how to use HRV data and analyze relative changes over time in response to training and lifestyle stressors. The dataDespite the fact that we highly recommend focusing on relative changes over time, in this post we provide an overview of normal values, which we advise using only to satisfy your curiosity. In particular, we will be looking at HR and rMSSD data. Most of the data was acquired using 60 seconds measurements in the morning. We will be looking only at macro differences (e.g. very big age groups), because otherwise we end up with a sample which is just too small to derive any meaningful conclusion. HR, HRV and ageAge is an interesting parameter as it is probably the single factor that can explain most of the variation in HRV data (among the ones we gather). On the contrary, there seem to be no strong link between heart rate and age. Our data confirms clearly what is know from literature, as shown below. rMSSD and age
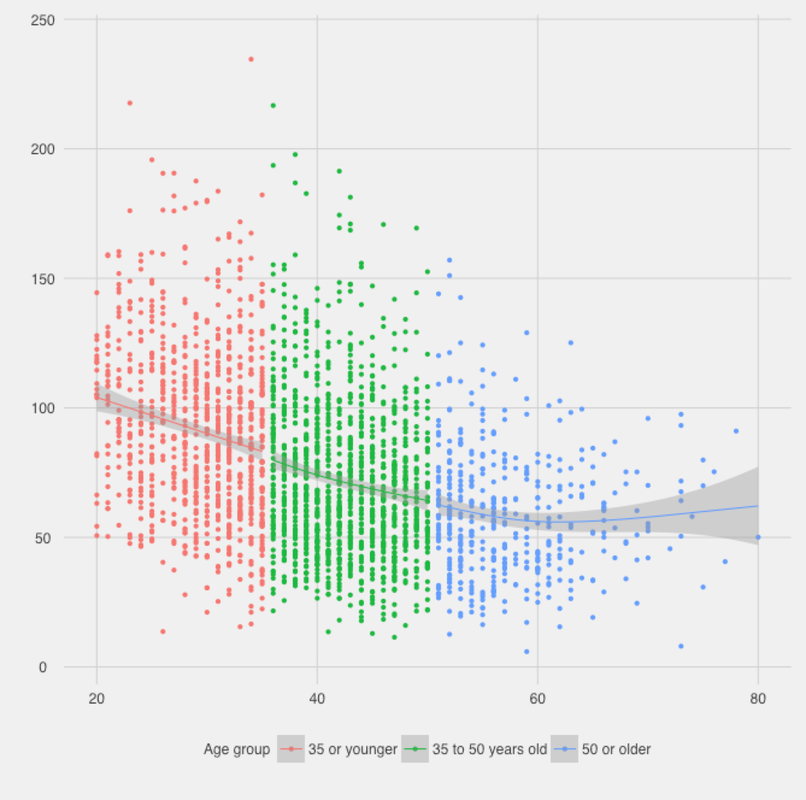
rMSSD reduction with age. Entire dataset on the left, clustered by age group on the right. HR and age
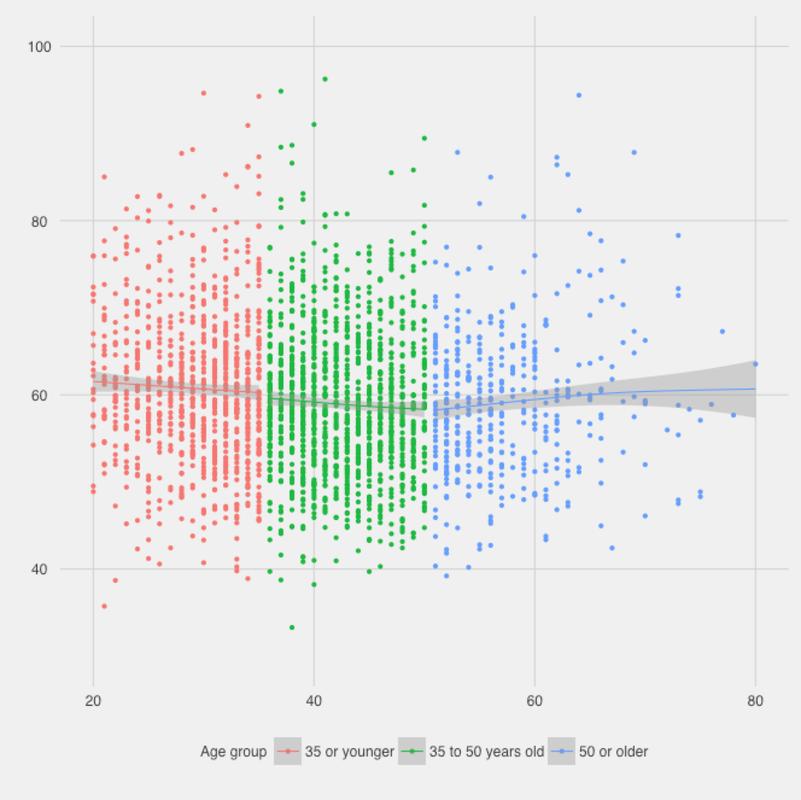
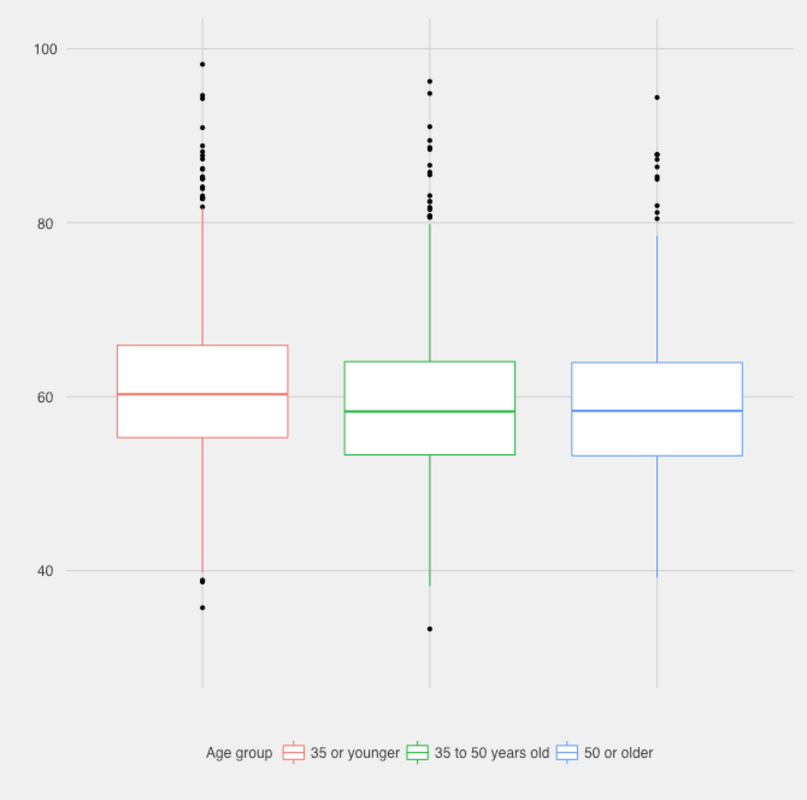
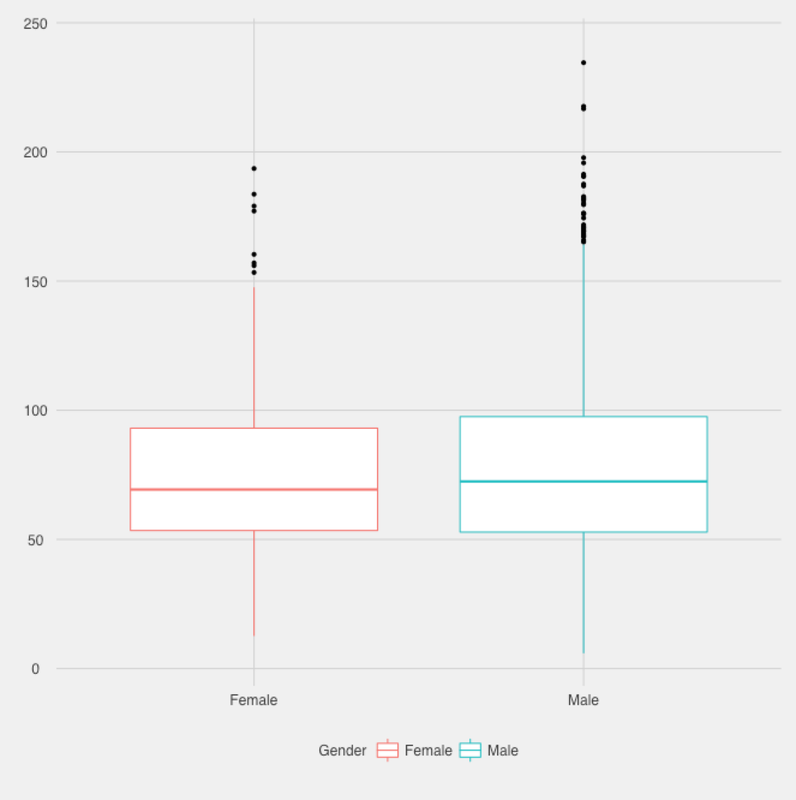
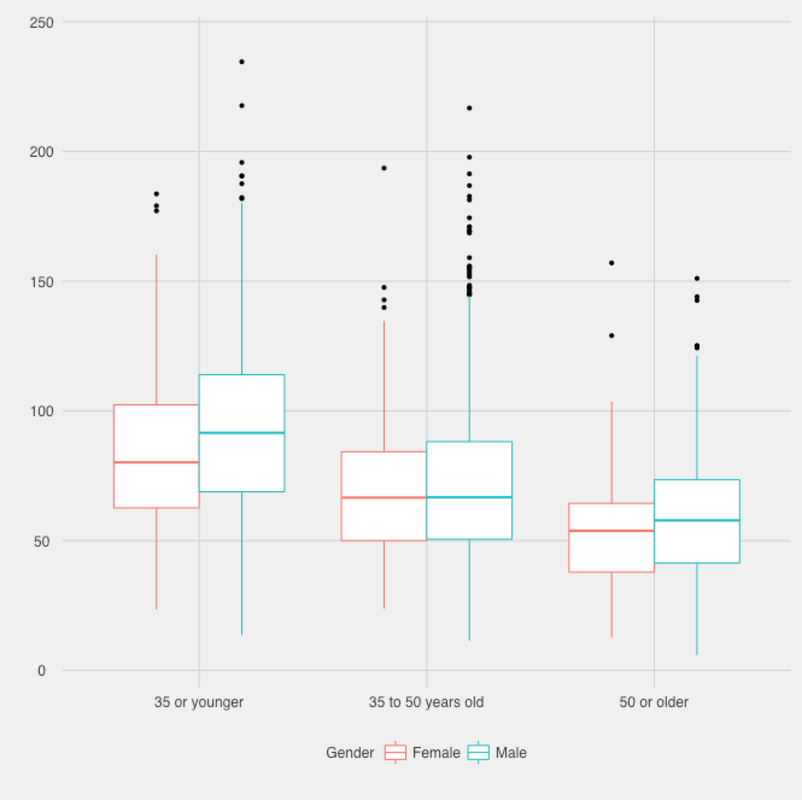
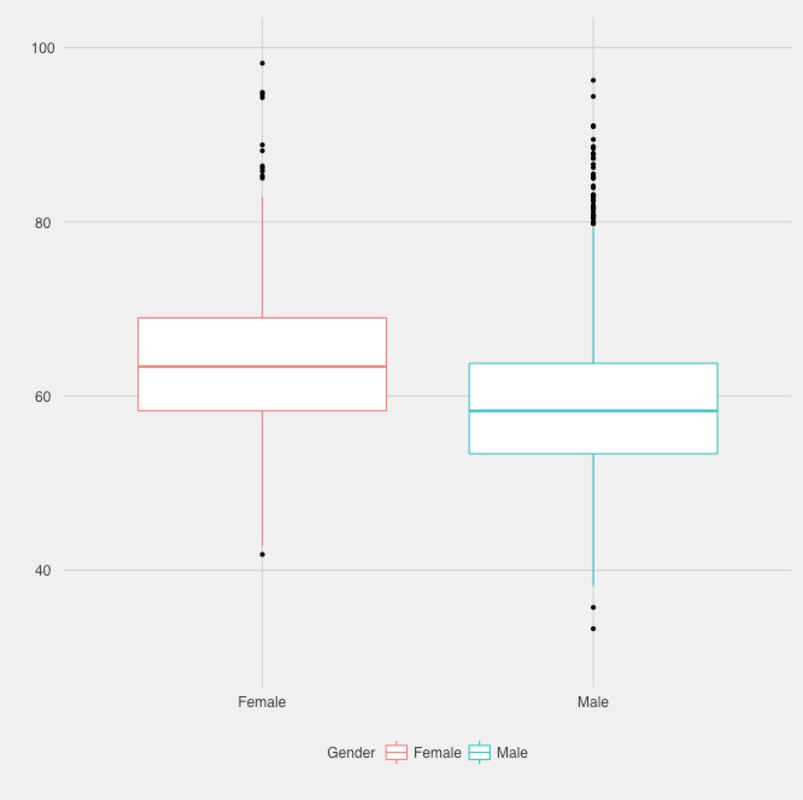
HR & age, no clear link. Entire dataset on the left, clustered by age group on the right. HR, HRV and genderThe relation between physiological parameters and gender seems to be less obvious. In the context of HRV, studies have been inconclusive and most likely other confounding factors played a role. In our data, similarly to what we reported in the past, there are no consistent differences between men and women for rMSSD data. However, we do have a difference in HR, which shows up consistently across age groups. As we gather more data it could be interesting to try to explore what other parameters might be explaining this difference. Here are the data for HR and rMSSD, first across all users and then by age group. Apologies for the stereotyped colors, they were the default in ggplot/R. rMSSD, age and gender
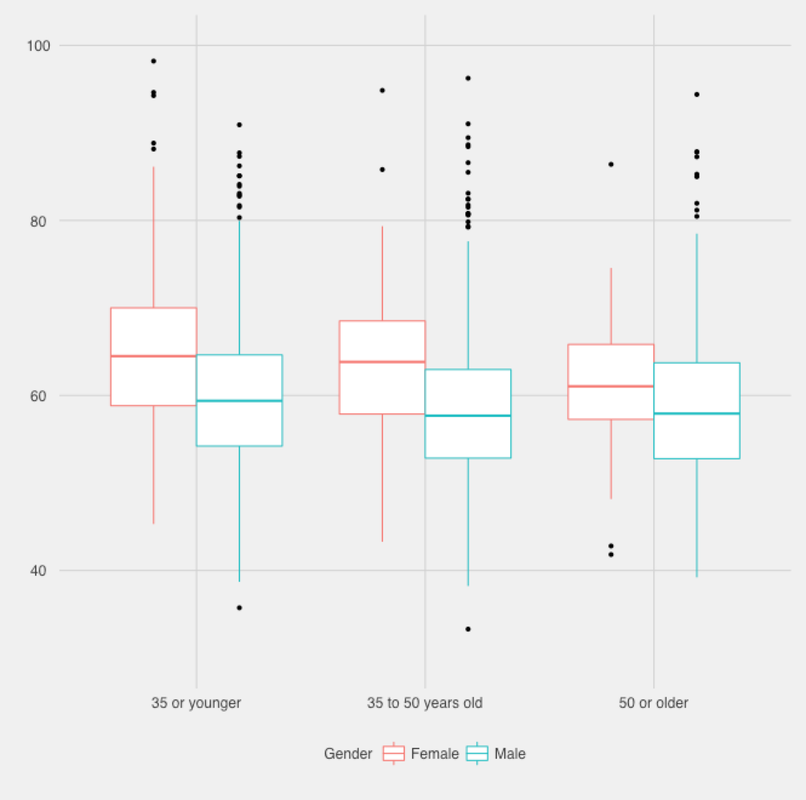
rMSSD & gender, no clear link. Entire dataset on the left, clustered by age group on the right. HR, age and gender
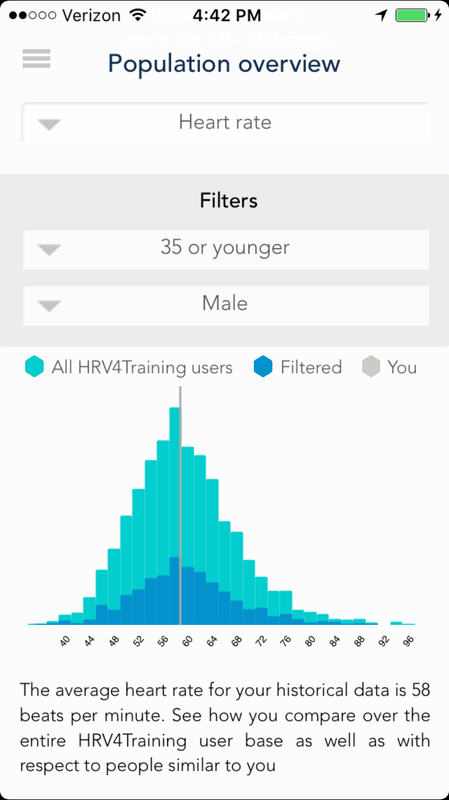
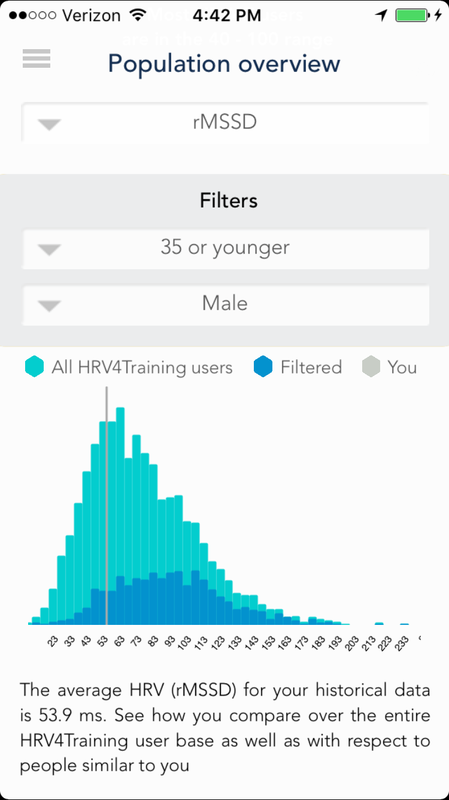
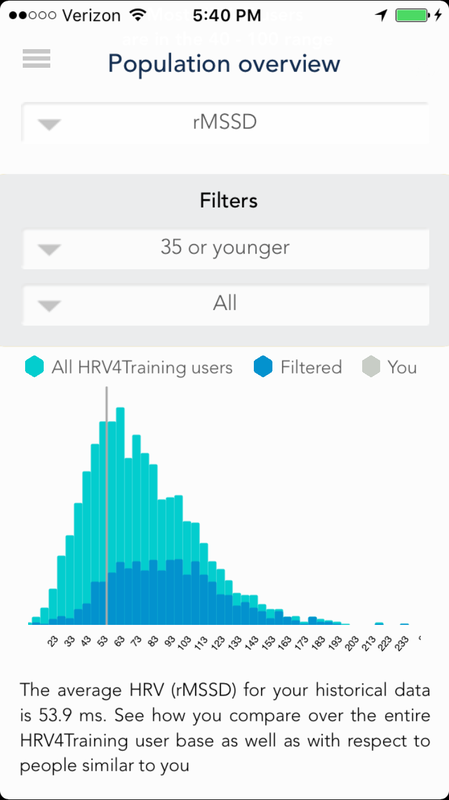
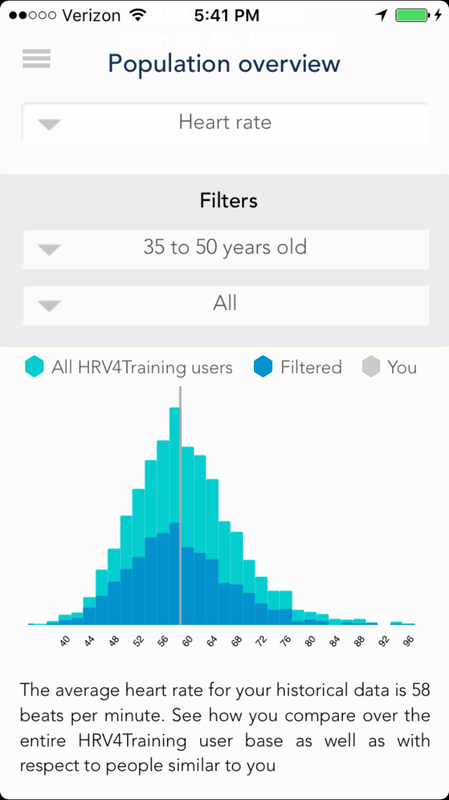
HR & gender. Entire dataset on the left, clustered by age group on the right. SummaryIn this post we've explored the relation between HR, HRV, age and gender. We limited our analysis to these two basic stratifications as we easily end up with a small sample when we start stratifying over 3 or 4 parameters. However, other factors would be interesting to explore, for example training load as a proxy to fitness level, something we recently introduced in the app, which is most likely strongly related to changes in baseline HR, and probably less on changes in baseline HRV. Below you can see some of the relations explored in this post as they appear in the HRV4Training app. rMSSD reduction with ageIn the plots below you can see how the filtered data, shown in darker blue, moves towards the left, i.e. towards lower rMSSD values, as we select groups of older age. You can also see how my own data fits better the 35 to 50 distribution than the 35 or younger one.
HR constant across age groupsFor HR data, we don't see any shift, as baseline HR data does not seem to be linked to age.
1 Comment
5/6/2016 08:11:41 pm
Marco, really excellent post here and your update to the app. Very cool to see the actual statistical comparisons to other HRV4T users. Your app surpassing the 3000+ figure for your sample base is also quite impressive. Congrats! Since you had to omit some portion of the users, the actual number of HRV4T users is probably significantly higher. Your comment will be posted after it is approved.
Leave a Reply. |


Register to the mailing list
and try the HRV4Training app! 
|