|
Blog post by Marco Altini.
A few weeks ago we blogged about HR & HRV population values and the latest population comparison in HRV4Training. As we keep collecting more data, we will be exploring more relations between physiological data and other parameters. While these explorations cannot unveil causal links, we believe it is still of interest to analyze cross-sectionally our data and report on our findings, at least for the sake of curiosity, as literature on the topic is extremely limited due the usual sample size issues.
As a matter of fact, while busy writing this post, an article exactly on the same topic popped up on my twitter; "Comparison of body composition, heart rate variability, aerobic and anaerobic performance between competitive cyclists and triathletes", by Arslan et al. (link here). As the title suggests, the authors investigated the differences in these variables in two samples of cyclists and triathletes, of 6 and 8 individuals respectively. Findings were in line with what we would expect, with similar body characteristics and typically higher VO2max and lower resting HR for triathletes. Findings that seem to confirm my considerations on the stronger link between resting HR and fitness, with respect to HRV & fitness (see this post for a broader discussion). In this post, I will use the same data used for our previous post on HR & HRV population values, i.e. about 3000 users. We will look at HR and HRV values in our user base and highlight confounding factors that should always be accounted for when performing this kind of analysis over a broad set of users. Preprocessing
I've included all users that took at least 1 week of measurements between October 2015 and March 2016, discarded all HR outside of the 30-110 bpm range, discarded all rMSSD values outside of the 5-280ms range and discarded all camera-based measurements that reported quality below optimal. I've also excluded all users not reporting a main sport. As mentioned above, this procedure leaves us with about 3000 users.
HRV4Training users & sport type
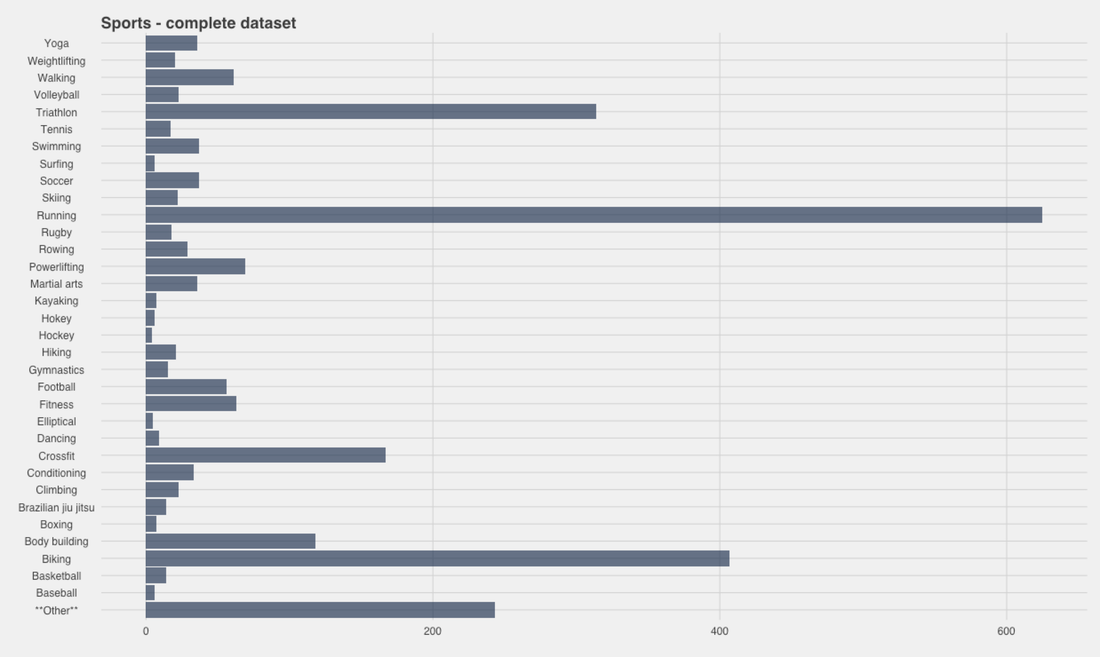
The barplot below shows the number of users for each sport included in this analysis. Not surprisingly, most of the userbase is made of sports with a strong aerobic component, such as running, biking and triathlon.
Heart rate by sport
Below is the distribution of HR data for each sport. If you haven't seen boxplots before, the way to read these data is quite simple. The black line in the middle is the median, so the middle value of the distribution. The rectangles includes 50% of the data for each specific sport (they extend between the 1st and 3rd quartile). On the x axis we have heart rate in beats per minute.
For all plots that follow, we included only sports for which we have at least 20 users that recorded data for an entire week: 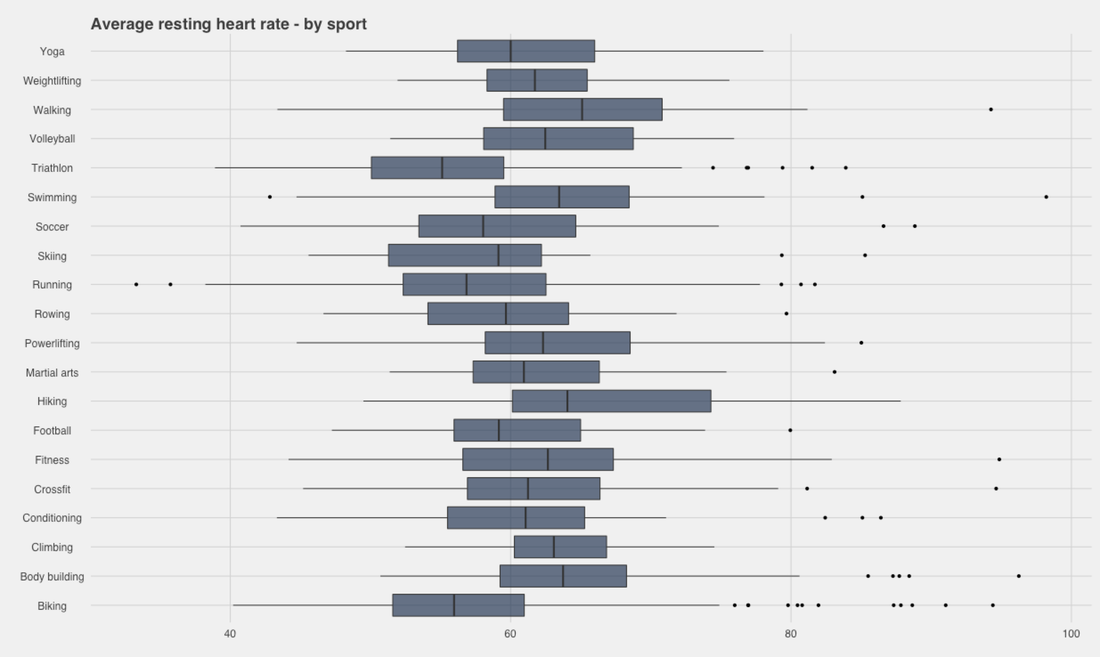
In the plot above we can see clearly how triathletes tend to have heart rates at rest much lower than most individuals doing other sports (similarly to cyclists). As HR does not seem to be affected by e.g. age (or at least to a much lesser extent than HRV), and is a physiological parameter that is highly linked to aerobic fitness, we do expect to see these data. What about HRV?
Heart rate variability by sport
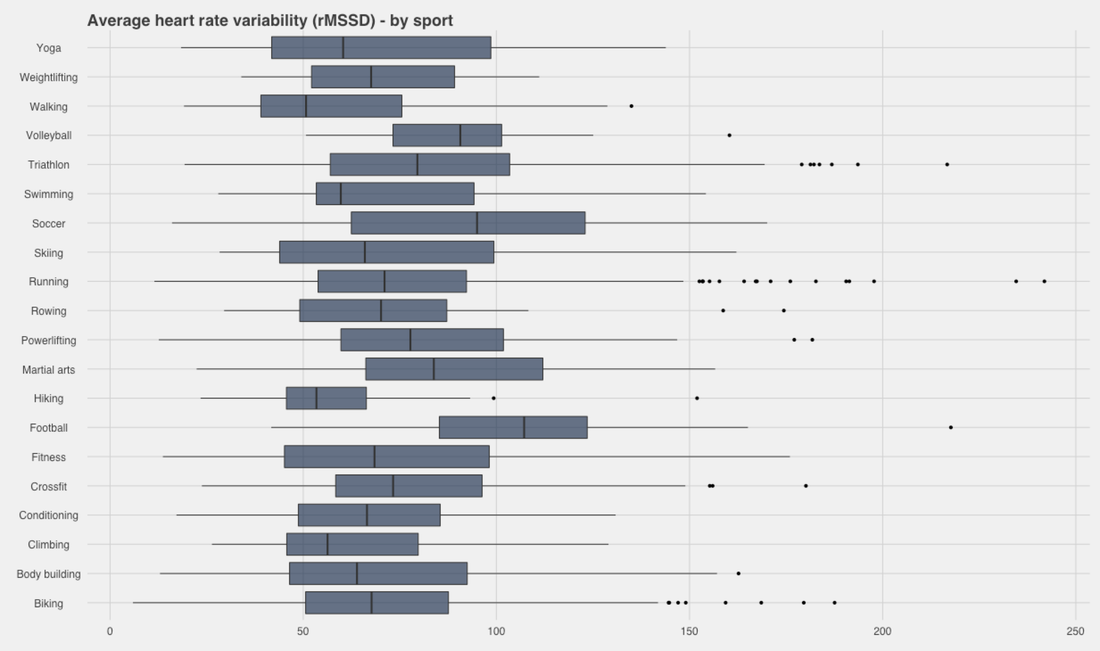
Here is the same figure but for HRV data. We are showing rMSSD in ms. As there is a very strong link between HRV and age, looking only at these data we would risk to derive the wrong conclusions. For example, football and soccer players seem to have higher HRV with respect to other sports. However, even without looking at the data, we can probably guess already that these users are typically younger. On the other hand, walking seems to be associated with the lowest HRV values, which might be once again due to the fact that older individuals might be walking instead of doing more intense sports.
Let's have a look at the age distribution by sport, to try to clarify some of these aspects:
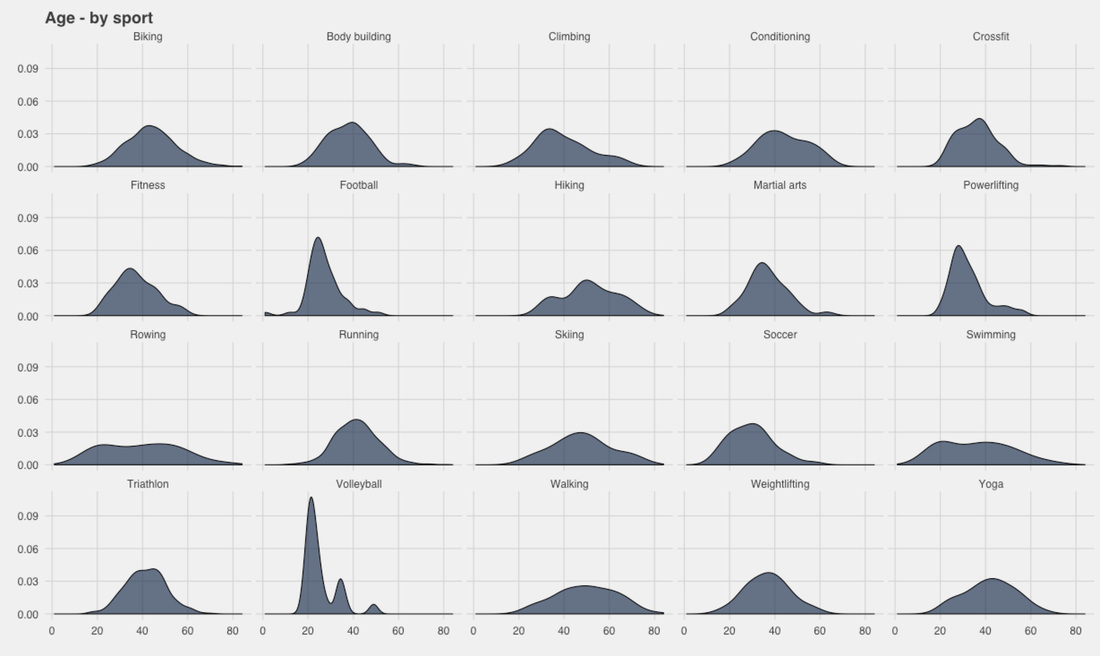
In the figure above we have age (in years) on the x axis. We can see quite clearly how football and soccer players are in general younger. Other sports have users over a quite broad range of ages.
To further clarify the importance to always look at these data with respect to all relevant parameters, we can see in the plots below how the strong link between age and HRV shows up quite clearly, after highlighting sports with an average age below 30 years or above 45 years, which results in three of the highest and lowest HRV scores respectively, across the entire dataset. This is the same data shown above. 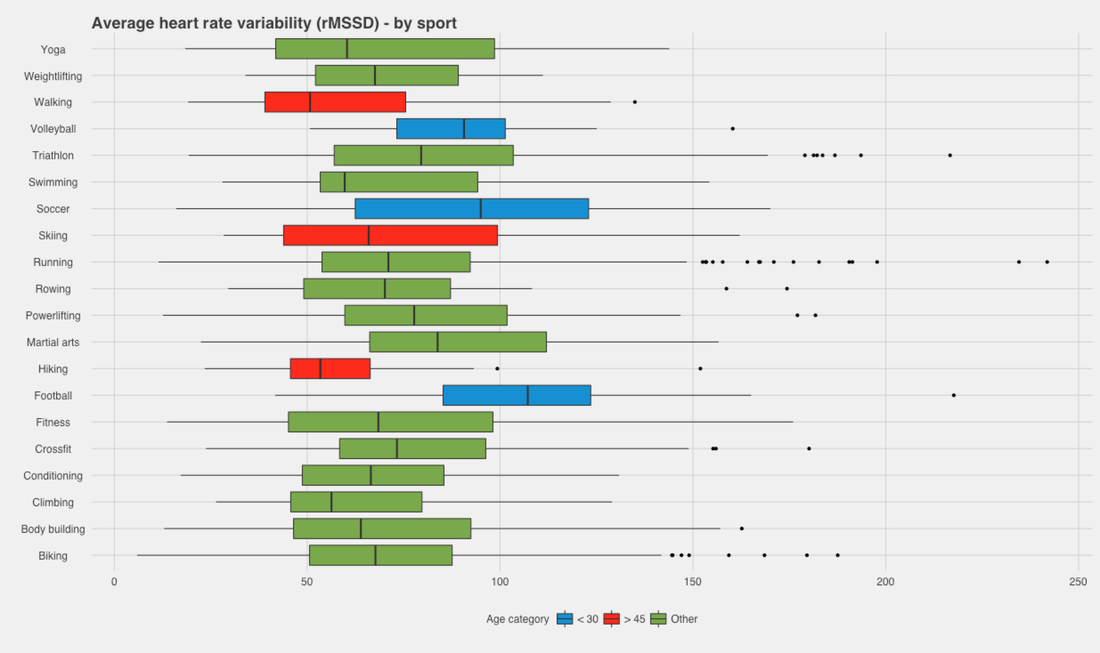
Summary
In this post we looked at the relation between HR, HRV, sport & age in about 3000 HRV4Training users. We highlighted the importance of always looking at the relevant confounding factors, such as age in the context of cross-sectionally looking at HRV data, to avoid deriving the wrong conclusions.
In the following posts, we will explore more of the relation between physiological parameters and fitness, for example by looking at potential differences in HR & HRV for individuals performing the same sports at different levels of training loads, which is another non-physiological proxy to fitness. p.s. if your sport is not included in this analysis due to lack of data, tell your friends to get on HRV4Training. Like the app and the blog?
If you like the app and or the blog, take a minute to review HRV4Training on the Apple store. Thank you!
0 Comments
Your comment will be posted after it is approved.
Leave a Reply. |


Register to the mailing list
and try the HRV4Training app! 
|