|
Blog post by Marco Altini
This is an older post in which I show issues with most wrist based devices in terms of HRV analysis, as these devices have been designed with a different application in mind (reliable heart rate during exercise). As of 2020, only the following sensors can be used reliably for HRV analysis and comply to standard bluetooth sensors, as far as we know:
In depth analysis on the accuracy of rr intervals and hrv features for chest and wrist worn wearable sensors
In the last post, we've seen an overview of what HRV is and how it is computed. As an example, I showed a minute of ECG data from which RR intervals were extracted. Once we got RR intervals, we could proceed to feature extraction by analyzing RR intervals in the time and frequency domains. However, most of the time we don't have access to ECG data and we need to rely on RR intervals extracted by commercially available heart rate monitors.
In this post I will give an overview of two of the most commonly used heart rate monitors and compare the data they report to a regular ECG device. The two devices I will compare embrace slightly different philosophies and are among the best selling heart rate monitors targeting sport enthusiasts and athletes, i.e. the Polar H7 and the Mio Alpha:
We will first have a look at the RR intervals reported by the two devices, and then compute time and frequency domain HRV features and see how accurate these features are with respect to a reference system acquiring a full ECG.
Polar has a great track record in making the most reliable heart rate monitors for consumers, and as we will see, the H7 is no different. The Mio Alpha was the first heart rate monitor worn at the wrist. It uses technology developed by Philips for the optical heart rate acquisition, and certainly revolutionized the market. To be fair, since it's launch a few other versions of the Mio Alpha devices were introduced on the market (the LINK and Mio Alpha 2), however I haven't had the occasion to get my hands on them so this post uses data acquired from the first Mio Alpha device. It seems to me that nothing really changed in the optical part, but please feel free to comment below if you have reason to believe otherwise.
Most of the RR intervals features (heart rate or heart rate variability) we will be looking at and discussing in future posts in the context of measuring training load/recovery as well as fitness level are typically measured at rest (either while lying down or standing). Thus, the protocol designed to record data used in this post includes measurements at rest only.
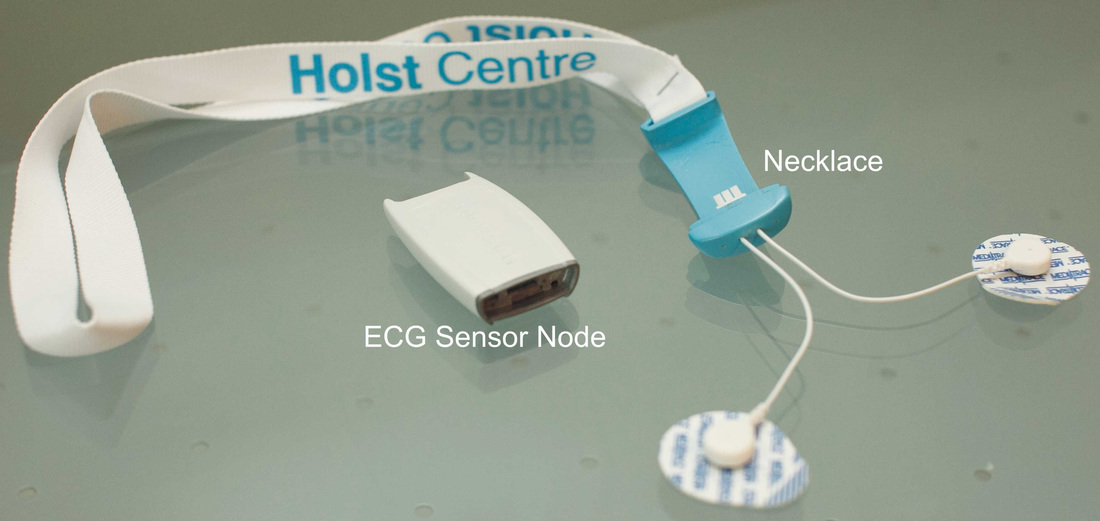
The reference system used is the ECG Necklace, a research prototype we developed at imec/Holst Centre when I was still working there [1]:
The device was worn together with either the Polar H7 or the Mio Alpha. The ECG Necklace was used to extract reference RR intervals from ECG data. The algorithm used to extract RR intervals (i.e. to perform beat detection) is based on continuous wavelet transform, and has been optimized for robustness to motion artifacts. The algorithm was developed by some former colleagues at imec, and achieves pretty good performance (99.8% sensitivity and 99.77% positive predictivity) on a publicly available dataset typically used for validation of this kind of algorithms, the MIT-BIH dataset [2]. Here is a snapshot of the data, showing also detected beats (that will result into RR intervals, i.e. time differences between consecutive beats): 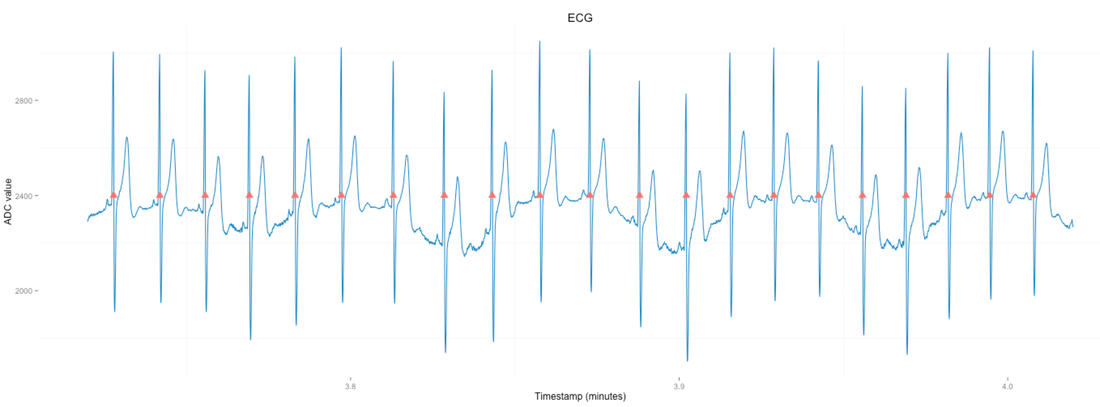
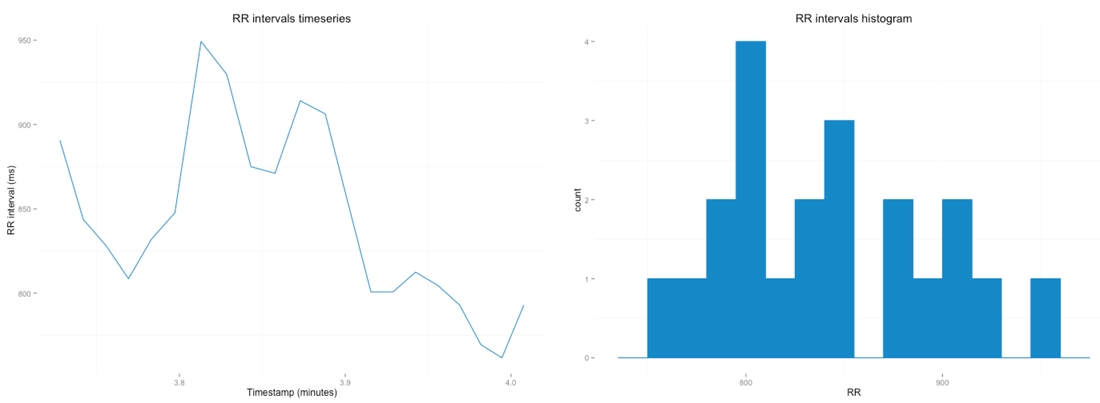
Once the RR intervals are extracted, we have our reference data to compare against RR intervals derived from the heart rate monitors. Here we can see an example of RR intervals time series extracted from the ~20 seconds of data above, and the histogram of the same RR intervals:
Can we get the same RR intervals using commercially available heart rate monitors?
RR intervals - comparison
The two sensors I will compare use the Bluetooth low energy (BLE, or SMART) protocol. This is a rather recent protocol and I have quite some hands on experience with it. Back in 2011, before any of these sensors were available, and even before the specs for standard BLE heart rate profiles were released, we had already developed a wearable sensor that used BLE to transmit ECG and accelerometer data to an iPhone 4S [3]. Later on, the specs came out and simply put, the way the protocol works is that the sensors send heart rate information (in beats per minute) every second, plus some extra info attached to it. This extra info is what we care about, because sensor manufacturers already do most of the job for us, and extract RR intervals that are then appended to the packed received every second to update heart rate. The actual heart rate value is typically an average of the past 15-30 seconds, and therefore we don't really care much about it. What we will look at, are the RR intervals appended to the packet.
Polar h7
I recorded about 6 minutes of simultaneous ECG (from the ECG Necklace) and RR intervals from a Polar H7, using the HRV Logger, a general purpose app I made to collect this kind of data. The app records everything that comes from bluetooth low energy sensors (i.e. heart rate every second and RR intervals) and computes HRV features. It also records steps and location for context, making it a decent tool for experimentation.
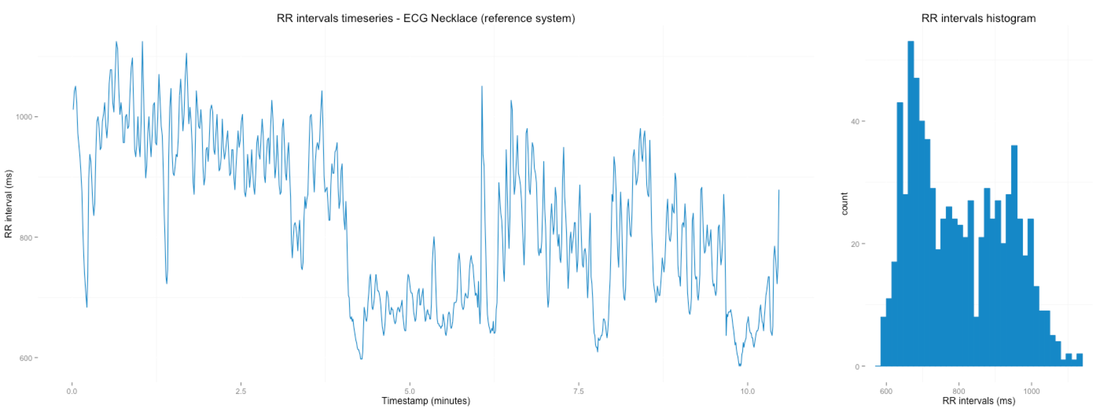
These are the RR intervals extracted from the ECG Necklace: 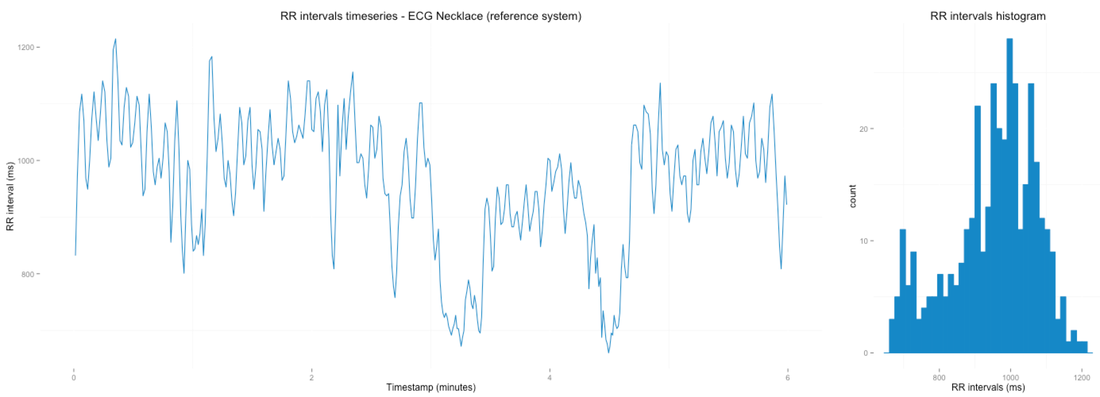
Even just by looking at the RR intervals, we can see there is a lot of variability and values cover quite a big range. We can also clearly see the effect of breathing on RR intervals (higher frequency changes that reflect respiratory sinus arrhythmia (RSA), basically heart rate variability in synchrony with respiration, when RR intervals are shorter during inspiration and longer during expiration). Now let's have a look at the Polar H7 data recorded simultaneously:
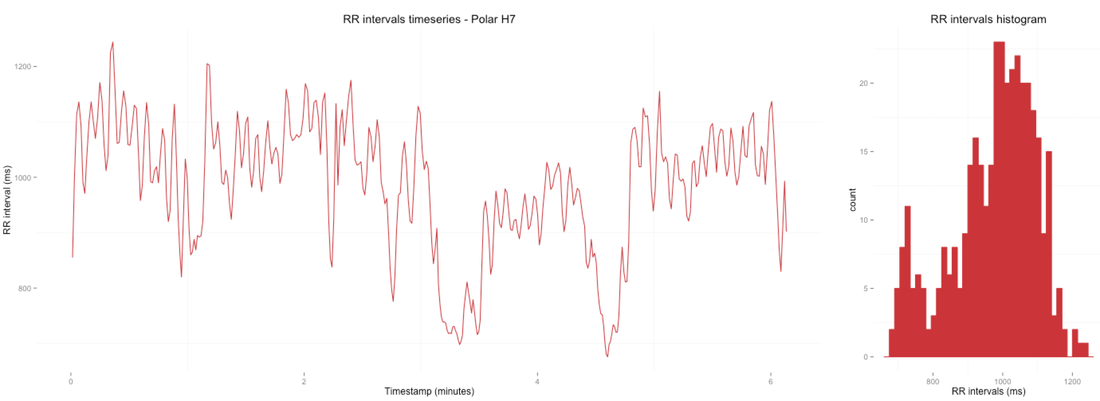
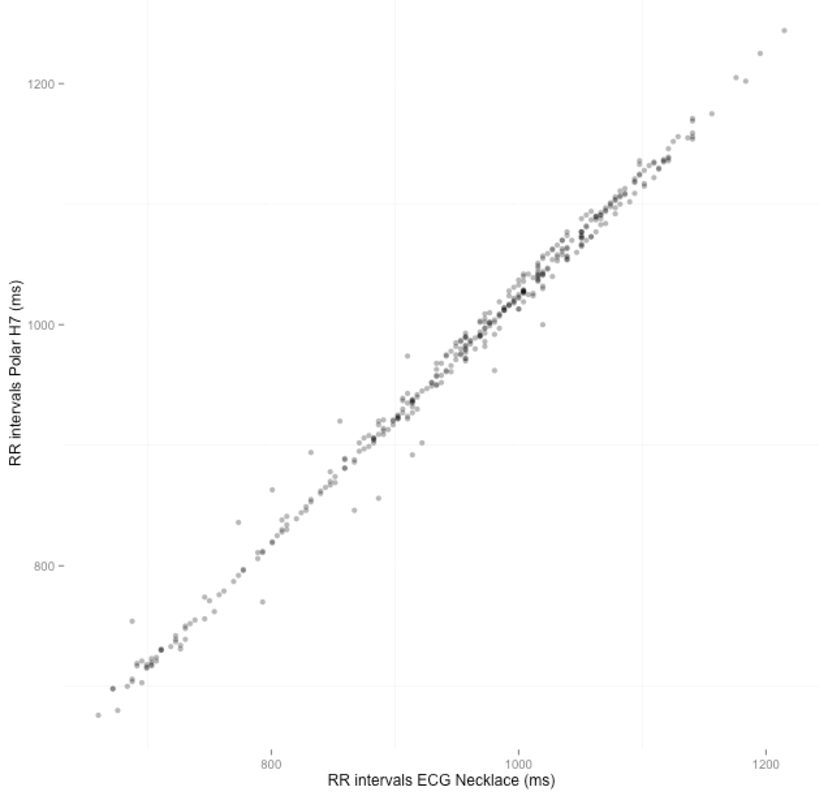
The two time series certainly look similar. Plotting RR intervals against each other confirms very high correlation (Pearson's r=0.997):
Mio alpha
For the Mio Alpha, I recorded about 10 minutes, again simultaneously using the ECG Necklace, and while at rest. I did not record all the sensors (Polar and Mio Alpha) at the same time since I can use only one bluetooth sensor at the time with my app. Here is the reference data from the ECG Necklace:
And the RR intervals recorded simultaneously using the Mio Alpha:

In this case we can spot issues even before plotting the RR intervals against each other. While the sensor is capable of capturing macro changes, basically changes in average HR, the variability between intervals is highly reduced. The signal looks much smoother. Let's plot the RR intervals from both systems against each other:
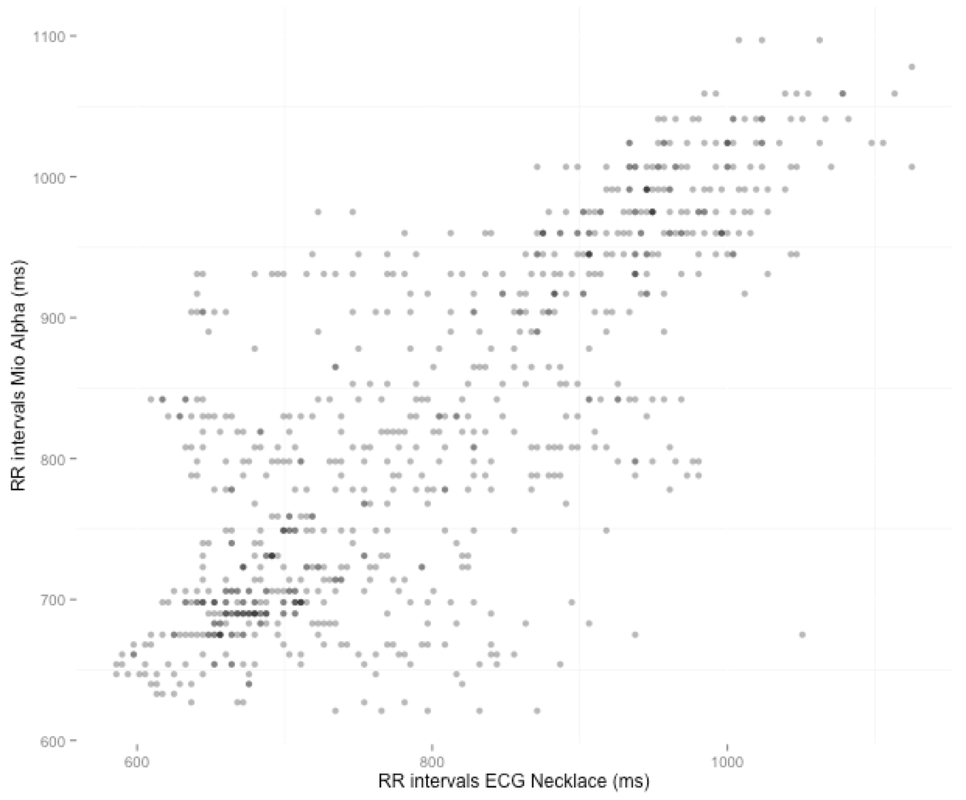
We can't be very happy with this one. RR intervals seem all over the place, and Pearson's correlation goes down to 0.77.
Now the most important question, what is the impact of this on HRV? How accurately can we compute HRV features? HRV features - comparison
The following plots show HRV features computed over 60 seconds windows. I plotted features derived using the ECG Necklace RR intervals side by side with the features extracted using RR intervals collected with either the Polar H7 or Mio Alpha. The data is the same that was used for the plots above. I computed both time and frequency domain features according to the formulas I introduced in the previous post.
Polar H7
Here we can see how features extracted every 60 seconds for a recording of about 5 minutes of data using the Polar H7, seem to follow very well features extracted using the ECG Necklace. An important point here is that the synchronization between the two devices was not perfect, since the data were recorded on separate systems, so there might be small differences due to 1 or 2 RR intervals ending up in a different 60 seconds window.
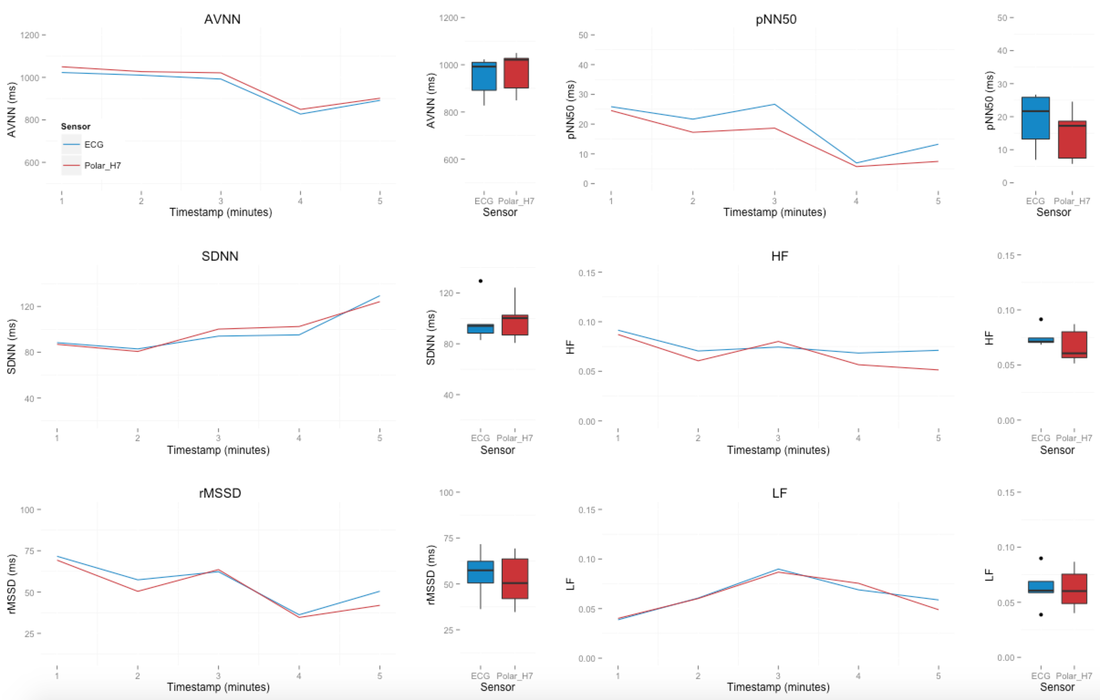
What features do we care about the most? While HRV is typically determined as a set of time and frequency domain features, and some features have similar interpretation, not all of them do. In particular, some features are more representative of parasympathetic activity.
We are mainly interested in parasympathetic activity since assessing a reduction of such activity points out (normally) a "more stressed" state, while an increase in parasympathetic activity can be linked to a reduction of physiological stress. These relations are used by HRV4Training as well as other apps to guide training since intense training is responsible for reducing parasympathetic activity, something we can capture by looking at some HRV features. The most useful features for this purpose, according to literature, are rMSSD and HF. pNN50 is also highly correlated with both rMSSD and HF, as can be seen even from the plots above for a short recording under similar (rest) conditions. Other features are less interesting, for example AVNN is simply the inverse of the average HR during the time window, and therefore by definition doesn't represent the variability we are interested in. Mio alpha
Moving on to the last comparison, in the following plot we can see features extracted every 60 seconds for a recording of about 10 minutes of data using the Mio Alpha:
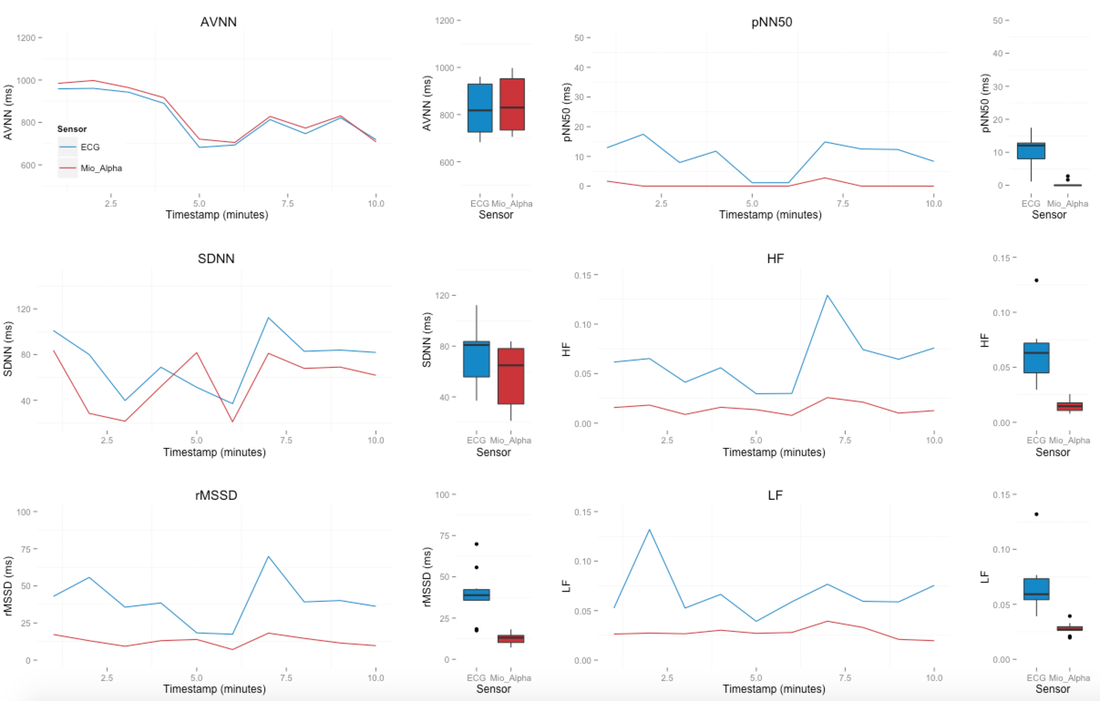
Let's analyze the results in these plots. As pointed out before, we can see the very high correlation between rMSSD and HF for the ECG Necklace (blue lines). Clearly both features represent the same underlying processes, namely parasympathetic activity.
The Mio Alpha can capture HR very well, we saw it in the time series of RR intervals above, and we can see it here by looking at AVNN. However, for the features we are really interested in, i.e. rMSSD and HF, the Mio Alpha completely fails to capture the variability. We could spot this easily before as well, by looking at how much smoother the RR intervals time series for the Mio Alpha was, with respect to the ECG Necklace or Polar H7. These results don't leave much room for doubts, if we want to measure parasympathetic activity through HRV features such as rMMSD and HF, the Mio Alpha is a no go. If you want to rely on a wearable sensor, you should get a Polar H7 or another validated chest strap. This does not mean that accurate HRV features can't be computed from wrist worn devices. As a matter of fact, optical measurements can provide enough resolution, however most of the commercial products currently on the market, Apple Watch included, are forced to perform a lot of averaging over the signal they acquire, therefore reducing usefulness for HRV analysis. The main reason for all this averaging is that motion artifacts at the wrist are pretty bad, and getting a reliable heart rate is already a challenge. In absence of motion, HRV can be extracted even from PPG data. In one of the following posts I will cover more about optical measurements and PPG, showing how even low frequency PPG data acquired with the phone's camera can be used to reliably extract HRV features, without requiring any sensor. This technique is fully implemented in HRV4Training and Camera HRV. References
[1] Penders, J., Altini, M., van de Molengraft, J., Yazicioglu, F., & Van Hoof, C. (2011). A low-power wireless ECG necklace for reliable cardiac activity monitoring on-the-move. In Proceedings of the International Conference of the IEEE Engineering in Medicine and Biology Society.
[2] Romero, I., Grundlehner, B., & Penders, J. (2009, September). Robust beat detector for ambulatory cardiac monitoring. In Engineering in Medicine and Biology Society, 2009. EMBC 2009. Annual International Conference of the IEEE (pp. 950-953). IEEE. [3] Altini M., Polito S., Penders J., Kim H., Van Helleputte N., Kim S. and Yazicioglu F.. "An ECG patch combining a customized ultra-low-power ECG SoC with bluetooth low energy for long term ambulatory monitoring". In: Wireless Health. 2011. download pdf. Second place best demo award. Data
Thomas
8/6/2015 12:27:03 am
Hi! I would like to know if I can extract the RR interval from the H7 through your logger app? If so, what is the .format?
larry silverman
10/26/2015 09:29:33 am
Excellent explanation. As a medical scientist, I would like to add another use of both HR and HRV monitoring. Please see: Comments are closed.
|


Register to the mailing list
and try the HRV4Training app! 
|
||||||||||||||