|
Blog post by Marco Altini In this blog post we cover our latest update in HRV4Training Pro, which makes it easier to analyze the two most important parameters when it comes to interpreting your physiological response to training and lifestyle stressors:
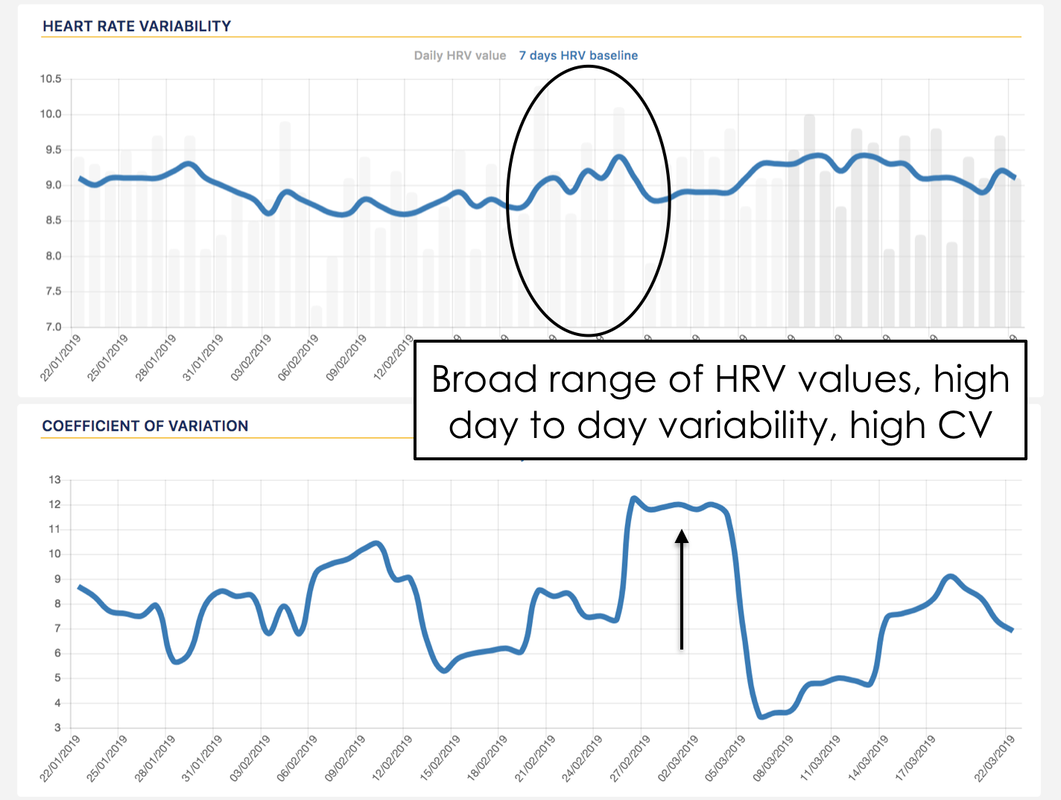
What's the CV?The amount of day to day variability in your HRV scores is the Coefficient of Variation (CV or CV HRV). This is different from your baseline, which is simply the average of your score over the past week Let's look at an example to make things more clear. If your baseline this week is 8, it could be that you had a few days with very similar scores, say 7.9, 8.1, 8, etc. or it could be that your scores were jumping up and down quite a bit more, say 6, 10, 7, 9, etc. - in both cases averaging at 8, your baseline. Got it? The amount of variability is the CV, so in the first case with similar values, the CV is small (there is little day to day variability), while in the second case, the CV is large (more day to day variability). Note that as always, small and large are both determined based on your historical data, everything is relative. Let's look at an example for a person's data over time:
The top plots show daily HRV score and the baseline, 7 days moving average (in blue). The bottom plots show the CV. You can see how the CV increases when the daily scores are jumping around more, while decreases when we have more stable values, regardless of the fact that the baseline is fairly similar in the two conditions. We'll learn in the next section why this matters. These plots are available in HRV4Training Pro under Insights / Resting Physiology. Why do we care?We've been covering a few times in the past weeks the fact that the most important aspect to analyze is how your baseline is going with respect to your normal values, as a baseline within normal values shows a stable physiological condition and good adaptation to training, while a baseline below normal values, shows significantly higher stress and the need to hold back. To learn more about this, check out our post on the big picture and training prescription using HRV. However, as anticipated in the intro of this post, there is another parameter which is very important, and that's the CV. In particular, the amount of day to day variability (the CV), combined with baseline changes with respect to normal values, can provide additional insights on adaptation to training and other stressors. From Flatt et al. ”Thus, the preservation of autonomic activity (no change in LnRMSSDm) and less fluctuations (reduced LnRMSSDcv) seem to reflect a positive coping response to the training. In fact, individuals who demonstrated the lowest LnRMSSDcv during week 1 of increased load showed the most favorable changes in running performance (r = -0.74)." - as discussed in our blog on training load. A reduced CV is often associated with coping well with training. What we are measuring is how we are responding to a workout or block of workouts, with certain trends (stable or upwards HRV, reduced CV) being indicative of good adaptation, even in periods of very high load. This means also that the opposite trends, reductions in HRV or larger fluctuations in CV are signs of poor adaptation and should trigger changes in training. Coefficient of Variation in HRV4Training ProIn our latest HRV4Training Pro update, we have added the possibility to highlight the current trend in your CV, directly in the Overview page, so that you can see at the same time your baseline with respect to normal values, as well as how the CV is trending (stable, increase or decrease). See an example below: 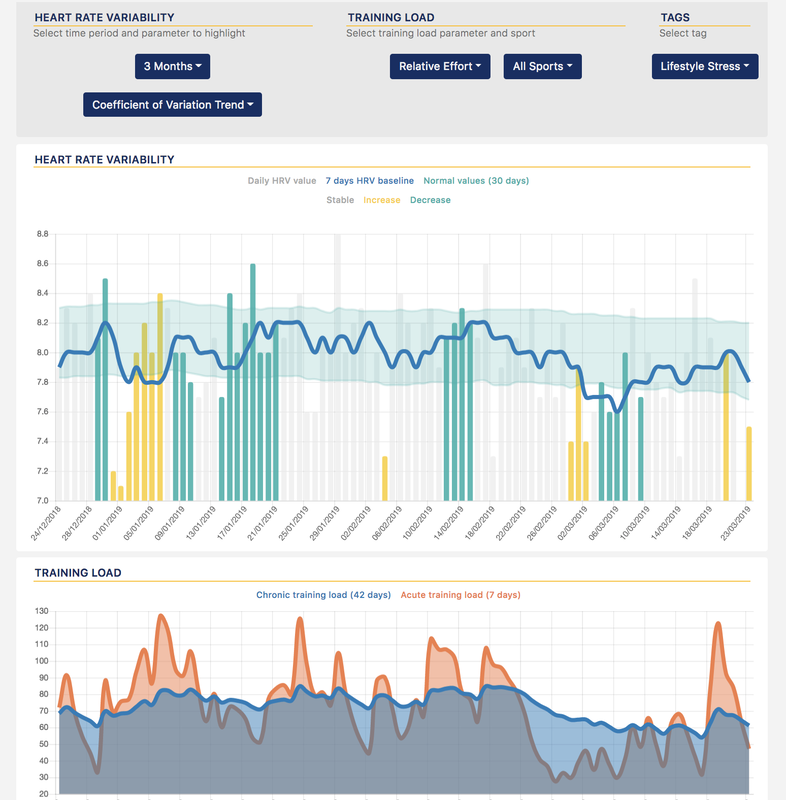 Using this visualization you can more effectively analyze the CV, as only significant changes are color coded (stable, or the gray scores, simply mean that changes are trivial during a given period), hence you can see when for example your scores seem to be jumping around a bit too much (yellow bars), even if the baseline is still within normal range. Putting it all together: automatically detected physiological trendAs we have thoroughly described here, HRV4Training can automatically determine how you are coping with your training load by combining heart rate variability, heart rate, Coefficient of Variation and training information. The detected trend is one of the following: coping well with training, being in a stable condition, risk of maladaptation or accumulated fatigue. While we have added the CV trend in the view just described, you do not really need to do the math yourself, as this analysis is present in the HRV4Training app under Insights / HRV Trends and also on HRV4Training Pro under Insights / Resting physiology. You can overlay the trend detection analysis with your normal values as well, so that you can get a better overview of not only your physiological data with respect to normal values, but also the detected trend based on a combination of baseline HRV, heart rate and coefficient of variation, contextualized by training load. 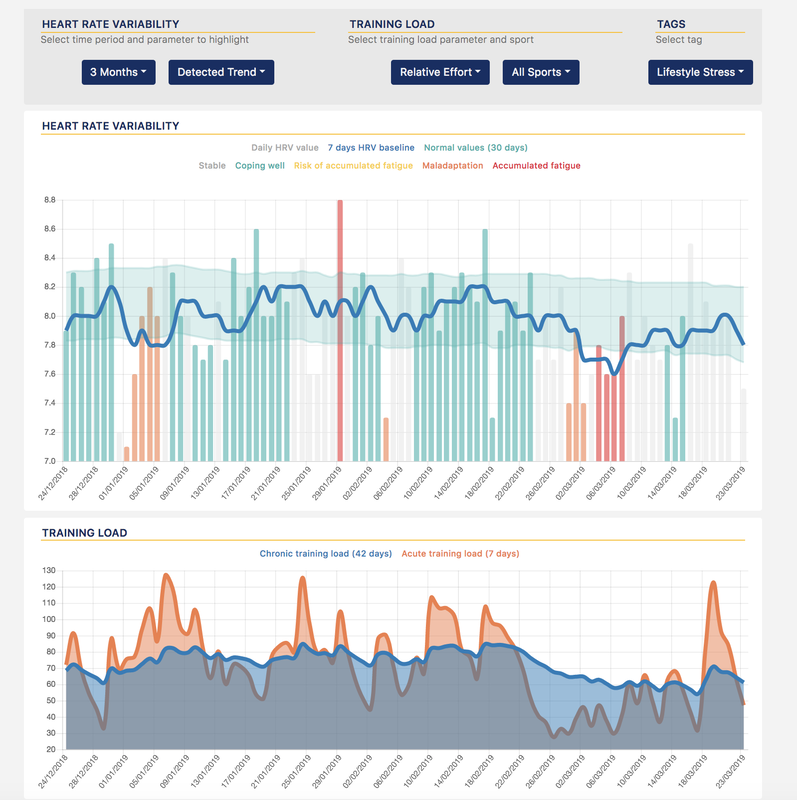 SummaryThis was a short blog post covering the latest update in HRV4Training Pro. As recently we have talked a lot about normal values and the big picture (here), how to use deviations from normal values to guide training (here) and the importance of looking not only at baseline HRV with respect to normal values, but also the coefficient of variation (a multiparameter approach, here), we have made a few changes in HRV4Training Pro to provide an even better overview of your physiological data. We hope you will find these updates useful to better understand how you are responding to training and lifestyle stressors.
Take it easy. Comments are closed.
|


Register to the mailing list
and try the HRV4Training app! 
|