Case study: physiological stress in response to training (running a marathon) and lifestyle1/17/2020
Blog post by Marco Altini Physiological stress comes from different sources, all having an impact on our ability to deal with additional stress and therefore of maintaining or improving our health and performance. In this post we'll see an example of how a morning measurement of your physiology taken with HRV4Training using the phone's camera, can be a very effective way to capture changes in physiological stress in response to such training and lifestyle stressors. We will also see how the visualizations and analytics available in HRV4Training Pro make it really easy to identify periods of higher stress. In particular, we can see in the image two large drops below normal values, highlighting significant stress on the body:
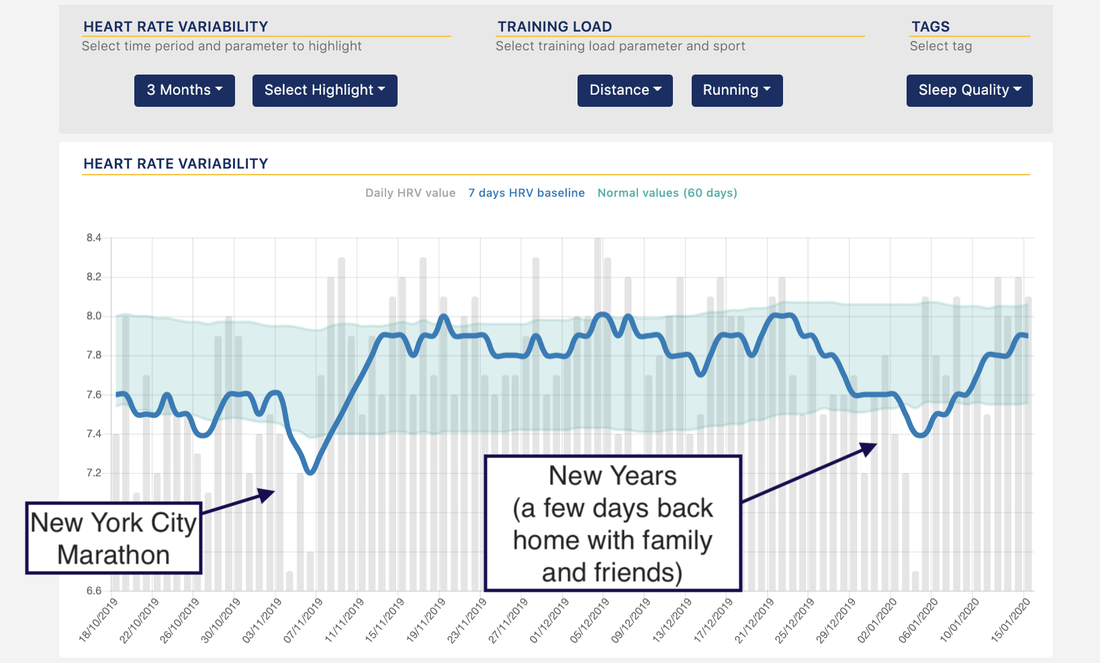 Between the two major stressors, I kept training hard (after about a week of recovery from the marathon), and responded very well as you can see from the stable or increasing HRV during most of November and December. A stable HRV (within your normal values), is typically a good sign, indicating a positive response, especially when increasing training load: 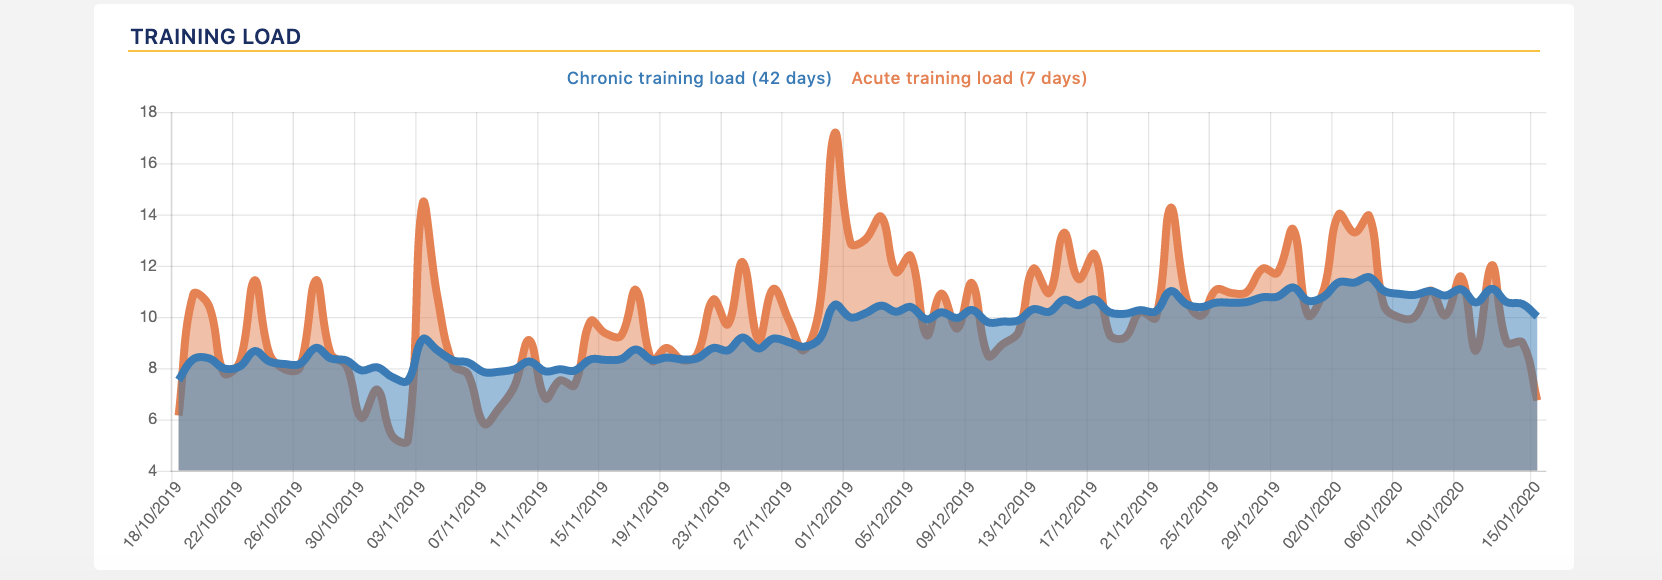 The data above is my own, but we can see a very similar physiological response in Alessandra's data: 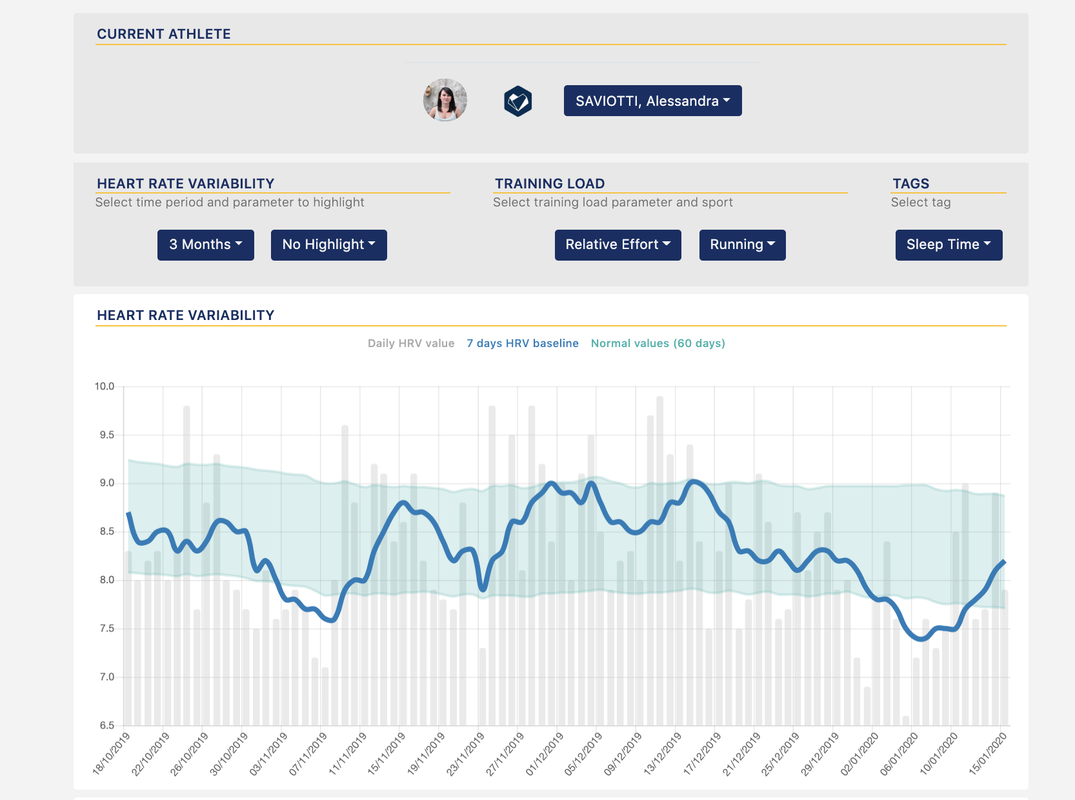 In her case the second drop is even larger, which is linked to the fact that multiple stressors piled up (getting a cold for a few days and the menstrual cycle), see for example the annotations here for sick days: 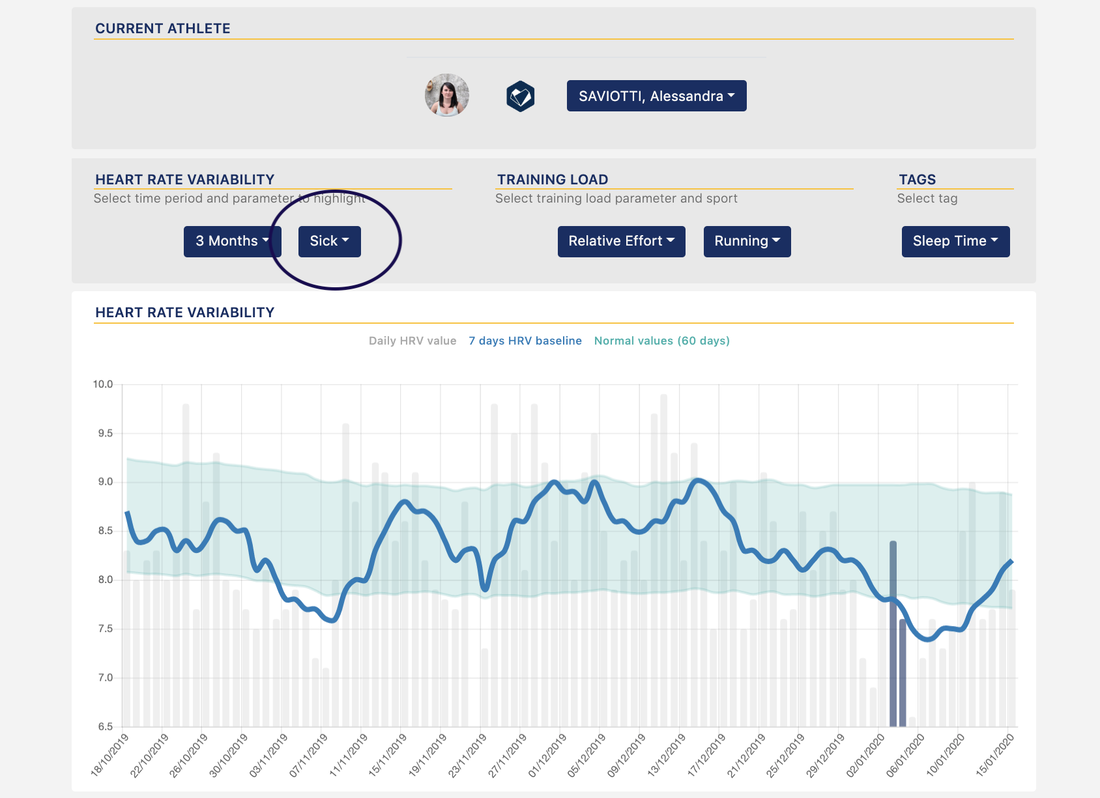 Finally, here we can see HRV4Training's trends analysis at work. In this analysis we combine various parameters (heart rate variability, the coefficient of variation, resting heart rate and training load), to automatically determine individual responses in the medium term. We can see how the analysis is able to detects periods in which we were not coping well with the various stressors, which can be useful information to make a few adjustments (e.g. avoid high intensity workouts which might put you in a even worse situation, physiologically speaking, and therefore further delaying recovery and potentially compromising performance, or simply give priority to good sleep): 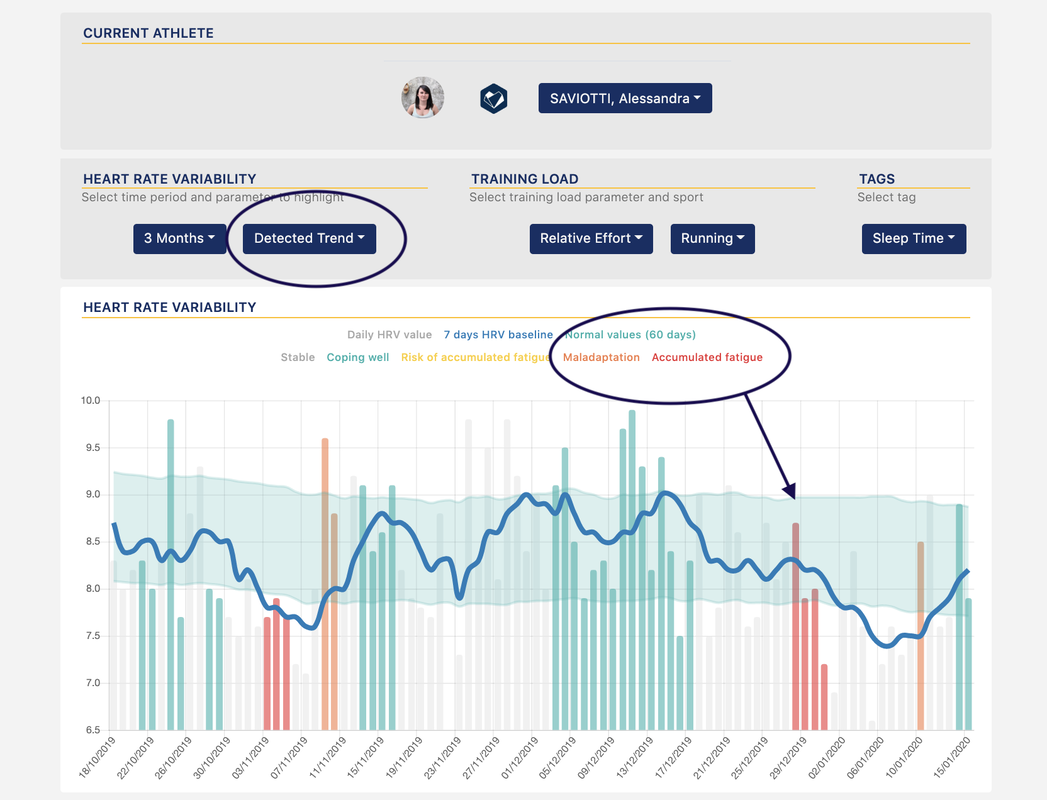 Physiological stress comes from different sources, all having an impact on our ability to deal with additional stress and therefore of maintaining or improving our health and performance.
In this post we have seen how stress can be captured easily with a morning measurement taken in a standard context (as soon as you wake up, while still lying in bed, in just 60 seconds), using your phone camera. As the data clearly shows, this is all that is required to capture changes in stress in response to both training and lifestyle stressors, as well as positive adaptation to increased training load. Take it easy. Comments are closed.
|


Register to the mailing list
and try the HRV4Training app! 
|