|
Blog post by Marco Altini Chances are that you if are reading this blog or have been using HRV4Training, you are well aware of the importance of monitoring your physiology over time in response to various stressors, and interpreting your data only with respect to your own historical data. With the ongoing global pandemic, the medical community has been looking into alternatives that can help to identify and managing individuals that might require additional care, which brought a renewed interest into wearables or in general in tools that can provide physiological measurements. Heart rate, HRV, temperature, are all great candidates as these parameters have shown a consistent response to infections [1, 2]. In the past few weeks we have started a few collaborations with research institutions in Italy and Germany, providing the technology required to further investigate the relationship between (among other parameters), resting physiology and covid-19 infections. However, as a user of our system, you might want to know what to look at as a potential indicator of infection or sickness based on our current knowledge and published research. Thus, in this post, I cover the basics of heart rate in the context of infections, and show a new feature we have built in HRV4Training Pro to help you identify more easily periods in which heart rate is abnormal, and therefore might require more attention. Please remember that heart rate (as well as HRV, temperature, or any other parameter) is just an indicator, and not a diagnostic tool. 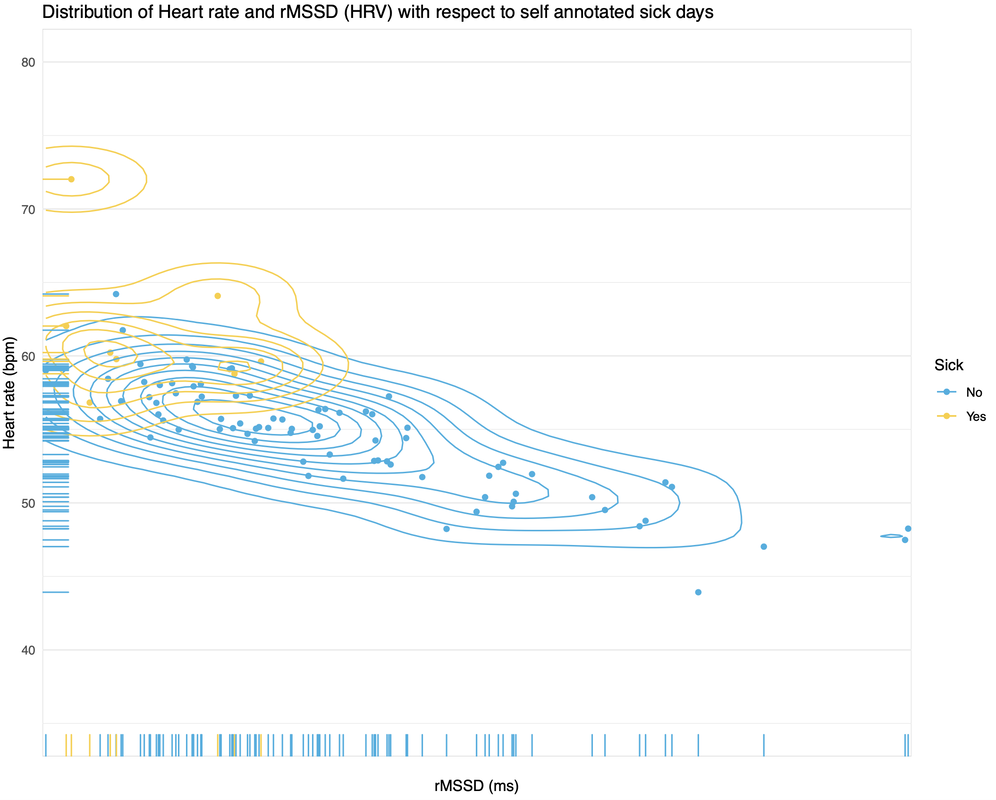 Why heart rate?Something as simple as measuring resting heart rate, is a very useful tool to capture changes in physiology due to our body fighting various forms of stress, including infections [1]. In particular, infections tend to show up in the data as increased heart rate (and reductions in HRV). You have probably noticed it in the past if you were ever sick while also collecting data longitudinally. This can happen a short time before we actually realize that something is going on (say a day or two in my experience). Already years ago, Michael Snyder at Stanford University ran studies in free living using commercially available sensors and found quite striking relationships between heart rate and infection (if you are into papers, I highly recommend this one [2]). We have also shown reductions in HRV and increases in HR with respect to self annotated sick days, in this blog post. Infections or getting sick in general, are one of the few conditions in which I would almost consider heart rate superior to HRV (or at least equal). Why is that? Heart rate does not change much on a day to day basis, and is less sensitive than HRV to changes in physiological stress due to for example training, lifestyle stress, etc. (we have previously quantified these differences, with heart rate changing only 0.5-1% in response to hard training sessions for example, and HRV changing on average 5-8%, full paper here [3]). On the other hand, heart rate changes to a much greater extent when facing an infection (I'll show a clear example later). Hence heart rate can be a simpler marker to look at, less affected by other stressors, and we could look at changes in heart rate to make sure things are staying within a normal range (based on your historical data). Which brings me to our next point. What's a "significant" change?While it is quite clear from published literature, analysis of user generated data, and anecdotal evidence, that there is a strong link between heart rate and infections, the question remains of being able to identify when a change in heart rate is "significant", and therefore might be representative of some underlying abnormality, and when it is not. This is what we aim to do with the latest update in HRV4Training Pro. We have discussed extensively in the past the importance of being able to determine when your physiological data (heart rate or HRV) is "significantly" outside of your normal range, and how the inherent variability in these metrics requires a different approach from the typical (higher - or lower - is better). We need first to understand that there will always be fluctuations between days, and increases or decreases are not necessarily good or bad signs, depending on how large those changes are. This is why HRV4Training always looks at your data only with respect to your historical data (up to 60 days of data) and what we call your normal values. In other words, we check if your daily score is within the range where it should most likely be given your past recordings, provided that nothing odd is going on. If your data is outside of this range, then an important stressor is most likely acting. This is the process we use to help you interpret your HRV data, and we have just extended HRV4Training Pro to visualize normal values also for your heart rate data. You can find this new feature under the Overview page in HRV4Training Pro. Case study: LaurensLaurens is a triathlete and HRV4Training ambassador who shared his data with us after getting sick. While Laurens never got tested for covid-19, he had the common symptoms and felt he most likely had the virus during this period. You can see how his heart rate (typically around 40bpm) jumps really high in response to the infection. You can also see how there are sometimes higher heart rates also in previous data (maybe a glass of wine), but in his data, only the infection causes heart rate to be way higher than normal and remain elevated for days, causing an immediate spike in the baseline as well (7 days moving average), which goes outside of his normal values, highlighting an abnormality. In Laurens' data we can also appreciate how long it takes for things to get back to normal, with a gradual decrease in heart rate, which is however still not where it used to be. Quoting Laurens, "it still takes a few weeks for your body to fully recover and it is therefore very important to keep a close eye on this. I have now reduced my training again back to one time and my heart rate is slowly decreasing again". 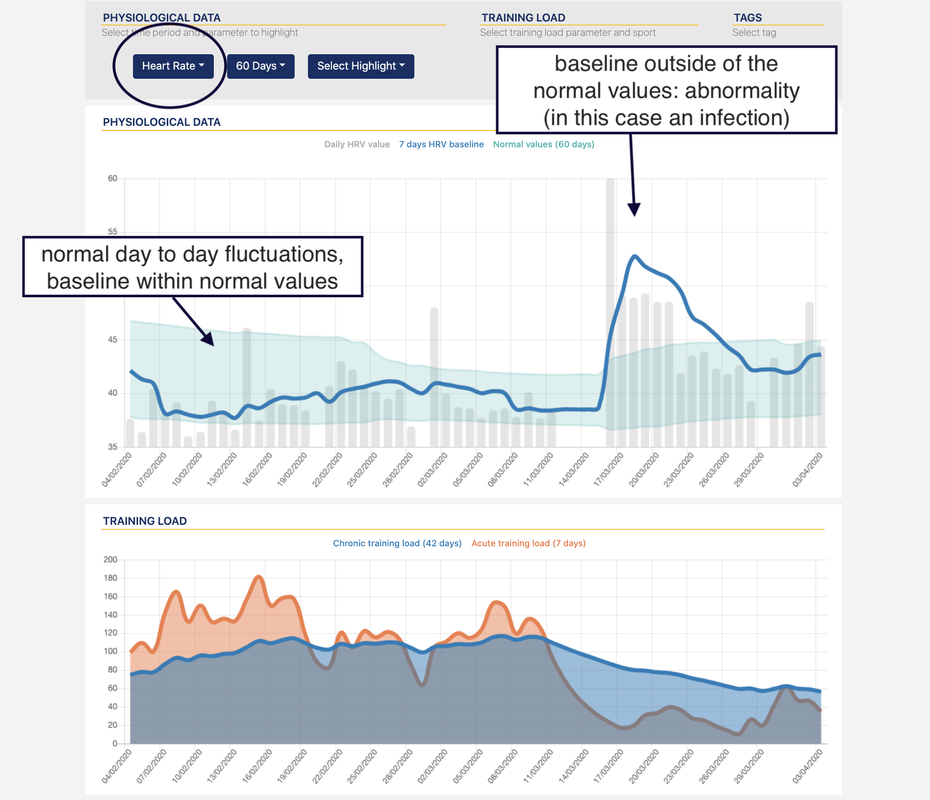 That's all. As mentioned above we have just extended HRV4Training Pro to visualize normal values also for your heart rate data. You can find this new feature under the Overview page in HRV4Training Pro, and get 20% off using referral code STAYSAFE 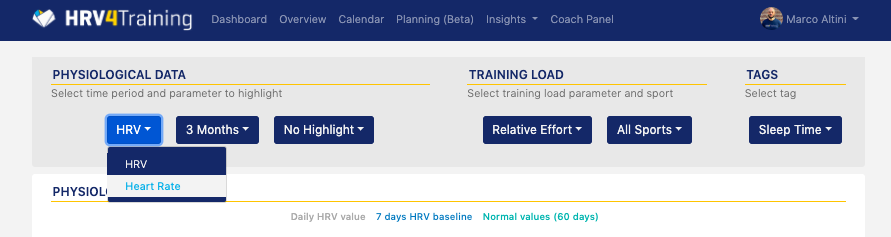 References[1] Buchan, C. A., Bravi, A., & Seely, A. J. (2012). Variability analysis and the diagnosis, management, and treatment of sepsis. Current infectious disease reports, 14(5), 512-521.
Chicago. [2] Li, X., Dunn, J., Salins, D., Zhou, G., Zhou, W., Rose, S. M. S. F., ... & Sonecha, R. (2017). Digital health: tracking physiomes and activity using wearable biosensors reveals useful health-related information. PLoS biology, 15(1), e2001402. Chicago. [3] Altini, M., & Amft, O. (2016, August). Hrv4training: Large-scale longitudinal training load analysis in unconstrained free-living settings using a smartphone application. In 2016 38th Annual International Conference of the IEEE Engineering in Medicine and Biology Society (EMBC) (pp. 2610-2613). IEEE. Comments are closed.
|


Register to the mailing list
and try the HRV4Training app! 
|