|
Blog post by professional ultrarunner and coach Daniel Rowland. You can learn more about Daniel on his website, and reach him on Twitter I have always enjoyed my base training. This time of year is different to the rest of the season as it is about the simple goal of running more miles and getting fitter, rather than doing race-specific training. In this period, I like to build up my fitness from the starting point that I find myself at. Instead of planning backwards from goal races and setting milestones that I need to achieve in training, I can progress at a natural rate and in accordance with how quickly my body adapts to the training. I can also do consistent training without needing to taper or recover from races or to adjust for training camps or travel. For me this means that base training is natural, fun, and that I usually see great progress in my fitness and running performance. During this period of training I place an emphasis on training below the aerobic threshold (AeT) or in zone 1 and zone 2 of a five-zone model. This is consistent with many training systems as it follows a polarized approach and incorporates the fundamentals of building an aerobic base. There are two key challenges for performing this training effectively:
The first challenge of intensity control requires knowing the right intensity and then having the discipline to execute it in training. Traditionally, the AeT has been difficult to define. Unless the athlete goes to a laboratory for testing, the coach or athlete only have the "talk test" or heart rate-based estimates such the MAF heart rate which are not very accurate. The second challenge of assessing progress can be more easily addressed through using repeated routes or time trials, but this can be difficult depending on the weather and conditions over the winter. This case study will explain how I have used the tools available from HRV4Training to address these two challenges and to show the progress from 60 days of base training. Intensity control with Heart Rate Variability LoggerIn January, Marco shared colab project [1] with a way to determine the AeT using DFA (1 alpha). I was interested in it because it addressed the first challenge I listed above. However, when I looked at the process it seemed a little too complicated for me and not worth the effort given how confident I felt about my current set of heart rate zones. Then Marco added the DFA (alpha 1) feature to the HRV Logger app which made it a much easier project and something that I could understand and do myself. I set out to "confirm" my AeT rather than to determine it because I felt so confident that I already knew what it was. My process involved going for a run with two means of recording: my Polar OH1+ recording heart rate and transmitting that to my Polar Vantage M watch, and my Polar H10 recording heart rate and transmitting that to my phone which was recording using HRV Logger. I only looked at my current heart rate on my watch during the run and set an upper limit for heart rate during each session. When I returned home I reviewed the HRV Logger data to see how much time was below the DFA (1 alpha) threshold of 0.75. It took me multiple trials, each time reducing the upper limit of heart rate, until I reached a point where I did not exceed the DFA (1 alpha) threshold. You can see three of the tests in the following screenshots which were tests using heart rate upper limits of 135bpm, 130bpm, and 125bpm. 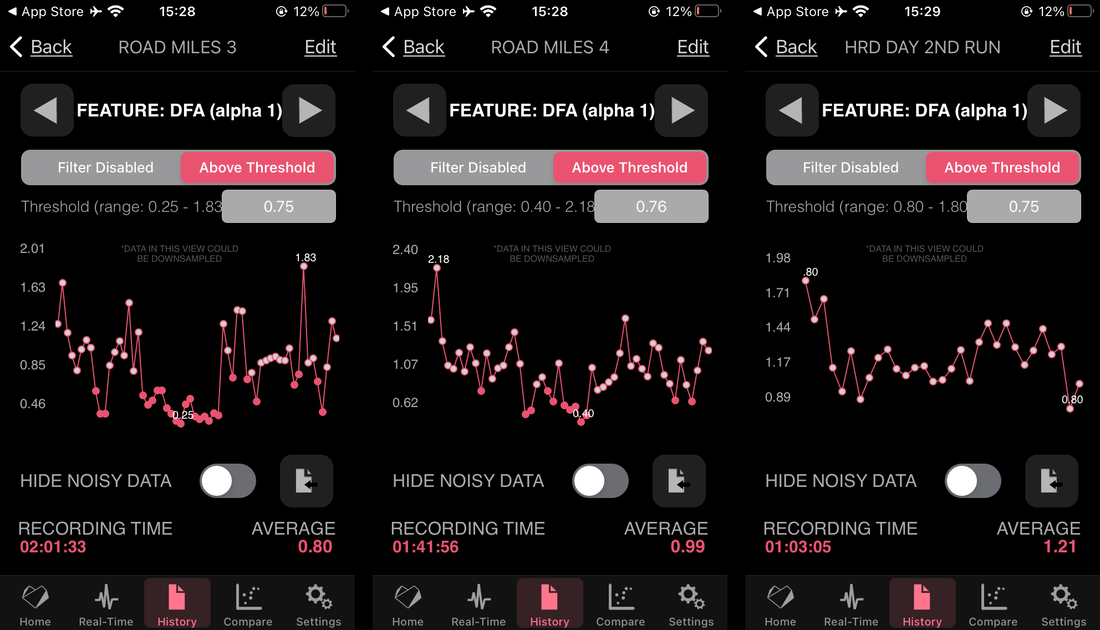 HRV Logger DFA (alpha 1) values from three runs. On the left, a run with a maximum heart rate target of 135bpm. 30% of the run was above AeT. In the middle, values from a run with a maximum heart rate target of 130bpm. 25% of the run was above AeT. On the right, values from a run with a maximum heart rate target of 125bpm. 0% of the run was above AeT. I was surprised to see that my AeT was much lower than I had expected. This meant that my previous training was probably too hard and that I had an opportunity to train with better intensity control in this base period. The steps I took above were my own simple method of determining AeT using HRV Logger. If you're interested in doing this yourself, I would recommend following this more thorough and more detailed practical guide from Marco [2]. How did the training feel?In my first runs using my new HRV Logger-determined AeT heart rate, I felt very, very slow. I had to walk any steep uphills and on long, gradual uphills I was switching between running and walking frequently as I quickly hit the AeT heart rate after any continuous uphill running. It was slightly frustrating to have to walk hills I had previously run, but at the same time I finished each run feeling good and as if I hadn't worked too hard. I was also able to increase my weekly training load every week without ever feeling like I was too tired or progressing too quickly. After the first month of training with this new heart rate limit I was close to running the same routes I had run previously at the same speed, but with a heart rate 15bpm lower than before. After two months I was running exactly the same speed as before or even a little faster all for much less effort. The fact that each run felt good and never left me feeling over-reached meant I had no issues increasing my training load each week. In each run I felt like I was stronger and this feeling lasted from the start to the finish of the run. There was no fading or excess fatigue at the end of the run and I felt like I could keep going at the same effort all the way. This is a fantastic feeling! Tracking progressThe second challenge of the base training period is assessing and monitoring progress. At times I was not sure if I was getting faster for the same effort or if I was just getting more comfortable at running slowly. I could see the improvement over time, but I wanted more concrete evidence that the training was working and a way to quantify my improvement. I turned to HRV4Training Pro to analyze my training over the two month period. The first view that I looked at was my HRV trend and my training load. Despite increasing my training load each week my HRV trend remained within the normal range showing that I was adapting to the amount of training I was doing. 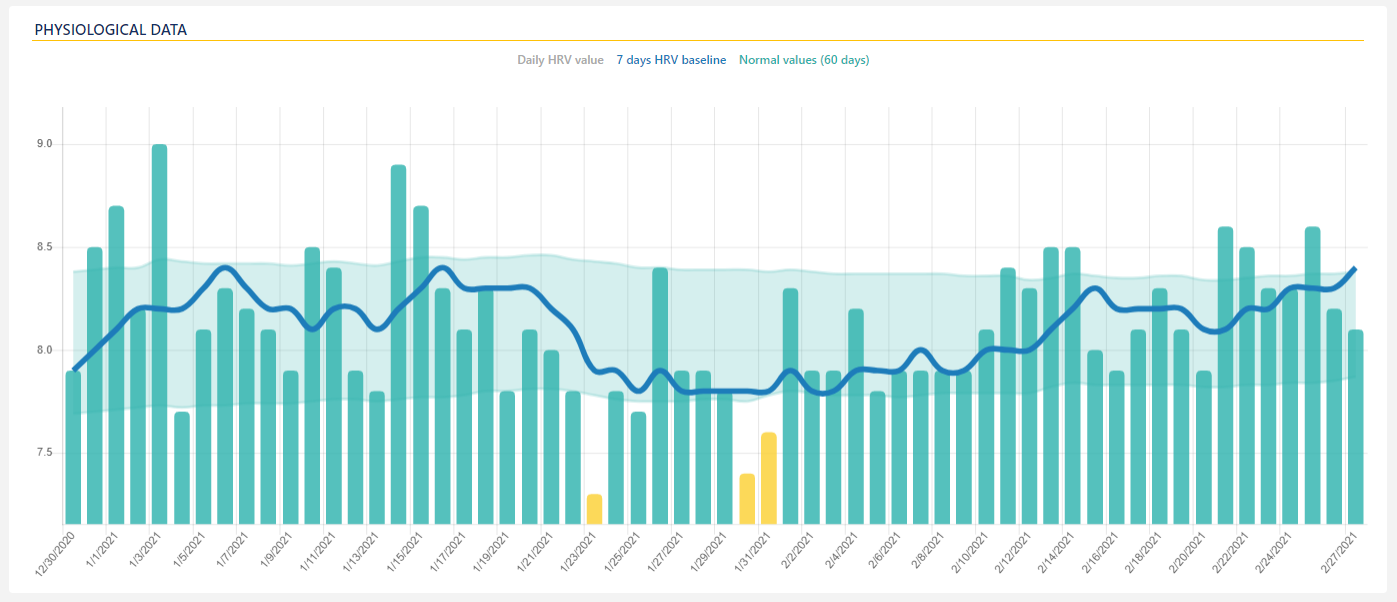 HRV values and trend over the last 60 days. The trend remained within the normal range for the entire period. 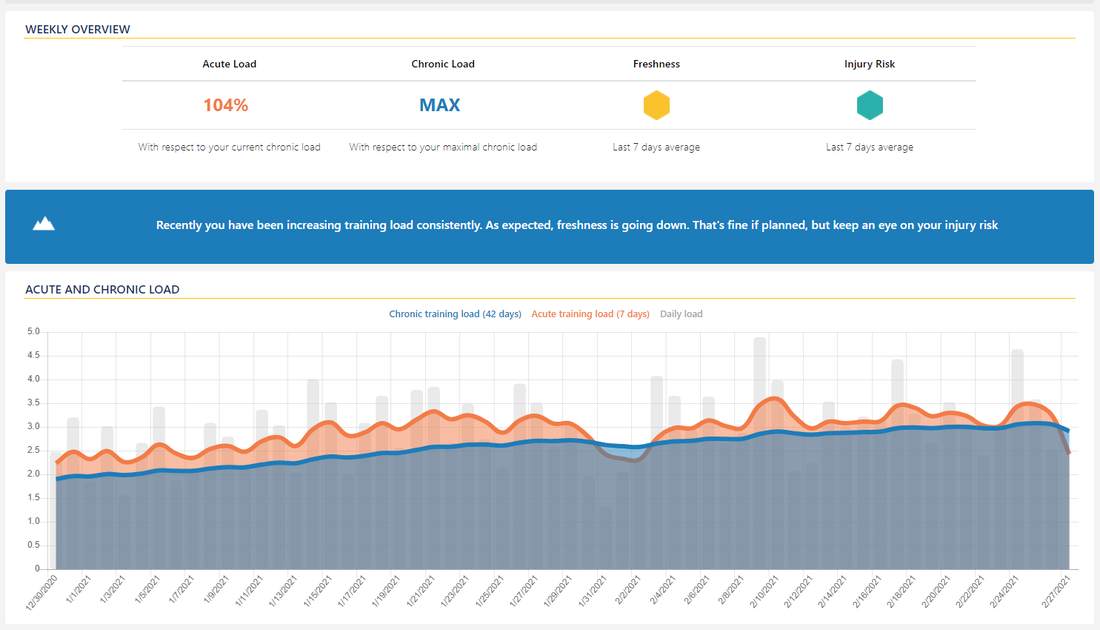 Training load metrics (part 1) over the last 60 days. A gradually increasing load as the base period was building Next I looked at the smaller details of freshness, injury risk and training monotony. My freshness scores were all low, but this was to be expected as I increased load and did not allow much recovery time each week. This metric is important and needs to be managed carefully through the training cycle. At this point I was happy with poor freshness, but I will be sure to reduce my training load to achieve better freshness as I approach my goal races. Despite the low freshness scores, my injury risk showed optimal load so I knew I wasn't overdoing my training. Finally in terms of load, my training monotony showed poor monotony meaning that my training sessions were all very similar. While it's not ideal to have poor training monotony, during the base period where almost all of my running was below AeT I'm not concerned about that. As I approach the race season I will have more race-specific sessions and more hard days and the monotony will be reduced. 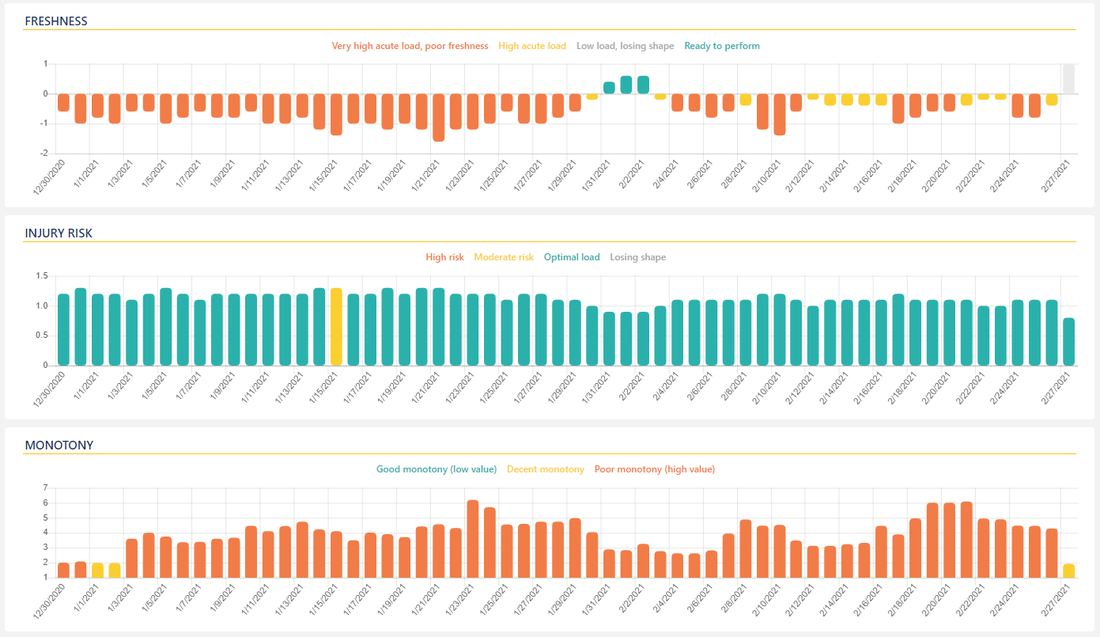 Training load metrics (part 2) over the last 60 days. Freshness was mostly pure due to the consistent acute load, but it was not so severe to result in injury risk. With a large percent of the training in Z1 and Z2 (85-95%) the training was monotonous, but by design. The last metric that I looked at, and the one that confirmed the value of my approach to the base training period, was aerobic efficiency. Aerobic efficiency shows the relation between output (pace) and input (heart rate). A lower heart rate for the same output, when consistently shown over periods of weeks, translates into better aerobic endurance. My aerobic efficiency jumped up in the last two months showing just how effective training at the right intensity had been. 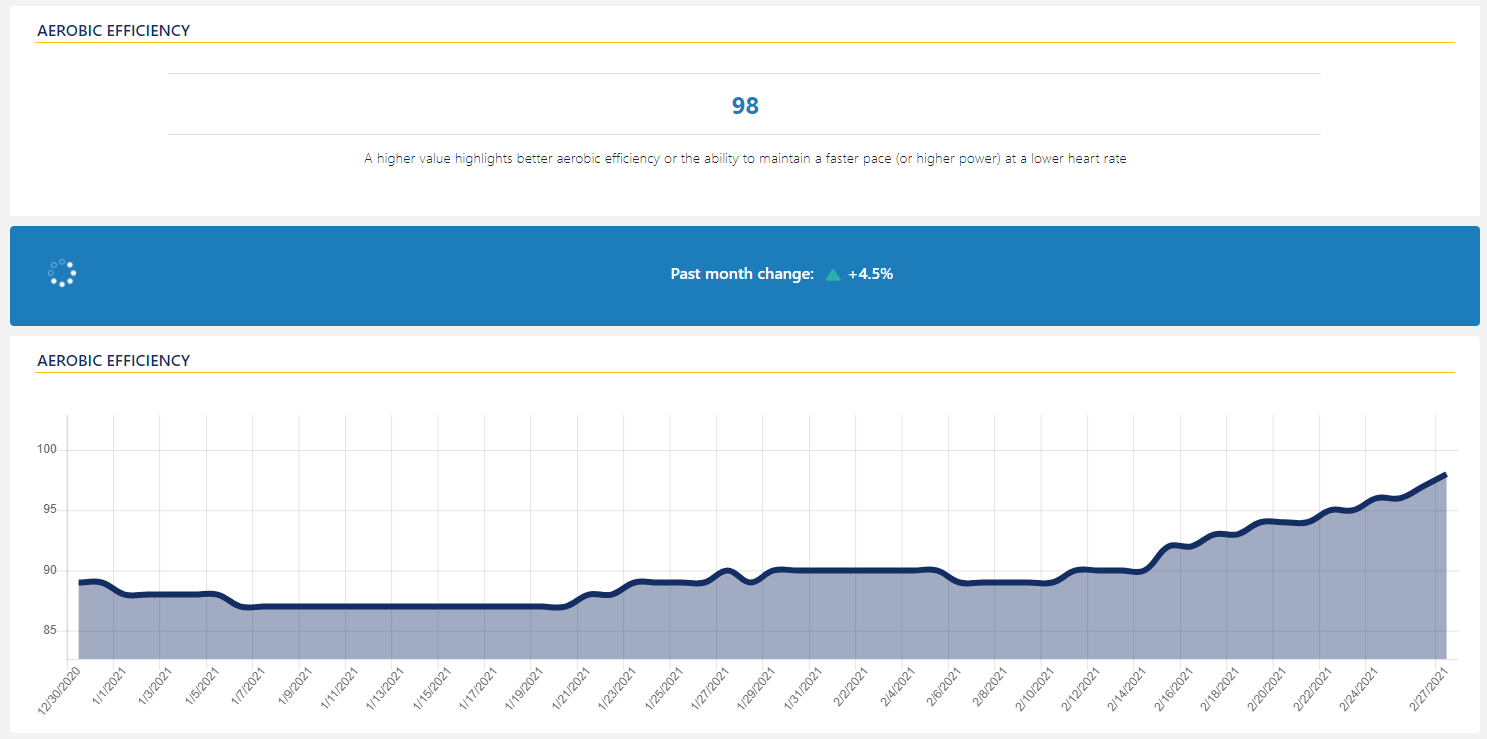 Aerobic efficiency over the last 60 days. From mid-January there has been a trend of improving aerobic efficiency proving that the base training is being effective. ConclusionThis year, I have had one of the most effective base-training periods I can recall. I managed to consistently increase my training load and I've seen steady improvements in my running performance. I'm certain that intensity control and staying below AeT was a critical factor that allowed me to achieve this training. Exactly how this worked I'm not sure. Perhaps running below AeT is the perfect stimulus to develop aerobic endurance, or perhaps running below AeT means it's possible to achieve a greater training load and a larger stimulus develops aerobic endurance, or perhaps it is an interplay between the two. Whatever the cause, I know it has resulted in positive improvements to my running and I'll be following a similar approach for every base-training period. I would encourage any athlete to take a similar approach and test this for themselves. With HRV Logger and HRV4Training Pro it is now possible and easy to achieve both intensity control and to assess the progress of your training. Other resourcesComments are closed.
|


Register to the mailing list
and try the HRV4Training app! 
|