|
Blog post by Marco Altini The Overview page in HRV4Training pro shows your daily heart rate and HRV, together with normal values and baseline, to ease interpretation of your recent trends In addition, you can also color-code the bars based on annotations such as alcohol intake or menstruation, as well as based on the daily advice, coefficient of variation and detected physiological response In the latest update of Pro, available for any user when logging in at HRV4T.com, we also added a few tips and explanations that should help you better understand what could be behind a recent change in physiology, as well as how the different algorithms work Here are a few examples. Recent literature as shown that during the luteal phase of the menstrual cycle, there can be a small drop in HRV. This is now reported in Pro when selecting Menstruation as annotation, as shown below: 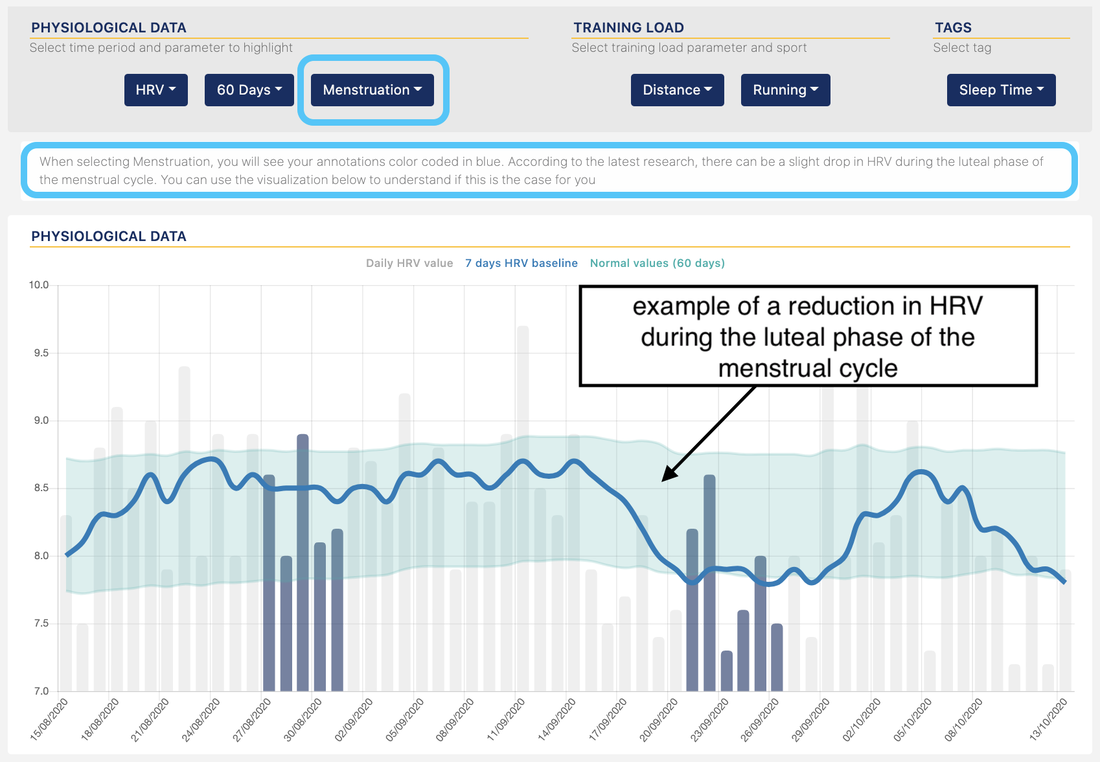 When selecting the Daily Advice, we report more details on how the daily advice is built: 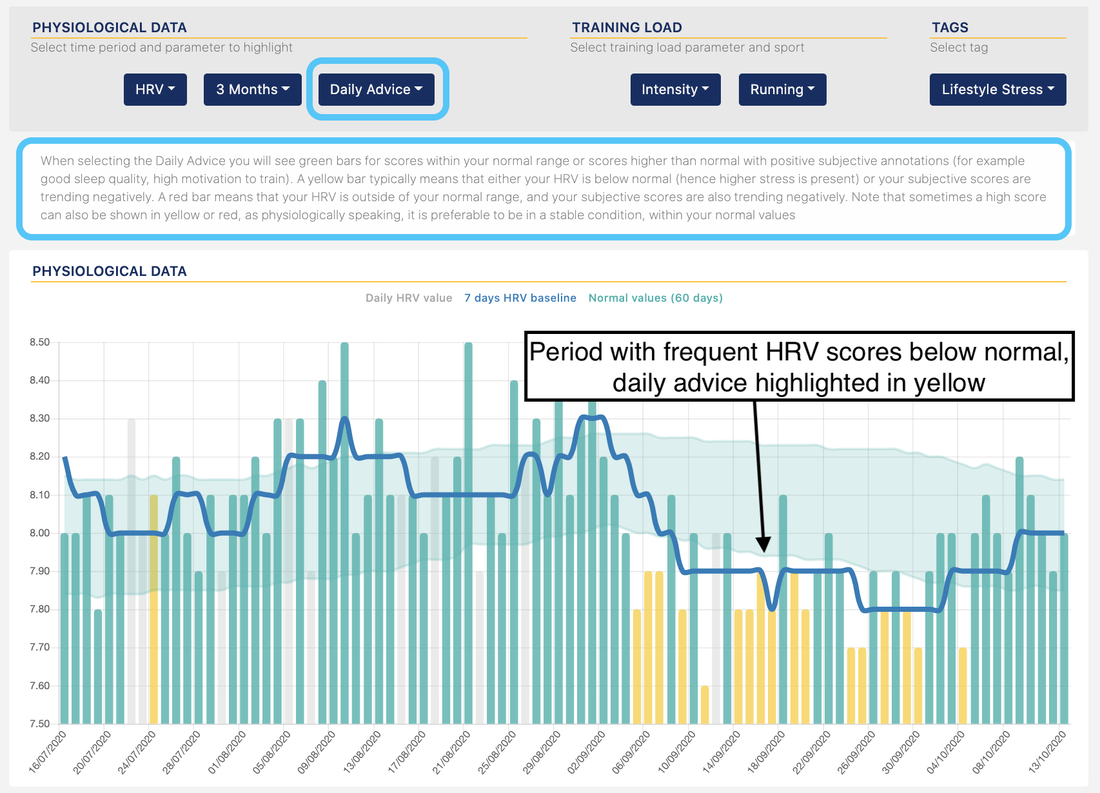 Here is an example for sick days: 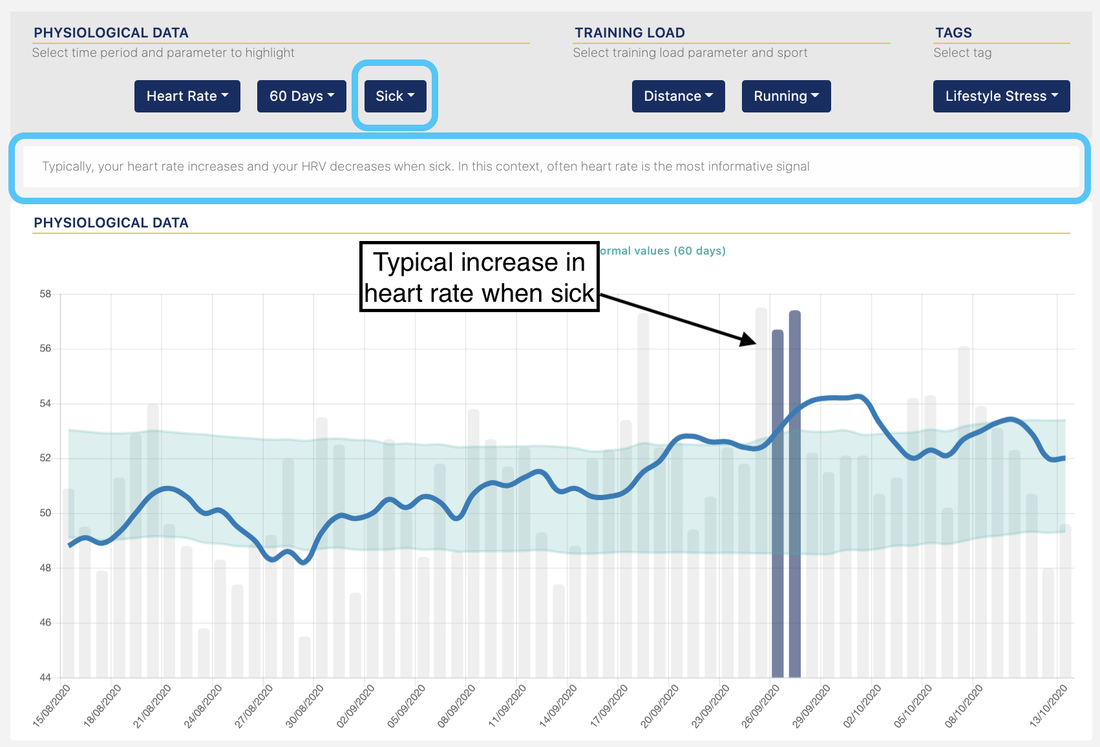 And finally for the Coefficient of Variation, including an explanation of how to read the data: 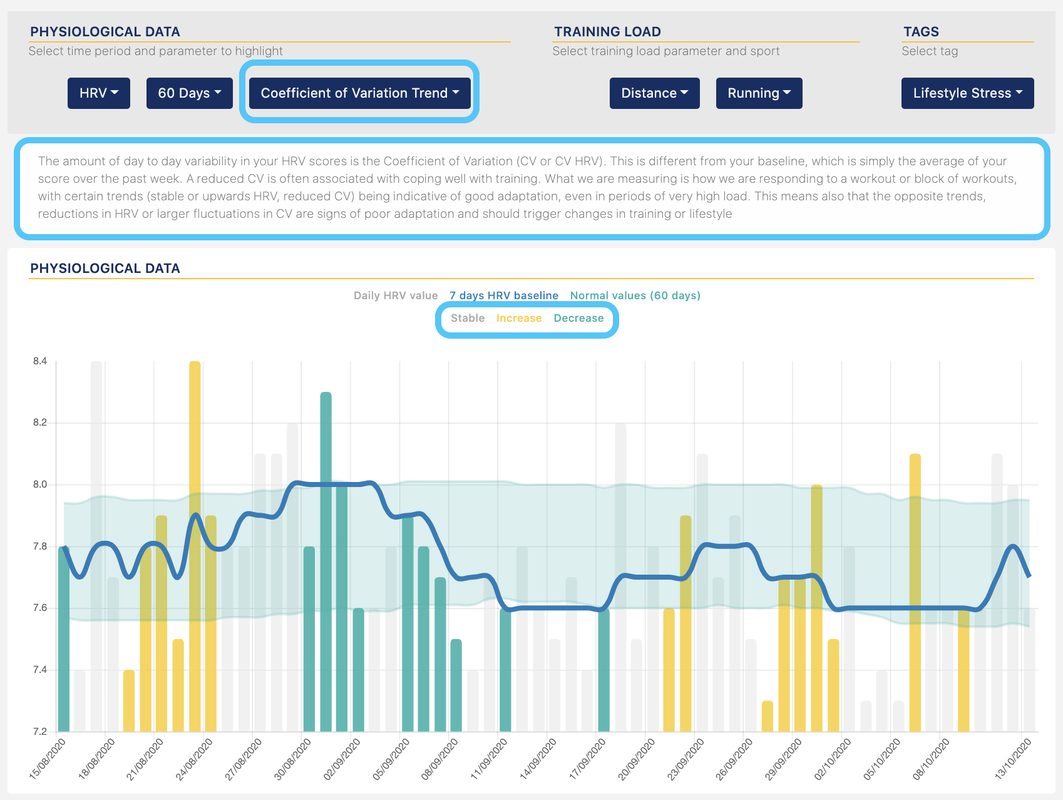 We hope you'll find the new update helpful
Comments are closed.
|


Register to the mailing list
and try the HRV4Training app! 
|